Software Development. 1. INTRODUCTION. Imagine that you are a newly hired software developer assigned to work on a code module that implements a user ...
Designing Task Visualizations to Support the Coordination of Work in Software Development Christine A. Halverson, Jason B. Ellis, Catalina Danis, Wendy A. Kellogg Social Computing Group IBM T.J. Watson Research Center P.O. Box 704 Yorktown Heights, NY 10598 USA
(krys, jasone, danis, wkellogg)@us.ibm.com all. You go to see Dave, a guy who has been with the team for years, who insists that his code is working correctly. You do not give up, and a back and forth, intermittent conversation emerges over how the backend should or could be implemented. Time goes on, the issue is not resolved; nothing you suggest or try seems to work; reasserting the change request just results in another preemptive resolve. You do not wish to escalate the issue to management; at least, not yet. One day you mention your frustration with Dave to a colleague, who surprises you by saying she has had exactly the same sort of problem with him; in fact, he is known for this kind of behavior. “The thing is,” she says, “he only codes to the spec. If you want your change, you’ll have to get it into the official requirements document.” 1
ABSTRACT Software development tools primarily focus on supporting the technical work. Yet no matter the tools employed, the process followed, or the size of the team, important aspects of development are non-technical, and largely unsupported. For example, increasing distribution of development teams highlights the issues of coordination and cooperation. This paper focuses on one area: managing change requests. Interviews with industry and open-source programmers were used to create designs for the visual inspection of change requests. This paper presents fieldwork findings and two designs. We conclude by reflecting on the issues that task visualizations that support social inferences address in software development.
A foundational assumption in CSCW is that work is socially organized and cooperative, often in subtle ways that require understanding the context as well as the specific work practice. Along these lines, many documented problems in carrying out cooperative work are about coordinating distributed work, tracking the state of complex projects, discerning the availability of remote colleagues, or as in the vignette above, accommodating the personal quirks or views of a key collaborator, or negotiating conflicting ideas of what the work is about [5, 28, 36].
Categories and Subject Descriptors D.2.2 [Software Engineering]: Design Tools and Techniques – evolutionary prototyping, user interfaces H.5.3 [Information Interfaces and Presentation]: Group and Organization Interfaces – collaborative computing, computer-supported cooperative work.
General Terms Design, Human Factors, Management
Software development has long been recognized as a domain where some of the most difficult problems are beyond technical or simple resource issues, as Brooks’ famous 1975 treatise on the Mythical Man-Month attests [7]. But in the thirty years since this work, much remains to be done in addressing such issues, which are often at the heart of CSCW concerns. Indeed, it is possible to argue that with current trends towards larger and more globally distributed development teams, coordination, social, and cultural issues – as well as tangled technical issues – have increased.
Keywords Social Visualization, Change Tracking Systems, Task Visualization, Information Visualization, Coordination of Work, Software Development.
1. INTRODUCTION Imagine that you are a newly hired software developer assigned to work on a code module that implements a user interface to a calendar. Another developer, Dave is responsible for the “backend” data module. As work progresses, you discover that a change to the backend module will be necessary for your code to work. You open a change request and assign it to Dave. Sometime later you are pleased to see the change request marked resolved, but when you try your code again, it still doesn’t work. Inspecting the backend code, you see that a change has not been made after
The process of handling change requests (CRs) in software development would appear straightforward. A problem is discovered and entered into an appropriate repository for tracking. The CR is assigned to a developer who proceeds to fix the problem, update the code, and subsequently the CR repository. The reality, of course, is rarely so straightforward, as many developers can attest, and as the public nature of Free/Libre Open Source Software (F/LOSS) projects, such as Mozilla, have made apparent. Access to the products and process of open source projects—such as code repositories, bug tracking data, and
Permission to make digital or hard copies of all or part of this work for personal or classroom use is granted without fee provided that copies are not made or distributed for profit or commercial advantage and that copies bear this notice and the full citation on the first page. To copy otherwise, or republish, to post on servers or to redistribute to lists, requires prior specific permission and/or a fee. CSCW‘06, November 4-8, 2006, Banff, Alberta, Canada. Copyright 2006 ACM 1-59593-249-6/06/0011…$5.00.
1
39
Vignette is based on several interview accounts. All names have been changed to protect privacy.
In contrast, projects today routinely involve a variety of communication activities to support both the development and maintenance of software. Smaller teams often manage by walking into each others’ offices [4]. Larger teams may not be able to use this tactic: team size alone means that developers will be more dispersed. As teams grow larger and more distributed, other complications for coordinating work emerge: establishing common ground, time zone and cultural differences, handling tightly coupled work, and so on [31].
communication paths in both email and chat rooms—affords a tantalizing glimpse of the social as well as the technical aspects of current software development. The work reported here leverages the visibility of F/LOSS projects, as well as a collection of semi-structured interviews and ongoing conversations with informants in a variety of roles and settings in software development, to better understand the difficulties and subtleties faced by members of globally distributed teams. Our findings led us to believe that there were opportunities to better support distributed development based on data already available in change tracking systems as a normal consequence of the development process. As a result, we have developed a series of visual prototypes that were progressively refined through follow-up interviews and conversations with software developers and managers.
There is a growing body of research aimed at understanding coordination and collaboration issues in distributed software development. Herbsleb and colleagues have carried out a number of studies of development in industrial settings, documenting a variety of coordination difficulties arising in globally distributed teams. Explicit coordination mechanisms used in the integration phase of a project included the overall plan, interface specifications, documentation and process. They found that all of the coordination mechanisms required filling in details, handling exceptions, coping with unforeseen events and error recovery – almost all of which required ongoing communication [22]. Grinter [19] points to the additional coordination work required for globally distributed reuse as falling into three areas: work to traverse boundaries, the coordination necessary to align and assemble multiple pieces of software, and the impact of organizational and environment changes. Globally distributed work consistently incurs a cost in time to complete over samesite, which the authors attribute to the increased communication needed to support coordination mechanisms working over distance [24]. Lest we assume geo-spatial distribution is the only culprit Perry and colleagues [32, 33] observed that even in samesite work programming must share time with other ‘tasks’ (such as meetings and email) that developers are expected to complete. This requires that the technical work be interrupted and distributed over time in ways that significantly impact coordination and productivity.
The contribution of this paper is twofold. First, through a combination of interviews with software developers and analysis of change management systems, we provide a current view of coordination issues surrounding change management in large, distributed programming teams. Second, we show through two of a series of visual design prototypes how information contained in, but not easily accessed, in change tracking systems can be harnessed and more appropriately presented to support social inferences that can aid coordination and management work. The nature of this undertaking crosses a number of disciplines. Thus, we begin by briefly reviewing related work on software development (particularly studies of open source and change request management) and work on visualization (to aid software development, and to support social inferences). Next we present our fieldwork and design prototypes. Finally, we discuss how interactive visualizations can support distance collaboration and issues for further work. The extension of this work to the specifics of various coordination theories—whether specific to Software Engineering [23] or CSCW in general [28, 36]—is beyond the scope of this paper.
F/LOSS projects provide another compelling view of distributed development. As a development practice F/LOSS is demonstrably successful, having produced robust, large-scale applications such as the Linux Operating System, the Apache Web server, and the Firefox Browser. Its success has attracted significant research interest, since the open source process seems to violate many previously-held assumptions of what is necessary for successful large-scale development. Mockus and colleagues [30] examined the development processes behind Apache and Mozilla. Others have mined the wealth of F/LOSS data to examine software processes as well as how the code functions as a socio-technical artifact for negotiation [12, 13].
2. RELATED WORK Software development requires marshalling many moving parts— both human and code—until the resulting software product has been released. In this section we focus on three issues relevant to CSCW. First, we touch on the study of programming as cooperative work, focusing on the recent detailed studies of F/LOSS. Next we review research that focuses on the sociotechnical aspects of managing software changes, particularly in distributed development. Finally we describe previous work on visualization in software development, and contrast it to previous work on social visualization.
Only recently have researchers begun building on F/LOSS studies by designing new collaboration support for software development. Awareness tools embedded in development environments include those explicitly meant to enhance F/LOSS development [10, 11, 20, 38] while others are applying lessons learned to industry [8]. Our work falls into this second category.
2.1 Programming as a Cooperative Activity Software development was probably less geographically distributed than it is now, but it has always been distributed over time – namely, over the lifecycle of a project. Code developed by an individual programmer was likely to (eventually) be maintained by someone else, who would take on the responsibility for fixing bugs detected after release, or adding features to future releases. Temporal distribution relegated any communication from the original programmer to his successors to be one way, embedded in either the code itself, or comments associated with it.
2.2 Change Management Traditionally, research on software change requests has focused on either the technical features of change tracking systems [26] or on ways to automatically identify, manage and ideally reduce defects [27]. (The notable exception is the use of bug tracking in
40
theoretical concerns in social psychology (e.g., social facilitation). Defining ‘social activity indicators’ as displays conveying social information such as the general level of activity, a view of what others are doing, and so on, they distinguished their notion from a more generalized notion of awareness, typified by, for example, shared representations (then) or buddy lists (now). Several researchers have explored the use of social visualization in computer-mediated communication, including IBM’s work on workgroup spaces such as Babble and Loops [6]. Donath’s work on chat circles and other visualizations [14, 15], and Smith’s work on Usenet authoring behavior [37]. This work has shown that social visualizations can impact the quality of user experience (e.g., Babble’s social proxy was associated with a “friendlier” chat environment), can form a basis for inferences and work practices that would otherwise be difficult to enact, and can provide information that motivates (or de-motivates) participation. One goal of the work reported here is to explore how social visualization might be applied in change management.
detailing a theory of coordination mechanisms [36].) The debugging process also has been used to probe other issues in software development, such as von Mayrhauser and Vans’ [29] discussion of program understanding. The trail of communication left by F/LOSS data has enabled an expansion of research focus to include collaboration issues. For example, Carstensen and colleagues’ [9] analysis found that “one out of four bug reports required discussion and negotiation between a tester and designer, or between the spec team and a designer” (p10). Sandusky and Gasser [35] focus on how negotiation and coordination are a critical part of software problem management. F/LOSS data have also enabled a more detailed empirical analysis of communication than has heretofore been possible. Some research has emphasized how “lean” the media used can be, describing communication via text alone (whether IM, chat rooms or email) [12, 17, 20]. This contrasts with other findings that suggest that some development activities require face-to-face interaction to be successful [9, 24, 31, 36].
3. APPROACH
Finally, analysis of F/LOSS data has also provided details on the social aspects of coordination, leading to attempts to foster support for more nuanced interaction. Cubranic et. al. [11] exposed project history within an Eclipse integrated development environment (IDE) to reduce the learning curve of newcomers. Other work has argued that tools that explicitly support social aspects of communication improve coordination [10, 21].
Over the period of a year we collected two kinds of data from four main sources. Collecting data from these sources was interleaved with the design process and thus driven by the needs of the process at a particular point in time. Our first design ideas were sparked by conversations with a colleague of one of the authors who is a driver (i.e., has oversight responsibilities) in a major F/LOSS effort. His issues led to the early focus on change tracking. We then carried out nine (9) semistructured and unstructured interviews, primarily via email and instant messaging. All informants were programmers, some acting primarily as individual contributors, others with management responsibility. All were in multi-person development teams.
2.3 Visualization in Software Development and Social Visualization Work in visualization in the domain of software development has mostly focused on technical aspects. Ball and colleagues [2] argued that version control system data could be visualized in the service of analyzing the evolution of a system over time. Pinzger and colleagues [34] followed much the same line of reasoning, using complex data models and condensed graphical views (Kiviat diagrams) based on source code and release history to identify critical trends in the evolution of very large software systems (e.g., to identify candidates for refactoring). Closer to the approach taken here, Eick and colleagues [16] designed a number of visualization tools to “facilitate rapid exploration of high-level structure in software change data and also serve as a powerful visual interface to the data details” [33, pg. 396].
The interview covered the change tracking system being used in the informant’s current project, its usefulness and how it could be improved. We asked how informants decided what to work on next, and about possible features such as visualization, alerts and aggregate views that might assist them in this or more generally in accomplishing their work. We also asked about the different roles played by team members, whether they used the bug tracking system differently, and what would make the system better for people in different roles. We carried out analyses of change tracking systems that were identified by our informants. We looked at four existing systems (CMVC, Bugzilla, ClearQuest, and Radar) as well as simple text files, focusing on their functionality and organization.
A different approach is to focus on task information in a way intended to support social inference. In the “task proxy” described by Erickson, Huang, Danis, and Kellogg [18], people are displayed as hexagons arranged in terms of their place in an organizational structure. The color of a hexagon represents the status of that person with respect to a task (e.g., whether or not they have completed it). This kind of representation is useful for getting a quick overview of the state of a task across the organization. If the task proxy is made visible to participants, social dynamics emerge (e.g., peer pressure or proactively assisting those who are lagging behind). While the task proxy is a kind of social proxy because it represents people and activity, the task is the focus and person information is backgrounded in the visualization; what is seen at a glance is the state of the task.
Once design began in earnest we carried out an additional eleven (11) interviews with programmers who self-identified as being in large code development projects. These face-to-face interviews were focused on three areas: a more detailed understanding of work practices, unmet needs in the change tracking system being used, and feedback on early prototypes of our visualizations. Finally, for one change tracking system (Bugzilla), we also analyzed particular CR samples, looking in detail at the kinds of discussion that accompanied their (sometimes long) journeys from initial filing to resolution. One can track the progress of a CR by looking at the states it has passed through. In Bugzilla, these states (Figure 1) typically include: unconfirmed (newly entered into the change tracking system), new (a defect that has been confirmed by an authorized person), assigned (a specific
More generally, interest in social visualization has grown over the last decade. Ackerman and Starr [1] made one of the earliest arguments for the utility of social visualizations based on
41
level, such knowledge enables developers to keep abreast of the state of the code as it is developing. One of the technical managers we interviewed, who has managed both small and large teams, noted that having what he called a “bird’s eye view” was particularly important in small teams where, ironically, there may be more opportunities than in larger teams for “stepping on each other’s toes” since developers typically work on multiple parts of a project in parallel. With detailed knowledge of the work of others, it is easier to anticipate how one’s own code will affect and integrate with other code, and thus make “creating conflicts unnecessarily” less likely.
individual has responsibility for resolving the defect), resolved (assigned person submits a presumed fix), verified (fix has passed testing) and reopened (a fix has failed testing). Unconfirmed
New
Assigned
Resolved
Verified
4.1.2 What (Who) Broke My Code? Knowing who is doing what becomes particularly critical when a developer’s code breaks as a consequence of someone else’s work. While we noted above that awareness can help to avoid breaking the code of others, several of our informants noted that nevertheless this happens. When it does, it can be difficult to diagnose what was the root cause. As one developer put it, there is a need to figure out the “probability that is has to do with this person.” The developer can track this down by figuring out who has “touched” his components recently, but in most systems this is time consuming and indirect.
Reopened
Figure 1. Mozilla’s Bugzilla CR state-transition diagram
4. Findings At their heart, change tracking systems are just repositories for textual descriptions that have a number of attributes such as who the change was filed by, who is assigned to work on it, its current state (unconfirmed, assigned, resolved, verified, etc.), comments and discussion, and more. Often they are customizable, supporting a variety of approaches to software development. For example, an increasingly common practice in F/LOSS (and distributed projects more generally) is to “vet” a proposed fix prior to incorporating it into the software. A developer devises a piece of code to address the change request, then attaches it in the form of a patch to its change request so that it can be vetted by other developers. When the change is approved, it is checked into the source code repository and the associated CR is updated.
4.1.3 Understanding New Bugs When a new, unconfirmed defect is entered into a system, the first order of business is to figure out what it is, where it belongs (i.e., to what programmer or code module it should be assigned), whether it is a duplicate, and so on. Once a developer is assigned to the bug or begins to fix it, s/he will have a more focused need to find out what defects others are working on. One informant noted that he would like “to find possibly-related bugs to the one I am working on.” Because of the interdependencies in people’s codes, finding the people working on related bugs is often critical to fixing one’s own defect. In addition, several informants pointed out that multiple related bugs could be a sign of a larger structural issue with the code, potentially requiring redesign.
Change tracking systems are a central mechanism for coordination because they track the state of the project, the people involved in its various parts, and contain discussion about proposed changes. They provide a locus for managing and prioritizing work, often through extended interactions that involve debate among developers, reaching consensus, or soliciting management input. They also comprise an historical record of a team’s activity as development progresses. In discussing the strengths and weaknesses of change tracking systems, our informants described a variety of difficulties they had encountered: problematic patterns in the course of resolving bugs, bugs whose significance is not properly understood at first, and more generally the complexities of understanding what is really going on in the “n-dimensional space formed by bugs, code, symptoms, people, and revisions” as one developer phrased it.
4.1.4 Complex Bugs Many defects that occur, especially at a system level, require the coordinated effort and skills of multiple people to fix. Knowing where to assign defects that bridge between components is also difficult. These sorts of complex bugs require not only finding the set of people who need to work together to resolve them, but coordinating the solution and how it will be implemented. Making an analogous point in the case of cross-organizational code reuse, Grinter [19] refers to this kind of work as ‘recomposition,’ meaning “all the coordination among a team of developers to ensure that their code changes work together” (pg. 152).
The picture of work that emerged from the interviews is one characterized by deep and complex interdependencies among the team members. In what follows, we provide a more detailed account of our findings organized around two themes that emerged from the interviews: coordination and history. We then summarize key findings before turning to a description of the visualizations.
4.1.5 Managing the Team Managers have their own reasons for staying abreast of what is going on across the development team. One of our small team managers noted that it is important for him to see not only what each team member is working on, but also to keep track of each person’s work history. This helps him to manage each developer’s workload and enables him to act more strategically to bring the project to successful completion in spite of the quirks or weaknesses of particular team members. Turnover in personnel or changes in areas of responsibility are another reality that affects managers and developers alike and have the potential for significantly disruptive impacts.
4.1 The Social Enactment of Coordination 4.1.1 Avoiding Stepping on Each Other’s Toes Many of our informants noted the importance of maintaining knowledge of what other people on the team are doing. At a high
42
4.2 The Social and Technical Life of Change Management: Problematic Patterns A second major theme that emerged from the interviews concerned the value of historical information of bug lifecycle and of individual team member activities. Several of our informants described ways in which being aware of the behavior of bugs and individuals or patterns of behavior were critical to the development process. In the case of problematic bug patterns, this was supplemented by our analyses of change tracking systems.
4.2.1 Ping Pong Patterns Viewing Figure 1 more closely we see that a state machine loosely governs how CRs move through change tracking systems. Transitions between these states are generally not automatic, instead requiring explicit human intervention to move a CR from one state to another. In Mozilla’s Bugzilla repository, the bestcase path is from Unconfirmed to Verified, but many other paths are possible and some of these paths, particularly if there are recurrent loops, are potentially indicative of deeper problems.
Figure 2. An example Bugzilla history for a specific CR, showing one modification to the CR per line
For instance, CRs that are repeatedly resolved and reopened or repeatedly reassigned (two kinds of “ping pong” as it was referred to by our informants) are worth looking into more deeply. A resolve/reopen cycle may mean that there is disagreement among team members about what it means to fix the problem or implement the feature – someone (perhaps several people) keeps thinking the CR has been addressed and others feel that it has not. An assign/reassign cycle, on the other hand, may mean that the CR is not finding the right owner. Instead, each assignee looks at the CR and decides that they aren’t the right person to work on it. This could indicate a number of problems including a structural problem in the software or an organizational gap. Ping pong problems like these can be difficult to detect because as one informant put it “if you look at the state [of a particular defect], it always appears that someone is working on it, but in reality the buck keeps getting passed and no progress is being made.”
4.2.1.1 Resolve-Reopen as a Cultural Issue One informant recounted an experience in the cross-cultural use of a change management system involving resolve-reopen. In this case, a group of Chinese developers began using CMVC along with American developers who were already experienced in using it. The Chinese developers were used to a change tracking system in which code patches were managed separately from bugs; thus their practice was to mark a defect “resolved” when picking it up to work on it – in a sense giving an “honor promise” to fix it, as our informant called it. This led to confusion for American developers who were used to marking bugs as resolved only when the work was completed and the code attached. In addition, CMVC integrates management of code revisions and bug tracking; once defects are marked resolved, code can no longer be attached. Thus, when a Chinese developer marked a defect as resolved before revising the code, they were blocked from attaching it when it was done. Until these differences in work practice and their interaction with the change tracking system were understood, American developers would reopen bugs marked ‘resolved’ that did not have attached code. This led to confusion on the Chinese side and a re-assertion of “resolved.”
Ping pong patterns can also be difficult to detect because in most change tracking systems it is hard to assemble and see the relevant information. For example, in Bugzilla, these are the steps: 1.
Use the query interface to find a CR of interest.
2.
Navigate to the CR’s history page. The history is often a long date-ordered list of every modification made to the CR (Figure 2), including many changes that are not state changes (e.g., annotations). Thus most lines in the history are not relevant to identifying problematic patterns.
3.
Filter the CR history to show only the specific modifications needed to see a problematic pattern. Usually this means throwing out everything but the state changes.
4.
Read through the data and decide if a problem exists.
4.2.1.2 Is It or Isn’t It a Bug? Assign-Reassign as a Social Issue In another situation described to us, a tester discovered a UI problem, created a defect and assigned it to the UI developer. The UI developer analyzed the defect and realized the problem was deeper in the stack (an Enterprise Java Bean problem) and assigned it to the EJB developer. The EJB developer analyzed the problem and decided this was how the EJB backend was supposed to operate, so returned the bug as resolved (“this is not a defect”). The tester, noticing that the bug was marked ‘resolved,’ retested it, determined that it was not fixed, and sent it back to the UI developer, whereupon the cycle began again.
This process is complex enough that it is seldom used. In our fieldwork, several people indicated that discovering problematic patterns was difficult and that they could go undetected for long periods of time to the detriment of the project. In CMVC, simply generating a CR’s history is an expert-level task involving multiple custom queries.
In this case, the assign-reassign pattern is more complex than the simple case of a defect not finding the appropriate home, which can occur because developers are too busy or not paying close enough attention. Instead, this story reflects disagreement about whether the UI consequence of the EJB backend will be treated as
43
CR is generating based on comments, subscribers, duplicates, and votes. Another perspective is it shows the “wear” on a bug–who touched, is interested, or argues for it [25]. Popularity gives the development team another way to assess the impact fixing a defect will have on the overall effort, or on the audience for the software (e.g., customers, developer community).
a defect or not, and if so, how it should be resolved (e.g., by redesign of the UI or of the backend).
4.2.2 What’s Falling through the Cracks and Why: Prioritizing and Managing Work Informants with management responsibility were particularly tuned in to the risks of missing something important, letting a defect go too long without resolution, or otherwise catching problems that for whatever reason were falling through the cracks. Although all development processes have mechanisms (like severity codes) for managing such risks, they are not always sufficient. There are a variety of problematic patterns in this category; we describe some of them here.
4.2.3 Bug Reporting at the Wrong Level We have previously discussed some of the common reasons that CRs may begin to “ping pong.” An additional cause may be that the individuals who report the CRs are reporting them at the wrong level of detail. One value of being able to track the history of the team’s behavior, especially for team leads or managers, is to examine CRs from this standpoint. If a manager sees many CRs that ping pong for a while and then end up getting decomposed into multiple CRs, she may suspect a problem with reporting. As one of the large team managers explained: “When a defect is assigned, a number of things might be fixed and a lot of files might be touched in order to address that one defect. This means that the defect was too high-grain and should have been decomposed into a number of bugs. A flag should be raised in this case so folks are aware of this bug reporting issue.” Investigation might reveal that over-broad reporting is attributable to one or two individuals, in which case an intervention can be targeted.
4.2.2.1 Severity + Age One of our informants with management responsibilities maintains a query that shows defects sorted by severity combined with age (an expert level task in the change tracking system he uses). His goal is to make sure the team addresses “Sev 2” assigned defects within 48 hours. When this doesn’t happen, there can be a variety of reasons – from a developer waiting on information or a response from another developer, to a messy bug that requires redesign work that is not yet completed, to the assigned developer simply being overloaded and unable to get to it quickly. While some of the relationships among bugs may be captured in dependency graphs (e.g., in Bugzilla), many “softer” dependencies will never be codified. This increases the potential utility of understanding what others are working on, and their current workload.
4.3 Summary of Key Findings To summarize, we can place the issues articulated by our informants into the following three broad (though not mutually exclusive) categories.
4.3.1 Technical Issues
4.2.2.2 Unevaluated Patches Developers can move bugs to the ‘Resolved’ state but testers are the only ones who have the power to close them (i.e., mark them ‘Verified’). In some development processes, an unevaluated patch means the tester isn’t doing their job. In open source processes it often means the driver isn’t doing their job. Either way, unevaluated patches can indicate a problem in the process since a fix will not be checked into the shipping product until it passes testing.
On the one hand, there are still a number of technical issues in software development that are just hard. “Ping pong” patterns in assignment and resolution can result from a number of issues, including complex bugs, not understanding new bugs, or gaps in the structure of the code. Other issues include avoiding breaking other people’s code, and figuring out what or who has broken one’s own code.
4.2.2.3 Zombie Bugs
On the other hand, there are social and cultural issues that can surface as the apparently same problematic patterns, as in the conflicting work practices of the Chinese and American development teams or whether a bug is really a bug. There are also cases where working out technical issues involves social information: avoiding breaking another person’s code unnecessarily, figuring out what has caused your code to break and who to talk to about it. We certainly heard stories (as in our opening vignette) about developers who ended up wasting a lot of time treating something as a technical problem that was really a social or cultural problem.
4.3.2 Social and Cultural Issues
Zombie bugs are defects that have lain dormant for a (relatively) long period of time. As one informant pointed out, “if your high priority bugs are turning into zombies, there’s something wrong with your project management.” Low priority bugs that turn into zombies may not be a problem. However, being aware of zombie bugs was reported as an important part of project housekeeping.
4.2.2.4 Bugs that Block Too Much Another reason to move a defect up in priority for attention is the amount of other work that is being blocked by it. As one developer said in answer to our query about how he decides what to work on next, “That’s a good question; because sometimes you know you’re supposed to work on something but you really don’t feel like it… [nevertheless] the high priority stuff that is keeping people from doing their work is just that – high priority…[that’s] the high order bit.”
4.3.3 Process and Management Issues Finally, there are patterns of behavior that indicate issues with the development process itself, or that require managerial attention. These include reporting bugs at the wrong level and working around less than optimal characteristics of team members. Another set of issues revolves around monitoring the overall development process and becoming aware of possible problems based on severity+age, unevaluated patches, zombie bugs, blocking bugs, or bug popularity.
4.2.2.5 Popular Bugs Another dimension that is often hidden in current tracking systems is what could be deemed the bug’s ‘popularity’–a composite attribute reflecting the amount of interest a particular
44
this view might provide the new programmer with the ability to see patterns in the way his colleague handles bugs (i.e., by inspecting bugs to which the colleague is assigned). While seeing a pattern does not definitively diagnose or fix the problem, drilling down further might help distinguish between technical and social issues or point the programmer towards other colleagues with whom to talk about the situation.
5. Design Prototypes for Change Management We now turn to some of the visualizations we explored in response to our fieldwork. We had two goals in developing the prototypes: 1) to leverage information already contained in bug tracking systems, but that was difficult for developers to get at; and 2) to create visualizations that would address problems that were significant for our informants as revealed by our fieldwork. We felt visualizations could help with many of the issues described above by making the history of a CR visible, by exposing tracked details, and by aggregating different kinds of data across CRs. We present two of the prototypes we developed and discuss how they might be used by developers and managers to address change management issues.
We validated this prototype by running it against data from the Mozilla and Eclipse F/LOSS projects. The prototype indeed exposed problematic patterns in both datasets, but we were curious to know if there were CRs that exhibited the patterns to an egregious extent. This appeared to be the case; examining the CRs with the most resolve/reopens and assign/reassigns, in each dataset we found between 20 and 30 CRs that had 4 or more occurrences of these patterns within the year. This suggests that our informants’ concern that things could fall through the cracks was justified. While 20-30 CRs out of thousands2 represents a very small proportion of the total, revealing the pattern helps to ensure that someone notices that there might be a problem and evaluates it.
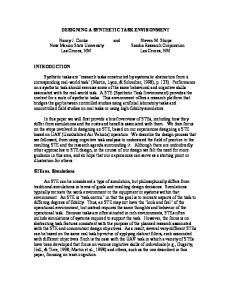
5.1 Work Item History Prototype One of our earliest prototypes sought to expose the history of state changes for individual bugs, which was so difficult to see in existing bug tracking systems. We built a Java prototype showing state changes over the past year for each bug (Figure 3). In this visualization, each line corresponds to a bug, with each pixel width representing a day. State changes are portrayed by color: dark orange bars (A) in the display are reassigns, and green bars (B) indicate when patches were provided. If the background is orange (C), the CR is open and if it is white (D), the CR is closed (resolved). Lastly, dark bars (E) show any of the myriad other types of operations that can happen against a CR (comments, dependencies changed, people added to cc: list, priority changed, and so on). The higher the bar, the more of these operations occurred on a given day.
5.2 Social Health Overview Prototype The Work Item History prototype assured us that problematic patterns existed in change tracking data and could be visualized. But examining CR histories one at a time would not help developers or managers responsible for many bugs, or for large components or teams, monitor the overall progress of their project. Some kind of interactive overview with drill down to individual CRs seemed to be called for, particularly one that might support coordination issues identified in our fieldwork. The Social Health Overview prototype was designed to address these needs and to extend the number of historical patterns that could be viewed. It was developed in Java using the Piccolo framework [3]. This prototype (Figure 4) provides a continuously zoomable view of all open CRs in the dataset. The CRs are shown as circles and laid end-to-end like a bar chart. The prototype displays data from 15 modules of the Eclipse Bugzilla database — a total of over 10,000 bugs. Figure 4 shows a control panel on the left and the resulting visualization of CRs on the right. The view is at a medium level of detail where component names are not visible.3 From left to right CRs are grouped by the Eclipse component to which they belong, and are laid out according to the order, color and size parameters of the control panel. In this case, the order is by problematic pattern and the colors indicate different types of problems, as shown in the key. For instance, green indicates an unevaluated patch, brown indicates a zombie, dark grey is an assign/reassign, and so forth. Circle size indicates the intensity of the problem based on its “heat” (a composite measure based on all seven of the patterns listed in the color key). CRs are ordered with the highest intensity CRs at the bottom and becoming lower intensity moving upwards.
Figure 3. Work Item History showing CR state changes over the course of a year. Each line represents a single CR. This prototype makes problematic patterns visible over time. For instance, users might see that a bug had numerous resolve/reopen cycles in the middle of the year but none recently. Or, they might see that although a CR had repeated reassignments earlier in the year, a recent patch could indicate that it might be nearly resolved. The design also highlights CRs that go from high to no activity (e.g., the fourth line in Figure 3). Such zombies might represent CRs that are falling through the cracks, a repeated concern of our informants. Work item history may also serve as a basis for social inferences. With respect to our opening vignette
45
2
The approximate number of CRs in the database snapshots used for our prototypes.
3
Some usability issues like always displaying axis labels were not easily coded in the tool being used for the prototypes.
Figure 5. Social Health Overview: Flyover of a CR. Pointing at a CR results in a fly out tag that summarizes key information. Clicking on the CR will bring up its entry in the underlying change tracking system.
Figure 4. Social Health Overview. This medium-level view shows open CRs laid out end-to-end according to the settings in the lefthand control panel: left to right by component (rectangular groups of circles), and within component by pattern (each pattern in a different color as indicated by the key). Circle size represents the bug’s “heat,” a composite metric based on the patterns represented in the color key.
The Social Health Overview can also support social inferences by making it easier to see patterns associated with individual developers. Figure 6 shows the Eclipse CRs within components displayed by assignee. To someone just joining the project, such a view can provide important orienting information about who to go to for questions and issues about particular components. For more seasoned team members, it can help identify who is working on related bugs, or the people who need to coordinate a fix to a complex CR.
Figure 5 shows the result of pointing at a particular CR in the display. The fly out tag summarizes key information about the CR including its id, name, component, assigned developer (or “inbox” if it is unassigned), top issues, and “heat” index. In the most recent version of this prototype users can click on a CR to bring up its entry in the underlying change tracking system (here the Bugzilla database for the Eclipse project). An intermediate step before showing the Bugzilla entry might be to link to the Work Item History visualization for the CR to enable a more detailed inspection of patterns in its recent history. The Social Health Overview may help developers and project managers with the kinds of coordination issues described by our informants. In terms of technical issues, problematic patterns can be revealed relatively easily. The compactness of the visual representation allows a large number of CRs to be monitored at a glance, and the control panel allows particular patterns of interest (e.g., unevaluated patches, or ping pong patterns) to be singled out for inspection. The visualization can help address process and management issues as well. For example, by ordering and coloring bugs by assignee, a project manager can recognize problems like numerous hot bugs in the inbox4 or team members being overloaded; this is particularly useful when prioritizing work and in load balancing across developers. The prototype can also support social inferences that bear on social and cultural issues. For example, with the resolve/reopen problem described for the Chinese and American distributed team, a manager might have noticed a large number of CRs with resolve/reopens in a component being worked on by this team. Knowing that the component involved a newly formed distributed team, the manager might have suspected confusion in the team about the process being used.
4
Figure 6. Social Health Overview showing bugs grouped by component and colored by assignee. We are just beginning the process of more formally testing the Social Health Overview, taking a multifaceted approach of a new set of interviews aimed at eliciting an even more detailed understanding of approaches to change management, laboratory evaluation of the visualization vs. a traditional change tracking system on a set of representative tasks, and a limited deployment of the visualization “in the wild.” While the prototypes have been shaped by what we learned from the fieldwork, only through empirical evaluation will we be able to determine the extent to which the prototypes succeed in improving the development process as we envision.
6. DISCUSSION Software development is a fundamentally collaborative process ― a characterization that many in both the CSCW and Software Engineering communities have recognized. While techniques such as extreme programming illustrate the power of tightly coupled coordination, the majority of development situations are distributed in space and time, while the code itself remains tightly coupled.
‘Inbox’ is often the default assignee when there is no developer assigned to work on the CR.
Brown and Booch [8] characterize the non-coding practices necessary to move software development forward as “points of
46
work items. As we discussed, the Social Health Overview supports a number of ways that, for example, a project manager can keep a process on track or improve it if need be.
friction, because energy is lost in their execution which otherwise could be directed to more creative activities that contribute directly to the completion of the project’s mission.” This view reinforces the observation of Perry and colleagues [33] that programmers spend a large amount of time doing things other than programming.
As we continue this work we are exploring feedback that suggests these visualizations might aid not only problem detection as it develops incrementally, but also the detection of emergent patterns across a large development effort. Preliminary feedback suggests that this information provides better support for the communication and coordination necessary to facilitate software development. As we complete more direct and detailed evaluation of these prototypes we aim to expose more details about how a combination of social and task visualization can alter the work practice of those involved in the development lifecycle and provide better support for communication and coordination needs.
Of the six points of friction in the daily life of a developer identified by [8], half involve coordination: a) inefficient work product collaboration; b) maintaining effective group communication, including knowledge and experience, project status, and project memory; and c) stakeholder negotiation. Our informants’ accounts elucidate both more detail about such instances of friction and how they are problematic, leading us to a richer understanding of current coordination issues in software development. In this paper we have focused on specific patterns that can be extracted from the data in change request systems that address our informants’ concerns with understanding, managing, and resolving change requests. Their reflections reveal how and why collaboration may be inefficient — such as the culture clash described in section 4.2.1.1.
7. ACKNOWLEDGMENTS Our thanks to the many developers and managers who took time to talk with us, and particularly to John Vlissides, who will be greatly missed as a brilliant and gracious colleague.
8. REFERENCES
These insights led us to develop a series of prototypes (not all shown in this paper) intended to help developers visualize potential problems along a number of dimensions including some that were oriented around people, some that were oriented around abstract notions of bug status (e.g., “heat,” a composite of several problematic patterns), and others that were oriented around what we characterize as fundamental entities of software development (such as bugs and other change requests, components, and libraries). Surfacing and aggregating many of the details previously obscured in CR systems we open the opportunity to detect where social issues interact with technical issues.
[1] Ackerman, M. S. and Starr, B. Social activity indicators" interface components for CSCW systems. In ACM Symposium on User Interface Software and Technology (UIST). 1995. (Pittsburgh, PA,159-168. [2] Ball, T., Kim, J. M., Porter, A. A. and Siy, H. P. If your version control system could talk. In International Conference on Software Engineering (ICSE) Workshop on Process Modelling and Empirical Studies of Software Engineering. 1997. (Boston, MA,May 17-23). [3] Bederson, B. B., Grosjean, J. and Meyer, J., Toolkit Design for Interactive Structured Graphics. IEEE Transactions on Software Engineering, 2004. 30,8 535-546.
The most mature visualizations that were eventually produced (exemplified by Figures 3-6) were oriented around fundamental entities. We converged towards these visualizations based on feedback from informants on what kind of visualization would be most useful. Yet unlike some visualizations in the software development domain oriented around fundamental entities, such as versioning systems, our visualizations do make visible social and task information, albeit in the background. After all, change requests are tasks in themselves. In particular, the historical view of bug state changes provides a resource for coordinating activity ― for an individual developer perhaps deciding what to work on next; for a project manager, deciding where to focus the group’s attention. The patterns of problematic bug states can be inspected by all to see who is responsible for each state change, or to see which individuals may be overloaded with work. It is the power of this collective view of activity that can serve as social motivation to get on with one’s own work and responsibilities [1] and can make visualizations like Figures 3-6 more than just data visualizations; they reflect the social processes at work.
[4] Bellotti, V. and Bly, S. Walking Away from the Desktop Computer: Distributed Collaboration in a Product Design Team. In CSCW96. 1996 ACM Press. [5] Bowers, J. The work to make a network work: Studying CSCW in action. In Conference on Computer Supported Cooperative Work (CSCW). 1994. (Chapel Hill, NC., ACM Press, 287-298. [6] Bradner, E., Kellogg, W. A. and Erickson, T. The adoption and use of 'BABBLE': a field study of chat in the workplace. In Proceedings of the Sixth European Conference on Computer-Supported Cooperative Work. 1999. (Copenhagen, Denmark, Kluwer Academic Publishers, 139-158. [7] Brooks Jr., F. P., The Mythical Man-Month. 20th Anniversary Edition ed. Addison-Wesley, Reading MA, 1995. [8] Brown, A. W. and Booch, G., Collaborative Development Environments, in Advances in Computers, Zelkowitz, M. V., Editor. 2003, Academic Press: San Diego, CA. p. 1-26.
In the final analysis, the change-oriented visualizations in Figures 3 (the Work Item History) and 4-6 (the Social Health Overview) represent more advanced task proxies than that described by Erickson and colleagues [18]. They portray multiple states rather than just a single bit (done/not done), and provide a compact representation of multiple change requests (tasks) rather than just one per visualization. By providing an overview, they reveal individual problematic patterns like ping pong. They can also reveal problems that emerge from seeing the history of many
[9] Carstensen, P. H., Sorensen, C. and Tuikka, T., Let's talk about bugs! Scandanavian Journal of Information Systems, 1995. 7,1 33-54. [10] Cubranic, D. and Murphy, G. C., Hipikat: Recommending Pertinent Software Development Artifacts. IEEE, 2003.
47
Factors in Computing Systems (CHI). 1992. (Monterey, CA., ACM Press, 3-9.
[11] Cubranic, D., Murphy, G.C., Singer, J., Booth, K.S.(Learning from Project History: A Case study for software development. In CSCW. 2004. (Chicago, Ill., ACM.
[26] Knudsen, D. B., Barofsky, A. and Satz, L. R. A Modification Request Control System. In International Conference on Software Engineering (ICSE). 1976. (San Francisco, CA, IEEE Computer Society, 187-192.
[12] deSouza, C., Frohlich, J. and Dourish, P. Seeking the Source: Software Source Code as a Social and Technical Artifact. In GROUP 05. 2005. (Sanibel Island,November 2005) ACM, 197-202.
[27] Leszak, M., Perry, D. E. and Stoll, D. A case study in root cause defect analysis. In International Conference on Software Engineering. 2000. (Limerick, Ireland, ACM Press, 428-437.
[13] deSouza, C., Redmiles, D. and Dourish, P. "Breaking the Code": Moving between private and public work in collaborative software development. In GROUP. 2003. (Sanibel Island, FL., ACM Press, 105-114.
[28] Malone, T. W. and Crowston, K., The Interdisciplinary Study of Coordination. ACM Computing Surveys, 1994. 26,1 (March 1994), p. 87-119.
[14] Donath, J., Karahalios, K. and Biegas, F. Visualizing Conversation. In Thirty Second Hawai'i International Conference on Systems Science. 1999. (Maui, Hawaii, IEEE Computer Society Press.
[29] Mayrhauser, A. v. and Vans, A. M. Program understanding behavior during Debugging of Large Scale Software. In Seventh Workshop on Empirical Studies of Programmers. 1997 ACM Press, 157-179.
[15] Donath, J. and Viegas, F. The chat circles series: Explorations in designing abstract graphical communication interfaces. In Designing Interactive Systems (DIS). 2002 ACM Press.
[30] Mockus, A., Fielding, R. T. and Herbsleb, J. D., Two Case Studies of Open Source Software Development: Apache and Mozilla. ACM Transactions on Software Engineering and Methodology, 2002. 11,3 (July 2002), p. 309-346.
[16] Eick, S. G., Graves, T. L., Karr, A. F., Mockus, A. and Schuster, P., Visualizing Software Changes. Transactions on Software Engineering, 2002. 28,4 396-412.
[31]Olson, G. and Olson, J. S., Distance Matters. Human Computer Interaction, 2000. 15,2/3 139-178.
[17] Elliot, M. S. and Scacchi, W. Free software developers as an occupational community: Resolving conflicts and fostering collaboration. In GROUP '03. 2003. (Sanibel Island, FL,,Nov 2003).
[32] Perry, D. E., Siy, H. P. and Votta, L., Parallel changes in large-scale software development: An observational case study. Transactions on Software Engineering and Methodology (ToSEM), 2001. 10,3 (July, 2001), p. 308-337.
[18] Erickson, T., Huang, W., Danis, C., and Kellogg, W.A. A social proxy for distributed tasks: Design and evaluation of a prototype. Proc. CHI 2004, ACM Press (2004), 559-566.
[33]Perry, D. E., Staudenmayer, N. and Votta, L., People, organizations and Process Improvement. IEEE Software, 1994. 11,4 (July, 1994), p. 36-45.
[19] Grinter, R. E. From Local to Global Coordination: Lessons from Software Reuse. In GROUP 01. 2001. (Boulder, CO,Sept 30-Oct 3) ACM Press, 144-153.
[34] Pinzger, M., Gall, H., Fischer, M. and Lanza, M. Visualizing multiple evolution metrics. In ACM Symposium on Sofware Visualization (SoftVis). 2005. (St. Louis, MO,May 14-15) ACM Press, 67-75.
[20] Gutwin, C., Penner, R. and Schneider, K. Group Awareness in Distributed Software Development. In CSCW 2004. 2004. (Chicago IL,72-81.
[35] Sandusky, R. J. and Gasser, L. Negotiation and the Coordination of Information and Activity in Distributed Software Problem Management. In GROUP 05. 2005. (Sanibel Island FL,Nov 2005).
[21] Halverson, C. A., Erickson, T. and Sussman, J. What counts as sucess? Rhythmic patterns of use in a persistent chat environment. In GROUP 03. 2003. (Sanibel Island, FL.,Nov 2003).
[36] Schmidt, K. and Simone, C., Coordination mechanisms: towards a conceptual foundation of CSCW systems design. Journal of Computer Supported Cooperative Work (JCSCW), 1996. 5,2/3 155-200.
[22] Herbsleb, J. D. and Grinter, R. E. Splitting the organization and integrating the code: Conway's law revisited. In International Conference on Software Engineering (ICSE). 1999. (Los Angeles, CA,May 16-22)85-95.
[37]Smith, M. and Fiore, A. Visualization components for persistent conversation. In Human Factors in Computing Systems (CHI). 2001. (Seattle WA,3/31 - 4/5) ACM Press.
[23] Herbsleb, J. D. and Mockus, A. Formulation and Preliminary Test of an Empirical Theory of Coordination in Software Engineering. In ESEC/FSE. 2003. (Helsinki, Finland, ACM, 138-147.
[38] Storey, M. A., Cubranic, D. and German, D. M. On the use of visualization to support awareness of human activities in software development: A survey and framework. In ACM Symposium on Software Visualization (SoftVis). 2005. (St. Louis, MO., ACM Press, 193-216.
[24] Herbsleb, J. D., Mockus, A., Finholt, T. A. and Grinter, R. E. Distance, dependencies and delay in a global collaboration. In Conference on Computer Supported Cooperative Work (CSCW). 2000. (Philadelphia, PA,December 1-6)319-328. [25] Hill, W. C., Hollan, J. D., Wroblewski, D. and McCandless, T. Edit Wear and Read Wear. In Conference on Human
48