Designing Visual Complexity for Dual-screen Media Timothy Neate1 , Michael Evans2 , Matt Jones1 1 2 FIT Lab, Swansea University, SA2 8PP, UK BBC R&D, Salford, M50 2LH, UK {tdjneate, mattjonez}@gmail.com
[email protected] ABSTRACT
So many people are now using handheld second screens whilst watching TV that application developers and broadcasters are designing companion applications – second screen content that accompanies a TV programme. The nature of such dual-screen use cases inherently causes attention to be split, somewhat unpredictably. Dual-screen complexity, a clear factor in this attention split, is largely unexplored by the literature and will have an unknown (and likely negative) impact on user experience (UX). Therefore, we use empirical techniques to investigate the objective and subjective effect of dual-screen visual complexity on attention distribution in a companion content scenario. Our sequence of studies culminates in the deployment of a companion application prototype that supports adjustment of complexity (by either content curator or viewer) to allow convergence on optimum experience. Our findings assist the effective design of dualscreen content, informing content providers how to manage dual second screen complexity for enhanced UX through a more blended, complementary dual-screen experience. Author Keywords
Attention; second screen; companion content, TV; visual complexity, adaptive UI. ACM Classification Keywords
H.5.m. Information Interfaces and Presentation (e.g. HCI): Miscellaneous INTRODUCTION
For many people, watching TV has become a dual-screen experience, as we find ourselves searching for people we recognise in programmes, looking up sports statistics, or getting involved in TV debates by following hashtags. A 2012 consumer study by Google indicated that 77% of our TV viewing is accompanied by a secondary device, mostly smartphones (49%) and laptops/PCs (34%) [16]. More recent figures (2015), published by Accenture [24] revise this figure up to 87%. TV broadcasters now wish to use this growing enthusiasm for dual-screens to enhance UX. Due to the increase of dual-screen usage, broadcasters develop second screen content that supports such viewing
Copyright is held by the owner/authors (Timothy Neate, Michael Evans, Matt Jones). Publication rights licensed to ACM. Originally published at CHI 2016, San Jose. Original published version available at: DOI: http://dx.doi.org/10.1145/2858036.2858112
habits. These are often termed companion applications and generally run alongside a TV programme on a handheld device, providing complementary information such as relevant facts, quizzes, or related social media content. A fundamental concern of dual-screen UX is the fact that content on a second display can have a distracting effect on the enjoyment of the TV, and vice versa, as reflected in recent literature, for example [6, 7, 23, 28]. In order to make multiple displays truly complementary, we believe that it is essential to understand how to design for the likely patterns of attention distribution between the foci of the two (or more) screens. This work builds on the rich literature discussing the inherent attention based issues in multi-screen media content, to support better design of such experiences in terms of visual attention load. We investigate the general hypothesis that the visual complexity of the companion content is a significant factor in attention distribution, and can be compensated for by a third party (such as a broadcaster), or adapted by the viewer to enhance experience. In a controlled formative study we establish features of TV and companion content that cause attention management issues for participants. We then use these attention-driving characteristics to design an application that supports the adjustment of complexity (either by a content creator, or viewer) to inform dual-screen experience design. Finally, we evaluate these prototypes relative to each other and to a standard, baseline case. This paper contributes to field of dual-screen UX research by: – Establishing a thematic set of observable and codable user behaviours in the presence of varying visual complexity; – Empirical development of relationships between dualscreen visual complexity and subjective and objective response; – Developing a finer detailed understanding in how to optimise experience through curating a level of visual complexity, or allowing each user to do so themselves; – Framing findings to support improvements in the content design process. RELATED WORK
Digital distribution, particularly through the internet, has transformed the UX of traditional broadcast media. Many new experiences are provided on a multitude of platforms, making media multi-device, adaptable and non-linear. TV broadcasters – and similar content providers – are adapting to this changing landscape by supporting user behaviours with additional, supplementary elements. Recent work [11, 34, 37] has studied such multi-device use cases proliferating the
modern living room more formally. They detail great diversity of use – users often browse related, semi-related and nonrelated information on a secondary device (see [25] for a classification). In general, companion applications provide timerelevant facts and information, interactive play-along games, and live social media reaction, which often update at specific points in a programme. Essentially, by doing this TV broadcasters are aiming to supplement the current trends of social networking and information seeking while watching TV into a dual-screen experience, typically for tablet or smartphone. The earliest reference to dual-screen TV in the academic literature is Robertson et al. [33]. This paper describes a secondscreen application developed for PDA (personal digital assistant) to assist prospective buyers choose a house. The key insight from this work was the affordances the dual-screen scenario supports – the combination of the powerful interaction capabilities of a handheld device, in tandem with the superior display properties of a larger screen. The interaction benefits of the handheld device are major factor in their success in use cases, thus early work by Cruikshank et al. [10] explored designing a customisable second screen electronic programme guide. In addition to the numerous commercial examples of companion content (e.g. [2, 3]), much academic literature explores such companion apps in more detail, to support the industry in creating such extended experiences. For example, in [15] Geerts et al., during a deployment of a companion system, looked at the design of applications, the types of content, the social interaction, and the attention associated with such an application. They, and much recent work on dualscreen TV [4, 6, 27], express that close temporal integration between devices is vital for many companion content experiences as the information is pertinent, and therefore directly embellishes the first screen content (in addition to negating possible spoilers). Visual Complexity Metrics
There has been a large amount of previous research studying the visual complexity of web pages, and much of this is highly applicable to companion content: Reinecke et al. [32] investigate first impressions as a function of complexity, and Harper et al. [17] investigated visual complexity in webpages and its impact on cognitive load, finding that the main factors for the perception of high visual complexity were high density and wide diversity of elements. A useful definition of visual complexity for graphics is by Olivia et al. in [30], attributed to Heaps and Handel [18]: “Visual complexity is related to how difficult it will be to give a verbal description of the image and how difficult it will be to remember the scene after seeing it for a short time.” Visual information which requires some further knowledge or processing to interpret, can be considered more visually complex by this definition, for example how children learn to read digital clocks faster than analogue [13]. Michailiduo et al. [26] investigated a method for calculating the perceived complexity of web pages. Constituent features such as links, images, and tables are measured and compared
to a threshold (for example, text > 600 words would be considered ‘visually complex’). We should also consider standardised textual complexity evaluation methods such as the Flesch-Kincaid reading age score [22], which is used by a number of educational, and military corporations to ensure their documentation is of the required standards. Visual Attention for Dual-screen TV
Visual attention, and how it switches between the companion content and the TV, is investigated in the work of Brown et al. [7, 8]. In extension to work by Holmes et al. [19], Brown et al. investigated visual attention by eye tracking participants while they were engaged in a companion content experience. Both studies found that, in a typical use case, visual attention tended to be largely focused on the more motion-rich elements. Further to considering the distribution of visual attention across screens, Neate et al. [29] explored how we can use cues embedded in the stimuli to command viewer attention between the foci. Further, Valuch et al. [38] investigated the effects of cinematic cuts on visual attention – finding that visual attention is quickly attracted by repeated visual content – and recommend that designers of second screen material should include visual items from the ‘primary display’ to reduce the time necessary for the shift of attention between the screens. In [5], Basapur et al. note, in observations from their companion app deployment, that such applications very much support ‘active TV’ – quite cognitively involving, and perhaps something that someone would not use to ‘unwind’. This notion of visual information overload was also observed by Geerts et al. [15] who found that viewers were often overwhelmed with the stimuli, and had to return to it later when the pace of the main programme had slowed down (and, therefore, when the companion material had become less relevant). In addition to considering the visual domain Chorianopoulos et al. [9] consider the interaction costs and benefits of providing varying amounts of interactive UI elements across the TV and a tablet. With regards to complexity across displays on the same physical screen, Kallenbach et al. [21] investigate the effect of extra textual information on TV viewer’s visual attention, message processing ability, and cognitive load. In extension, Van Cauwenberge et al. [39] investigated the effect of participants browsing on their secondary devices while watching TV. Providing layers of detail has been shown to be a potentially effective mitigation of these split-attention issues: studies and prototypes have allowed users to dig for more information through web-links [5], interact with graphics for more detail [12], or expand sections of text for more information [15]. Moreover, some developers introduce relevant content at specific points to reduce distraction from the experience [5, 7, 15]. Brown et al. go further [7], and discuss how content may be generated based off a user-driven attention mode, as has been demonstrated in Web interfaces [20]. Though work has investigated visual attention in terms of its distribution across dual-screens, no work currently empirically investigates the subjective or objective impact of the attention split this use case creates. Moreover, no work considers a design space for bettering its creation in terms of visual
complexity across the foci empirically. Therefore, in this paper we investigate visual complexity over dual-screens and use our findings to further consider complexity adjustment towards enhanced dual-screen UX. STUDY 1: EVALUATING DUAL-SCREEN COMPLEXITY
A controlled lab-based study was conducted to determine factors which contributed to viewers’ overall perception of visual complexity on a main and companion screen, and their interaction to form dual-screen complexity. Attention distribution, measured in terms of glances to the handheld device, was also observed as a means to determine potential mechanisms for designing attention between the two elements of the experience. Twenty participants watched four professionally produced and previously broadcast programme clips on a TV screen, accompanied by second screen content, ranging from simple to complex in terms of its complexity. We then evaluated their subjective experience using quantitive and qualitative measures. Guided by the previous literature, representative styles of companion content were used, each consisting of supplementary textual information and graphics. Participants and Study Environment
The participants (labelled P1 through P20) were aged between 22 and 65, with a mean of 39.4 (SD = 13.04). Eleven identified as female, and nine male. They reported viewing an average of 2 hours and 5 minutes of TV per day, and 80% of participants reported that they engaged with portable devices while watching TV to some extent, most commonly to search for information related to the programme or for social networking. Of these participants, half were recruited through an agency, and half were recruited from the BBC (from departments unrelated to this research). All participants were native English speakers. This was a controlled investigation in a user research lab configured as a typical living room. This lab has been used for several years by a major TV broadcaster for similar studies, and ensures as minimum distraction and rich observation of the stimuli effects. The lab’s camera equipment was used to view and record the participants and their interactions in situ (Figure 1).
1
2
3
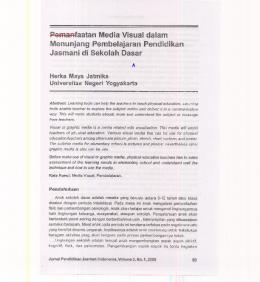
Figure 1. Video observation was captured from three angles: 1) directly in front of the participant, to observe reactions such as gaze; 2) from above, to observe the device status and reactions from a second perspective; and 3) to view the TV screen to maintain a comprehensive record of the content experience.
Study Procedure
Each participant completed a demographic questionnaire to allow us to understand our sample population. A sequence of four TV clips (see Figure 1), each accompanied by companion content were then presented, one after another. We chose a variety of content to mitigate for genre effects [14]. Participants were told that they would be asked recall-based questions about both screens’ material. This was to provide mild motivation to attend to both screens. At the end of the sequence, the participants filled out a post-study questionnaire, and an investigator conducted a semi-structured interview discussing the participant’s experience of the different complexity levels. Stimuli and Tablet Content Design
The TV content (Table 1) was chosen to be diverse as possible so that we could compare/control the impact of each genre/style of programming. Clip No.
TV Programme
Summary
1 2 3 4
The Inca: Masters of the Clouds Snooker Coverage: Master’s 1/4 Final Click (broadcast 5/7/14) Eggheads: Season 15, Episode 18
Inca documentary Snooker 1/4 final Technology news item Quiz programme
Table 1. Table of clips used in the visual complexity experiment.
Companion content was displayed at four points, at a diverse set of scenes in the TV clips – some with high levels of dialogue on the TV, others with little; others at points that would require high visual focus on the large screen to understand, in contrast to other visually slower points in the programme, with slower paced editing and more repetitive shots. The tablet material was non-interactive graphical companion content, with no audio, which depicted information related to the programme – for example, facts, related images, and tangential news stories. The companion screens (Figure 2) were created in four levels of complexity: simple text, simple graphics (‘tg’), complex text, simple graphics (‘Tg’), complex graphics, simple text (‘tG’) and complex text, complex graphics (‘TG’). In creating different levels of textual and graphical complexities we used standard measures and prior literature to guide our choices. For textual information we used descriptors to consider complexity – the aforementioned Flesch reading ease score method, and the length of the textual information. For this we defined two levels of complexity: LOW (a score above 60), which implies the reading age of an average 13 to 15 year old; and HIGH (a score below 50), which implies more advanced reading skills. With regards to length, we used < 15 words for the LOW condition and > 25 for the HIGH condition. We used Heap and Handel’s (aforementioned) definition of graphical complexity [18]. We therefore defined informationrich with complex semantic information, such as graphs and maps, as complex. And non-semantically rich images, such as a picture of an animal, as simple. We used Latin square treatment to balance for the visual complexity levels fairly
(a) ‘tg’ complexity
(b) ‘Tg’ complexity
(c) ‘tG’ complexity
(d) ‘TG’ complexity
Figure 2. The graphical second screen complexity levels used in the experiment, for the Inca documentary clip (Clip 1). We use lower-case to denote a simple condition, and a capital to denote complex: (a) depicts ‘tg’ – simple text, simple graphics; (b) depicts ‘Tg’ – complex text, simple graphics; (c) depicts ‘tG’ – simple text, complex graphics; and (d) depicts ‘TG’ – complex text, complex graphics.
across all four clips, so that there was an equal number of independent variables (complexity levels) across the TV stimuli. Our content’s textual and graphical complexity was designed to be in line with current informational applications used by major broadcasters, for example those in the BBC Companion Archive [1].
were general significant effects for conditions, and then conducted post-hoc pairwise comparisons. For ranked data we used Friedman tests to investigate the overall effects of conditions, and then used post-hoc Wilcoxon signed rank tests to evaluate individual differences. In post-hoc analysis we used Bonferroni-Holm correction to protect against type I error from multiple comparisons, and set α = 0.05.
Measures and Validation Techniques
For objective data we considered gaze. To determine and record the participant’s eye gaze information we used the video analysis software ELAN [36]. In a similar method to Neate et al. [29], we utilised the multiple angle HD video and were able to determine observational data, which was timecoded with frame-by-frame accuracy. Specifically, we were interested in tablet engagement time – how long a specific piece of tablet content caught their attention away from the TV, calculated by the total duration of glances per piece of second screen content. From this we could also determine the average length of gaze, to determine how long each point of visual engagement with the content lasts, and how often the participants looked up and down.
Results Visual Data
Concerning video analysis tablet engagement time, as shown in the results in Figure 3 that, on average, ‘TG’ yielded the longest level of engagement with the second screen: 17.8 seconds (59.3% of the time the content was displayed), and ‘tg’ yielded the least with an average of 10.6 seconds of time engaged, or 35.3% of the time the content was displayed.
After each clip we administered a Likert scale questionnaire to gather the participants’ impressions. Specifically we asked questions related to how hard they felt it was to take in content on the second screen, whether they were missing content on the TV because of the tablet (and vice versa), and how hard it was for them to take in textual/pictorial information. After watching all clips we asked questions related to the experiment as a whole, specifically asking them to reflect on how the detail levels in the companion content affected their overall experience.
Figure 3. Length of time, in seconds, that the participants were engaging with the content for the respective complexity types.
We concluded the experiment with a semi-structured interview. For this we asked the same core questions, but the nature of the interview allowed us to probe deeper into specific comments made by the participants. Our main interview questions probed whether they adapted their TV viewing if there was more textual or pictorial information on the second screen; at what points they sacrificed viewing content on the TV, and the tablet; and how much the companion content’s relevance to the balancing of both screens. We transcribed the data and conducted thematic analysis to probe key trends. With regards to the analysis of the continuous data, we used ANOVA (analysis of variance) to determine if there
ANOVA indicated that the complexity level had a significant effect on the participants’ time engaged with the content (F(3, 17) = 14.032, p < 0.001), and post-hoc pairwise comparisons indicated there were significant differences between the complexity levels. By comparing ‘tg’ and ‘Tg’ we saw that complex text had a significant effect on engagement (p = 0.001), and by comparing ‘tg’ and ‘tG’ we also can see that graphical information had a significant effect (p = 0.015). Moreover, combined complexity of graphics and textual information also had a significant effect on engagement (p = 0.001).
Median Statement 1 – I found it challenging to take in the content on the TV 2 – I found it challenging to take in the content on the tablet 3 – I felt like I was missing material on the TV 4 – I felt like I was missing material on the tablet 5 – I could easily take in the picture based material 6 – I felt I could easily take in the textual content 7 – Rate, out of 10, the level of complexity on the tablet
‘tg’
‘Tg’
‘tG’
‘TG’
χ2
p
3.0 2.5 3.0 2.5 4.0 4.0 4.0
3.0 4.0 3.0 4.0 4.0 2.0 7.0
3.0 3.5 3.0 3.0 3.0 3.0 7.0
4.0 4.0 4.0 4.0 3.0 2.0 8.0
3.78 7.93 3.86 16.44 9.19 10.72 24.35
0.290 0.047* 0.277 0.001* 0.025* 0.011* 0.000*
The average duration of a glance to the second screen for the participants was 4.6s for ‘tg’, 7.1s for ‘Tg’, 6s for ‘tG’ and 8.4s for ‘TG’ – textually complex pieces of content yielded the lengthiest gazes. Further, there was a much larger spread in the length of glances for textual information, for example standard deviations for ‘tg’ (SD = 2.46) and ‘tG’ (SD = 2.50) were much lower than the glances for the more textually complex cases – for ‘Tg’ SD = 4.67 and for ‘TG’ (SD = 4.39). There was a significant effect for visual complexity on average gaze length (F(3, 17) = 5.186, p = 0.010) and post-hoc analysis showed a statistically significant difference (p = 0.013) between complexity conditions ‘tg’ and ‘TG’. However, we found no significant differences for complexity when considering glance frequency. Upon conducting a two-way ANOVA to assess if there was an interaction effect for textual and graphical complexity with regards to time engaged with the content, we saw no significant interaction effect, implying that the complexity types to not affect each other. Experimental Questionnaires
Now turning to the post-clip impression questionnaires, as summarised in Table 2. There was a significant overall effect for Statement 2, the extent to which participants found it challenging to take in content on the tablet. Post-hoc analysis indicates that complex text and graphics (‘TG’) was ranked significantly higher than simple text and graphics (‘tg’) (Z = 2.665, p = 0.032). When we consider how much the participants believed they felt they were missing material on the tablet (Statement 4) there was a significant overall effect for complexity. In the post-hoc analysis, ‘TG’ was significantly more impacting than ‘tg’ (Z = 3.27, p = 0.004) and ‘tG’ (Z = 2.56, p = 0.036), and that ‘Tg’ was rated significantly higher than ‘tg’ (Z = 2.48, p = 0.026). For picture based materials (Statement 5) there was a significant overall effect, however, upon conducting post-hoc analysis significant pairwise differences between the conditions were not found. Analysis of the participants’ responses to taking in the textual content (Statement 6) showed a significant overall effect, as shown in Table 2. Post-hoc analysis indicated that ‘Tg’ that was rated significantly lower than ‘tg’ in terms of textual comprehension (Z = 3.31, p = 0.004), this was also the case for ‘TG’ (Z = 2.642, p = 0.024).When asked to rate their perceived complexity on the tablet out of ten (Statement 7). There were significant differences between the conditions. Post-hoc analysis indicates that there were significant differences between ‘TG’ and ‘tg’ (Z = 3.53, p < 0.001), between
Table 2. This table shows the statements the participants were asked to consider after each clip. They ranked all statements on a 5 point Likert scale (Strongly Disagree (1) up to Strongly Agree (5)). Groups with statistically significant inter-condition effects are denoted with an asterix, therefore we can see that there was no significant effect found for Statements 1 and 3.
‘Tg and ‘tg’ (Z = 3.49, p < 0.001), and between ‘tG’ and ‘tg’ (Z = 2.37, p = 0.018). The post-study questionnaire suggested, in general, that the participants found less detail (median rating of 3) better than more detail (median rating of 4). And they generally agreed that it was hard to take in the both screens at once – (median rating of 2 (disagree)) to the statement ‘I found it easy to take in the both screens at once”. Post-study Interview
When questioned about what the more detailed content did to their viewing habits across both screens, the most common response was that they prioritised the TV (8 participants). That is to say, sometimes they ignored the more complicated companion content to engage with the TV. Generally, they noted this was because they were engaged with interesting things happening on the TV. For example, a tension point in Clip 4 –“I found myself missing material because of the tensions in knowing if the person was going to get it [...] it was a visual thing, rather than just listening to see if they were going to get it right” (P13), or when the presenter of C LIP 1 was giving a detailed lecture. The user comments indicated that detailed textual information was a major issue to take in at points. A common trend for users was monitoring the TV with their auditory channel and looking up when it piqued their interest. However, it was clear that engaging with the extensive textual information stunted this considerably. During the experiment, 12 participants noted that they had trouble taking in the textual information while engaging with the TV –“There was too much text and I wouldn’t take it on if I was reading it, so I would rather watch the television” (P4). In addition, it was clear that the in portions of a clip that contained more verbose passages from the programme’s presenter, combined with in-depth textual information on the companion device resulted in considerable problems for the participants “It was very hard for me to read [...] while there is a TV narrative going on” (P8). To a lesser extent, more detailed pictorial information was perceived as an issue. Three participants noted that they found it hard to take in some of the map and graph-based information. An interesting viewing behaviour was that half of the participants (10) appeared to be viewing the content on the tablet by anticipating logical gaps, or ‘cues’ in the TV content. It was clear that they associated certain points in the programme with cues to look at the companion device – points of low inactivity (a player mulling his shot in snooker), large panoramic shots, and repeated parts (such as replays), for
example –“So there were periods on the first one [C LIP 1], where the guy was talking but he was walking across a field so it did not require my visual attention. So I could look at the tablet and still listen to it” (P6). Conversely, they associated other sections with points where they should look away from the tablet and focus on the TV. These were generally tension points, for example, a question being asked in a quiz programme, excitement in the commentator’s voice, or even points with unexplained silences – “...with the snooker the audience would gasp, or when I could hear commentators go quiet I could tell something was about to happen” (P20). Moreover, it was clear that those with knowledge or experience of a programme were more likely to anticipate these gaps better, and respond to second screen content accordingly. For example, one participant – a keen fan of snooker – was able to anticipate when certain snooker players were likely to take their shots, and adapted their viewing accordingly –“Ronnie O’Sullivan is quick with his shots and you know that you’re going to miss it if you are not attending” (P13). Discussion
Our objective and subjective evidence indicates that textual information has a major impact on the dual-screen experience. We suggest that this is because graphical information can easily give us a gist, whereas to gain information from text we must systematically read this line by line. This is supported by the fact that the average gaze length of the participants was significantly longer for the more textually complex information, and not for the graphical. We also saw larger variations between the length of gazes for the textual content compared to the graphical. A potential explanation is offered by the psychology literature – people are poor at reading text and taking in auditory information concurrently [35]. Therefore, our participants would have had to focus considerably more on the text and ‘block out’ the TV in the background, due to the burden on cognitive load. Our findings support the objective findings of Kallenbach et al. [21], in which participants felt more stress while watching TV and reading text (their study, in contrast to ours, displayed the text on the same screen as the programme). In the worst case scenarios, with complicated streams of auditory information on the TV, and complex tablet textual information, the participants mostly switched to the TV – the more prominent, motion rich display, with an additional auditory element, as in Brown et al.’s work [7]. In general our gaze durations were in line with other studies [7, 19], but slightly higher – likely related to each piece of content’s lower presentation time. Though textual information was clearly a major factor, the perceived complexity of the content was also heavily affected by the visual and auditory interaction of the larger TV content stream. This was driven by several, more nuanced, factors. Interestingly, these were also sometimes driven by some kind of prior knowledge, such as knowing how good a snooker player is. What this may suggest is that a familiarity with certain TV content means that we can learn to manage our attention resources to accommodate second screen activity. For example, in more repetitive programming, with a limited
set of visual events, this may allow a user to better monitor the audio feed from the TV to get a subconscious gist of the visual content. We also noted two main user perceptions of content that is unrelated to that of the main TV programme. In general they supported Valuch et al.’s [38] proposal of commonalities between displays making it easier for users to switch between them. However, in addition, we found that our participants belonged to two main categories: unexpectedly, those who felt it was easier to take in the content because it was unrelated, and therefore they could compartmentalise one piece of content and fully engage with another; and those who found it distracting to deal with two very disparate pieces of information. Indeed, this may be an explanation for the findings of Van Cauwenberge et al. [39], who noted no significant effect for the relatedness between screens when dual-screening. Though the TV display’s complexity is highly nuanced and subjective, some common themes came from our research that suggested the participants would find it challenging to view second screen content during these points. The main themes were: intense dialogue; 5 out of 20 participants noted that they found the points where intense dialogue was occurring to require excessive cognitive processing; novel occurrences, 6 out of 20 participants noted that when something totally new happens on the screen, for example a scene switch, they found it hard to take in the companion content; and also semantically vital visual information (8 out of 20 participants) – for example when someone draws something in a description and we cannot infer what it is from the auditory channel. COMPENSATING FOR DUAL-SCREEN COMPLEXITY
In this section we reflect on the previous study and consider how we may devise interventions to compensate for dualscreen complexity. In Study 1 it was evident that complexity on the primary screen is largely driven by textual content, and therefore we will focus on this for our interventions. Moreover, there is also a considerable interaction between the TV programme and the tablet content. However to compensate for complexity on the TV display we first need to consider what the viewers found complex, and consider methods to compensate for this. Characteristics of Complex TV Content
As discussed, in the semi-structured interview data we found three main themes independently rise from our open questions, for what the participants found complex. Therefore we will use the following characteristics as a starting point for considering how we may begin to design for dual-screen complexity: – Intense dialogue – intense speech with complex descriptions, or multiple people talking simultaneously; – Novelty – when a novel event happens, or a there is a new scene; – Semantically vital visual information – essential visual information on the TV that we cannot infer from the auditory channel.
Tablet Complexity:
T2
03:50
04:00
T3
04:10
04:20
T4
04:30
04:40
Complexity Level
TV Complexity:
T1
03:40
c)
b) T5
04:50
05:00
Time (mm:ss)
05:10
3 2 1 03:40
03:50
04:00
T1
04:10
T2
04:20
04:30
T3
04:40
Time (mm:ss)
04:50
05:00
05:10
T4
T5
05:20
Complexity Level
a)
3 2 1 03:40
03:50
T1
04:00
04:10
T2
04:20
04:30
T3
04:40
Time (mm:ss)
04:50
05:00
05:10
05:20
T5
T4
Figure 4. Content curation process: a) video content is broken down into 20 second time slices; b) complexity of TV content is determined, for example by our TV complexity characteristics; c) complexity of tablet content is determined by inverting the TV complexity value to compensate for the complexity across the foci. For example simple TV (complexity level 1) means tablet complexity would be adjusted to complexity level 3.
Complexity Curation
Now that we have developed an impression of the characteristics of complex TV content, we can begin to consider methods by which application designers and broadcasters may compensate for primary screen complexity by developing companion applications with these in mind. Indeed, a reasonable solution to this issue may be to not introduce visually complex second screen information during complex points in a TV programme. However, this is quite restrictive, and means we cannot provide the time-relevant second screen content that the literature suggests is salient. Therefore to compensate for dual-screen visual complexity we propose that content can be curated – rendering the content more visually simplistic on the handheld device simpler when more complex content is on the TV, and more complex when simpler content is on the TV (as in Figure 4). When new content is loaded by the user, the view’s complexity can update based on the characteristics of the TV content. For our complexity curation method we divide the content into time segments, for example here we have chosen 20 seconds. Then for each of these segments we consider the TV complexity characteristics. If the content contains none or few of the characteristics of complex TV content, then we consider it the lowest level (1), and if it contains all of them we rank it the highest level (3). If the segment contains a mixture, we consider this a medium (2) complexity.
Complexity Adaptation by Users
To compensate for complexity, another feasible option is to load the material in a default level of complexity, and allow the user to adapt the content themselves, for example with a ‘more/less’ info button, which increases the information in a given text region. This is similar to work discussed [15]. Therefore, if a user wants to find out extra information, they can expand the text. We also propose, to see if users compensate for visual overload themselves, they could turn the textual complexity down, creating a more concise version, as shown in Figure 5.
STUDY 2: SECOND SCREEN ADJUSTMENT STUDY
In this study we explore the impact of complexity curation UI, and user-adaptable UI, compared to a baseline context unaware case. We do so with an aim to determine if complexity curation is a useful starting point to balance for complexity
a)
+b)
+c)
+-
Figure 5. UI adaptation: the user can alter the complexity and amount of information in a text element. The arrows correlate to the actions possible by the user, for example in b) it is possible to increase, or decrease complexity, and in a) the user can only increase from the simplest state.
across dual-screens; to further validate our complexity characteristics; and to examine the relative user experiences of both of the adjustment methods. Procedure
As with the previous study, we conducted this experiment in a TV usability lab and were able to capture video of the participants from multiple angles in a mock living room. First we briefed the participants. We informed them that there were three conditions, which we explained in simple terms, and ensured they understood. Not to bias the experiment, we did not tell them the order of the conditions. After gathering participant demographics, the participants then watched the three clips, with a piece of companion content on a second screen (iPad). Ordering effect for the variables was counterbalanced by a Latin square design – over all participants each clip was used with the same number of independent variables (complexity levels). After each clip, we administered a short questionnaire to evaluate their experience. After all clips had been watched, we administered a post-study questionnaire to evaluate the participants’ experience as whole. After this, we concluded with a brief semi-structured interview. Stimuli and Tablet Content Design
The participants were presented with a navigable application, in which they could view content related to the TV programme. This refreshed with new information at 4 points in the programme. This was indicated by a simple auditory notification and a new piece of content appearing in the navigation bar. Participants were free to return to previously visited content, which would render differently based on the condition active. The participants were motivated to engage with the material on the tablet through a quiz in which they were asked three questions on the companion application about the
content on the tablet and/or the TV programme. As in the previous experiment we chose the stimuli to represent a diverse set of complexities, but now informed by our additional findings as to what constitutes complex TV material. Each clip was approximately 7 minutes and taken from a large TV broadcast archive. The clips used can be viewed in Table 3. We chose CLIP 1 as it fulfilled the requirements for both complex, and simplistic TV content, with both intense dialogue and often scarce imagery. We chose CLIP 2 as it fulfilled requirements for complex content, as it is full of tension points and intense dialogue. And finally, we chose CLIP 3 as it fulfilled the characteristics of simple TV content, with relatively little complex dialogue. Clip No.
TV Programme
Summary
1 2 3
Africa: Sahara The Weakest Link James Martin’s Home Comforts
Natural history documentary Quick-fire quiz programme Cooking programme
Table 3. Table of clips used in the complexity adjustment experiment.
To consider how we may accommodate for complexity, we defined three second screen visual complexity levels: SIM PLE , in which we used a reading score of 70 (Flesch-Kincaid) and a word count of 40; MEDIUM, in which we used a reading score of 55 and a word count of 55; and COMPLEX, in which we used a reading score of 50 and a word count of 70. As with Study 1 this is typical of supplemental informationbased companion apps. The independent variable in this experiment was how we controlled for this complexity. We looked into two methods (adaptable and curated), compared to a baseline, to uncover the implications of each: – C ONTEXT UNAWARE (Condition 1) – second screen material that updates without any consideration for first screen complexity – it is randomly generated across three levels of complexity – SIMPLE, MEDIUM and COMPLEX. This is done each time a new view is loaded by the participant while browsing the application. – C URATED (Condition 2) – second screen content that is curated to TV content. We curated this in accordance with our complexity curation methods discussed in the previous section. The content was rendered to a new condition each time the participant opened a new view. Each level of complexity was used the same number of times for curation across the clips to ensure a fair comparison to Condition 1. – ADAPTABLE (Condition 3) – content that the users can make more or less complex by interacting with the interface. The content loaded in MEDIUM complexity, and then the participants could adapt it, as discussed in the previous section and in Figure 5. Participants
With regards to the participants, we recruited from both a local university, and from within departments of the BBC, which were not related to this research. 14 of our participants identified as male, and 10 female, making for a total of 24 participants. With regards to age, the youngest participant was 21, and the oldest 52, with a mean age of 32.3
(SD = 9.75). With regards to their TV/technology experience, 19 participants (79%) reported engaging with their devices while watching TV. On average, the participants watched around 2 and a half hours of media, and (38%) had engaged with some form of companion application (such as Zeebox, or ‘The Voice’ Companion apps). All bar one of the participants were native English speakers. Measures and Validation Techniques
For the post-clip Likert questions, we asked questions related to how the detail on the tablet affected their dual-screen experience. We were specifically looking to investigate the three conditions in terms of their advantages and/or disadvantages for dual-screen UX, the baseline (CONTEXT UNAWARE) acting as a reference to compare to. We looked at whether the adjustment type had an effect on the participants’ ability to take in either the TV, the tablet, or both screens better than the baseline. We logged interaction data for when the participants navigated between new views, at what complexity level the views loaded up, what condition they were assigned, and how much they adapted the content themselves (up or down). To conclude the experiment we conducted a brief semi-structured interview with two main questions: one that probed if they had noticed the content on the tablet adjust to the complexity of the TV for any of the conditions; and another in which we asked how they felt about interacting with the buttons to adapt the complexity on the tablet. With regards to statistical validation we used the same techniques as stated in Study 1. Results Questionnaire Data
Concerning inter-condition effects, post-clip Likert scale results (Table 4) indicate that the results of Question 3 suggest that there was a significant difference between the conditions for the participants taking in information on both screens simultaneously. Post-hoc analysis determined that they agreed that Condition 2 (CURATED) allowed them to take in both visual streams significantly better than the CONTEXT UN AWARE case (Z = 2.07, p = 0.038), and also ADAPTABLE (Z = 2.72, p = 0.009) technique. However, there was no significant difference between the CONTEXT UNAWARE and the ADAPTABLE condition. Turning now to the post-study Likert scale data – it was evident that there was a significant effect for condition on the amount that the participants felt that the “detail of the tablet content enhanced the experience as a whole” (χ2 = 7.59, p = 0.021). Post-hoc analysis suggested that participants rated Conditon 2 (CURATED) significantly higher than CONTEXT UNAWARE (Z = 2.28, p = 0.039). However we found no significant difference between CURATED and ADAPTABLE and a non-significant difference between CU RATED and ADAPTABLE (Z = 1.852, p = 0.062). With regards to the demographics data, we found a significant correlation between those participants who stated they were easily distracted by content on their devices and those who enjoyed the curated case (Spearman’s ρ = 0.40, p = 0.027).
Table 4. Participants were asked to state their agreement after each clip. All questions were ranked on a 5 point Likert scale. Groups with statistically significant inter-condition differences are denoted with an asterix, therefore we can see there was a significant effect for Statement 3.
Median Statement 1 – The tablet detail allowed me to take in tablet content 2 – The tablet detail allowed me to take in TV content 3 – The tablet detail allowed me to pay attention to both displays
C1
C2
C3
χ2
p
4.0 3.0 3.0
5.0 4.0 3.5
4.0 2.5 2.0
4.48 4.33 9.72
0.11 0.12 0.08*
Interaction Data
In all we logged a total of 216 complexity adjustments (in the adaptable case) across all clips. In general C LIP 2 yielded the most adjustment, with a total of 92 (3.8 adjustments per clip), followed by C LIP 1 at 64 (2.7 adjustments per clip) and lastly C LIP 3 at 60 (2.5 adjustments per clip). In both C LIP 1 and C LIP 2 turning the complexity up was more common than down – C LIP 1 saw 21.9% more complexity increase than decrease, and C LIP 2 19.6% more. However, with C LIP 3 the participants decreased the complexity marginally (6.7%) more than increased – summarised in Figure 6.
Clip 1 Sahara
No Interaction
Clip 2
Minus First
Weakest Link
Plus First
Clip 3 Home Comforts 0
10
20
30
40
50
60
Type of first interaction (%)
Figure 7. Frequency of participants’ first adjustment choice.
Clip 1 Sahara
Total adjustment
Clip 2
Complexity decrease
Weakest Link
Complexity increase
Clip 3 Home Comforts 0
20
40
60
80
Adjustment type (total frequency)
100
Figure 6. Frequency of participants’ total complexity adjustment.
From the data logged on the device it was clear that different clips resulted in different uses of the adaptable case. Upon being presented with a new view, we observed what the participants did first – whether they increased the complexity, turned it down, or did not interact. In C LIP 1 the most common response was for them to increase the complexity (52.0% of the time), and a similar pattern in C LIP 2 (51.6% of the time). However, in C LIP 3 this changed (see Figure 7), as the most common response was no interaction (42.8%), and both turning up/down the complexity constituted for only 28.6% of the reaction. Now turning to the reaction to the complexity of the TV content – as shown by the total of complexity increases, and the number of net increases in Table 5, when the TV content was of LOW complexity the participants increased the tablet content complexity when loading a new view. Moreover, they were also more likely to interact in general. However, when the content was of HIGH complexity on the TV, they were no more likely to turn the complexity down than when presented with the M EDIUM case. Post-study Interview
The results of the interviews indicated that most of the participants did not notice the content being curated. One third (8/24) noted that they felt that the content was in some way changing depending on the TV content. Of these 8, 7 of these participants, unprompted, said which of the trials they felt had been adapted, with 5 people making a correct choice.
With regards to preferences between the methods for manipulating the content, there was a fair amount of variety. When quizzed about interacting with the UI to adapt the complexity 11 responded positively, 7 negatively, and 5 were indifferent or did not use the function enough to say. In general, the positive responses were due to two main factors: 6 participants noted they liked the ability to ease off the complexity to counter complex events happening on the TV, and 5 noted that they liked the ability to actively select a higher complexity level. However, 8 participants noted that the cost of interaction with the adaptive UI was detracting from the experience, for example P7’s comment – “If it’s curated and you don’t have that control you’ve got a snippet of information; it’s not a distraction”. The participants were not vastly overloaded by the content in C LIP 2. With regards to the TV material – comments mentioned the repetitive nature of a quiz programme – “...in the Weakest Link [C LIP 2], there’s an obvious pattern – she asks the questions” (P1). Interaction
LOW
MEDIUM
HIGH
Total
Up Total Down Total Net
16 5 11
9 6 3
10 7 3
35 18 17
Table 5. Frequency of first interaction when presented with a new view. The LOW, MEDIUM and HIGH cases refer to the complexity on the TV
Discussion
The Likert scale data suggests that the curated case allowed the participants to take in the dual-screen experience by adjusting the tablet’s textual complexity in accordance with our characteristics of TV complexity. Moreover, the adaptation data indicated that the participants were more likely to increase the complexity when fewer of the characteristics of complex TV content were presented. This tells us to some extent that the method, though a relatively simplistic set of rules, works as a good rule of thumb for considering dualscreen complexity generically.
From analysis of the interview data it was clear that, though in general the curated case was preferred, a relatively small proportion actually noticed the adaptation, likely due to its subtle nature. Several participants’ comments noted that the curated content allowed for a more automated experience. This in turn afforded a less engaged, more ‘sit-back’ approach (discussed by Brown et al. [7]) to second screen viewing, which many participants reported positively. Such design choices may be made by those who wish to make ‘less active’ content for users to unwind to, as discussed in [6]. Interestingly, a significant, and moderately powerful correlation was found between those who got easily distracted by their devices and those who enjoyed the curated case. A potential explanation for this is that those who find it harder to manage their attention resources over the foci found the curated case helped them compensate for this. The adaptable case often scored poorly as a method for adjusting complexity, even compared to a context unaware baseline due to its perceived interaction cost. However, from analysis of the user comments and the interaction data we can see a more complex picture emerged. Quite a number of participants preferred the adaptable condition as it allowed them to be more inquisitive and proactive in the experience at points where little was happening on the TV, and to tone down the complexity when the TV content was taking most of their attention. With regards to TV genre differences, the data from the interviews and the log data contradicted our expectations with regards to how much the participants would interact with the adaptable case to adapt the complexity. The data indicated that the participants, for C LIP 2, likely due to the visually repetitive nature of the programme, interacted more with the device. And the log data suggests that for C LIP 3 they wished to take a less hands on approach to adapting the complexity, and for simply to sit back, or even turn down down the complexity.
programme, for example by an independent application developer, to control the distribution of attention between the screens in key moments. We found that the curation afforded a better dual-screen experience in terms of taking in the content across two screens, and supported more passive ‘sit back’ viewing. Also, that the adaptable case allowed for the encompassment of more viewing styles, but at an interaction cost to the participants. The guidelines we have provided in this paper for curating content between the screens act as a proof of concept that content complexity can be curated with positive results. However, we note that our findings may not be fully generalizable to all use cases, and that they are most applicable to the design of information-based companion apps (which include many contemporary apps). Moreover, the study was held in a lab with set stimuli and was therefore not subject to varying environmental factors. In addition, we only consider visual and auditory stimuli, and do not touch on more nuanced concepts such as engagement [31]. However, we believe our findings are still cautionary for those developing more interactive UIs. And that complex models of what constitutes dual-screen complexity need to be formed to inform optimum dual-screen UX. Practically, designers may consider trailing content before public distribution and probe points in which UI is hindered by dual-screen visual overload, or drive these by user models from data physiological data such as gaze [20]. Further work should investigate if the concepts in this work can be applied beyond augmenting information in TV programmes. In the context of second screen apps for social media, this could mean delaying attention-impacting information on a handheld device to a point of less primary screen involvement, which could be determined by detectable factors such as the frequency of social media updates, or as a result of analytical data derivable from on-screen text, graphics, motion, audio or user interaction behaviour. For example, allowing only the most highly ranked social media items to envelop the user’s attention during a live debate.
DESIGN CONSIDERATIONS AND FURTHER WORK
In general our findings suggest that we need to actively consider the complexity of information on second screens when providing complementary material to primary media. Moreover, before designing content, we should examine the potential effects of the complex interaction between the two displays, across the auditory and visual domain. Our results suggest that viable solutions are to, in the simplest case, not introduce content at points of high TV complexity. Or, as our study indicates, curate the content on the handheld device to adapt to the complexity on the tablet. Or indeed, to provide user-adaptability to the UI. Further, a mixture of the approaches could be adopted in which the content is curated to some degree and then additional adjustments can be made to support the viewer in their individual preferences.
CONCLUSIONS
Such curation can be implemented by a broadcaster, as part of the creative process when developing a tablet experience in tandem with a programme, or as a design lever to optimise viewers’ distribution of attention between the two screens. Further, it could be done after the production of the
We would like to thank our participants for their involvement in our research, and the anonymous reviewers for helping us improve this paper with their comments. Timothy Neate is funded by an EPSRC DTA scholarship (EP/L504865/1) and the BBC UXRP.
We have detailed extensive empirical findings regarding dualscreen complexity from an objective and subjective perspective. These insights have allowed us to develop and evaluate potential solutions to the issues encountered in creating and experiencing this important domain of media content. We are confident that these results will strongly support the work of designers in developing enhanced UX across multiple screens. Fundamentally, enriching our understanding of users in this domain is crucial in compensating for the disjunct in visual attention that multiple screen experiences produce. ACKNOWLEDGEMENTS
REFERENCES
1. Companion Principals: Examples. Online: http://companion.prototype0.net/examples.
(2014).
Accessed: 14/09/15. 2. BBC Gory Games App. Online: http://www.bbc.co. uk/cbbc/findoutmore/hh-gory-games-app-faq. (2015). Accessed: 14/09/15. 3. Heroes Reborn Companion App. http://www.nbc.com/heroes-reborn/app.
(2015).
Accessed: 14/09/15. 4. Edward Anstead, Steve Benford, and Robert J. Houghton. 2014. Many-screen Viewing: Evaluating an Olympics Companion Application. In Proceedings of the 2014 ACM International Conference on Interactive Experiences for TV and Online Video (TVX ’14). ACM, New York, NY, USA, 103–110. DOI: http://dx.doi.org/10.1145/2602299.2602304
5. Santosh Basapur, Gunnar Harboe, Hiren Mandalia, Ashley Novak, Van Vuong, and Crysta Metcalf. 2011. Field Trial of a Dual Device User Experience for iTV. In Proceddings of the 9th International Interactive Conference on Interactive Television (EuroITV ’11). ACM, New York, NY, USA, 127–136. DOI: http://dx.doi.org/10.1145/2000119.2000145
6. Santosh Basapur, Hiren Mandalia, Shirley Chaysinh, Young Lee, Narayanan Venkitaraman, and Crysta Metcalf. 2012. FANFEEDS: Evaluation of Socially Generated Information Feed on Second Screen As a TV Show Companion. In Proceedings of the 10th European Conference on Interactive Tv and Video (EuroiTV ’12). ACM, New York, NY, USA, 87–96. DOI: http://dx.doi.org/10.1145/2325616.2325636
7. Andy Brown, Michael Evans, Caroline Jay, Maxine Glancy, Rhianne Jones, and Simon Harper. 2014a. HCI over Multiple Screens. In CHI ’14 Extended Abstracts on Human Factors in Computing Systems (CHI EA ’14). ACM, New York, NY, USA, 665–674. DOI: http://dx.doi.org/10.1145/2559206.2578869
8. Andy Brown, Caroline Jay, and Simon Harper. 2014b. Eye-tracking the dual-screen experience. Technical Report 1. Manchester University. DOI: http://dx.doi.org/10.6084/m9.figshare.993993
9. Konstantinos Chorianopoulos, Francisco Javier Bur´on Fern´andez, Enrique Garc´ıa Salcines, and Carlos de Castro Lozano. 2010. Delegating the Visual Interface Between a Tablet and a TV. In Proceedings of the International Conference on Advanced Visual Interfaces (AVI ’10). ACM, New York, NY, USA, 418–418. DOI: http://dx.doi.org/10.1145/1842993.1843096
10. Leon Cruickshank, Emmanuel Tsekleves, Roger Whitham, Annette Hill, and Kaoruko Kondo. 2007. Making Interactive TV Easier to Use: Interface Design for a Second Screen Approach. The Design Journal 20 (2007). 11. Evelien D’heer, C´edric Courtois, and Steve Paulussen. 2012. Everyday Life in (Front of) the Screen: The
Consumption of Multiple Screen Technologies in the Living Room Context. In Proceedings of the 10th European Conference on Interactive Tv and Video (EuroiTV ’12). ACM, New York, NY, USA, 195–198. DOI:http://dx.doi.org/10.1145/2325616.2325654 12. Dillon Eversman, Timothy Major, Mithila Tople, Lauren Schaffer, and Janet Murray. 2015. United Universe: A Second Screen Transmedia Experience. In Proceedings of the ACM International Conference on Interactive Experiences for TV and Online Video (TVX ’15). ACM, New York, NY, USA, 173–178. DOI: http://dx.doi.org/10.1145/2745197.2755520
13. William J. Friedman and Frank Laycock. 1989. Children’s Analog and Digital Clock Knowledge. Child Development 60, 2 (1989), pp. 357–371. http://www.jstor.org/stable/1130982
14. David Geerts, Pablo Cesar, and Dick Bulterman. 2008. The Implications of Program Genres for the Design of Social Television Systems. In Proceedings of the 1st International Conference on Designing Interactive User Experiences for TV and Video (UXTV ’08). ACM, New York, NY, USA, 71–80. DOI: http://dx.doi.org/10.1145/1453805.1453822
15. David Geerts, Rinze Leenheer, Dirk De Grooff, Joost Negenman, and Susanne Heijstraten. 2014. In Front of and Behind the Second Screen: Viewer and Producer Perspectives on a Companion App. In Proceedings of the 2014 ACM International Conference on Interactive Experiences for TV and Online Video (TVX ’14). ACM, New York, NY, USA, 95–102. DOI: http://dx.doi.org/10.1145/2602299.2602312
16. Google. 2012. The New Multi-screen World:Understanding Cross-platorm Consumer Behavior. Google. http://goo.gl/xdbOe1 17. Simon Harper, Eleni Michailidou, and Robert Stevens. 2009. Toward a Definition of Visual Complexity As an Implicit Measure of Cognitive Load. ACM Transactions on Applied Perception 6, 2, Article 10 (March 2009), 18 pages. DOI: http://dx.doi.org/10.1145/1498700.1498704
18. Christopher Heaps and Stephen Handel. 1999. Similarity and features of natural textures. Journal of Experimental Psychology: Human Perception and Performance 25 (April 1999), 299–320. 19. Michael E. Holmes, Sheree Josephson, and Ryan E. Carney. 2012. Visual Attention to Television Programs with a Second-screen Application. In Proceedings of the Symposium on Eye Tracking Research and Applications (ETRA ’12). ACM, New York, NY, USA, 397–400. DOI:http://dx.doi.org/10.1145/2168556.2168646 20. Caroline Jay, Simon Harper, Andy Brown, Maxine Glancy, and Mike Armstrong. 2013. Attention approximation: from the Web to multi-screen television. TVUX-2013 (2013).
21. Jan Kallenbach, Silja Narhi, and Pirkko Oittinen. 2007. Effects of Extra Information on TV Viewers’ Visual Attention, Message Processing Ability, and Cognitive Workload. Comput. Entertain. 5, 2, Article 8 (April 2007). DOI: http://dx.doi.org/10.1145/1279540.1279548
22. Peter Kincaid, Robert Fishburne, Richard Rogers, and Brad Chissom. 1975. Derivation of new readability formulas (Automated Readability Index, Fog Count and Flesch Reading Ease Formula) for Navy enlisted personnel. Technical Report 8-75. United States Naval Education and Training Support Command. 23. Jeremy Klein, Jonathan Freeman, David Harding, and Ali Teffahi. 2014. Assessing the Impact of Second Screen. Technical Report MC/168. Technologia. http://goo.gl/ZEPDbU
24. Gavin Mann, Francesco Venturini, Robin Murdoch, Bikash Mishra, Gemma Moorby, and Bouchra Carlier. 2015. Digital Video and the Connected Consumer. Technical Report. Accenture. 25. Mark McGill, JohnH. Williamson, and StephenA. Brewster. 2015. A review of collocated multi-user TV. Personal and Ubiquitous Computing 19, 5-6 (2015), 743–759. DOI: http://dx.doi.org/10.1007/s00779-015-0860-1
26. Eleni Michailidou, Simon Harper, and Sean Bechhofer. 2008. Visual Complexity and Aesthetic Perception of Web Pages. In Proceedings of the 26th Annual ACM International Conference on Design of Communication (SIGDOC ’08). ACM, New York, NY, USA, 215–224. DOI:http://dx.doi.org/10.1145/1456536.1456581 27. Janet Murray, Sergio Goldenberg, Kartik Agarwal, Tarun Chakravorty, Jonathan Cutrell, Abraham Doris-Down, and Harish Kothandaraman. 2012. Story-map: IPad Companion for Long Form TV Narratives. In Proceedings of the 10th European Conference on Interactive Tv and Video (EuroiTV ’12). ACM, New York, NY, USA, 223–226. DOI: http://dx.doi.org/10.1145/2325616.2325659
28. Timothy Neate, Matt Jones, and Michael Evans. 2015a. Designing Attention for Multi-screen TV Experiences. In Proceedings of the 2015 British HCI Conference (British HCI ’15). ACM, New York, NY, USA, 285–286. DOI:http://dx.doi.org/10.1145/2783446.2783613 29. Timothy Neate, Matt Jones, and Michael Evans. 2015b. Mediating Attention for Second Screen Companion Content. In Proceedings of the 33rd Annual ACM Conference on Human Factors in Computing Systems (CHI ’15). ACM, New York, NY, USA, 3103–3106. DOI:http://dx.doi.org/10.1145/2702123.2702278 30. Aude Oliva, Michael L. Mack, Mochan Shrestha, and Angela Peeper. 2004. Identifying the Perceptual Dimensions of Visual Complexity of Scenes. In Proceedings of the Annual Meeting of the Cognitive Science Society.
31. Henning Pohl and Roderick Murray-Smith. 2013. Focused and Casual Interactions: Allowing Users to Vary Their Level of Engagement. In Proceedings of the SIGCHI Conference on Human Factors in Computing Systems (CHI ’13). ACM, New York, NY, USA, 2223–2232. DOI: http://dx.doi.org/10.1145/2470654.2481307
32. Katharina Reinecke, Tom Yeh, Luke Miratrix, Rahmatri Mardiko, Yuechen Zhao, Jenny Liu, and Krzysztof Z. Gajos. 2013. Predicting Users’ First Impressions of Website Aesthetics with a Quantification of Perceived Visual Complexity and Colorfulness. In Proceedings of the SIGCHI Conference on Human Factors in Computing Systems (CHI ’13). ACM, New York, NY, USA, 2049–2058. DOI: http://dx.doi.org/10.1145/2470654.2481281
33. Scott Robertson, Cathleen Wharton, Catherine Ashworth, and Marita Franzke. 1996. Dual Device User Interface Design: PDAs and Interactive Television. In Proceedings of the SIGCHI Conference on Human Factors in Computing Systems (CHI ’96). ACM, New York, NY, USA, 79–86. DOI: http://dx.doi.org/10.1145/238386.238408
34. John Rooksby, Mattias Rost, Alistair Morrison, Marek Bell, Mathew Chalmers, and Timothy Smith. 2014. Practices of Parallel Media: Using Mobile Devices When Watching Television. In CSCW – Designing with Users for Domestic Environments: Methods, Challenges and Lessons Learned. ACM. 35. Jacqueline Sachs. 1974. Memory in reading and listening to discourse. Memory and Cognition 2, 1 (1974), 95–100. DOI: http://dx.doi.org/10.3758/BF03197498
36. Han Sloetjes and Peter Wittenburg. 2008. Annotation by Category: ELAN and ISO DCR.. In LREC. 37. Emmanuel Tsekleves, Roger Whitham, Koko Kondo, and Annette Hill. 2009. Bringing the Television Experience to Other Media in the Home: An Ethnographic Study. In Proceedings of the Seventh European Conference on European Interactive Television Conference (EuroITV ’09). ACM, New York, NY, USA, 201–210. DOI: http://dx.doi.org/10.1145/1542084.1542125
38. Christian Valuch, Ulrich Ansorge, Shelley Buchinger, Aniello Raffaele Patrone, and Otmar Scherzer. 2014. The Effect of Cinematic Cuts on Human Attention. In Proceedings of the 2014 ACM International Conference on Interactive Experiences for TV and Online Video (TVX ’14). ACM, New York, NY, USA, 119–122. DOI: http://dx.doi.org/10.1145/2602299.2602307
39. Anna Van Cauwenberge, Gabi Schaap, and Rob Van Roy. 2014. ”TV No Longer Commands Our Full Attention”: Effects of Second-screen Viewing and Task Relevance on Cognitive Load and Learning from News. Computers in Human Behavior 38 (Sept. 2014), 100–109. DOI: http://dx.doi.org/10.1016/j.chb.2014.05.021