I. J. Computer Network and Information Security, 2015, 8, 9-20 Published Online July 2015 in MECS (http://www.mecs-press.org/) DOI: 10.5815/ijcnis.2015.08.02
Destination Address Entropy based Detection and Traceback Approach against Distributed Denial of Service Attacks Abhinav Bhandari and A.L Sangal National Institute of Technology, Jalandhar, India Email: {
[email protected],
[email protected]}
Krishan Kumar SBS, State Technical Campus, Ferozpur, India Email:
[email protected]
Abstract—With all the brisk growth of web, distributed denial of service attacks are becoming the most serious issues in a data center scenarios where lot many servers are deployed. A Distributed Denial of Service attack generates substantial packets by a large number of agents and can easily tire out the processing and communication resources of a victim within very less period of time. Defending DDoS problem involved several steps from detection, characterization and trace back in order todomitigation. The contribution of this research paper is a lot more. Firstly, flooding based DDoS problems is detected using obtained packets based entropy approach in a data center scenario. Secondly entropy based trace back method is applied to find the edge routers from where the whole attack traffic is entering into the ISP domain of the data center. Various simulation scenarios using NS2 are depicted in order to validate the proposed method using GT-ITM primarily based topology generators. Information theory based metrics like entropy; average entropy and differential entropy are used for this purpose.
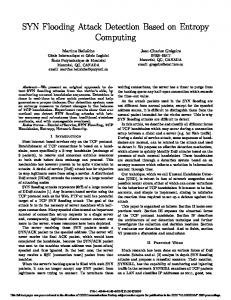
Gbps at the top end, through 200 Gbps, 191 Gbps, 152 Gbps, 130 Gbps and 100 Gbps [1]. This sharp increase in attack traffic once again proves that attackers are continuing to shift methodology to make use of the latest attack capabilities available to them and to focus attacks on the most vulnerable areas of a network. In 2013, short and sharp attacks appeared to be more common, with 88 percent of attacks lasting less than one hour, up from 78 percent last year.
Index Terms—DDoS attacks, data center, entropy, average entropy, differential entropy, trace back. Fig.1. Size of largest reported DDoS attack (in Gbps) [1]
I. INTRODUCTION Network security is more challenging than ever as today’s corporate networks become increasingly complex due to scalable architecture of the Internet. With each passing year, the security threats faced by the computer networks have become more technically sophisticated, better organized and harder to detect. One of the major threats to cyber security is Distributed Denial-of-Service (DDoS) attack in which the victim network element(s) are bombarded with high volume of fictitious, attacking packets originated from a large number of machines. The aim of the attack is to overload the victim and render it incapable of performing normal transactions. Over the last year, DDoS attacks evolved in strategy and tactics. According to the survey report for the year 2014 Fig.1 shows the customers reported attacks ranging from 309 Copyright © 2015 MECS
Network security researchers have designed developed and implemented a number of countermeasures against these attacks but none of the methods provides ideal solution because of the smartness of the attackers. Every time a new method is invented, the attackers will a design a counter defending method to attack. As stated by the [2] for a comprehensive DDoS Solution four modules detection, characterization, trace back and mitigation are required. Detection is the process of identifying that a network or server is under attack after the launch of the attack. It requires traffic monitoring and its refined behavioral analysis. Characterization means discriminating attack traffic from legitimate traffic. It is hindered by the fact that attack and legitimate traffic look alike. However, good characterization is of immense im
I.J. Computer Network and Information Security, 2015, 8, 9-20
10
Destination Address Entropy based Detection and Traceback Approach against Distributed Denial of Service Attacks
portance to DDoS defense, as it determines the amount of collateral damage and effectiveness of the response. Traceback is process of identifying the actual source of the attack packet or even to zombies which participates in the attack process. It is even more challenging because of the IP spoofing performed by the attackers and the deployment overhead. After identifying the source of the attack or even zombies it is required to send a message to that particular source to stop/rate limit or filter the attack packets. This process is called mitigation. Its purpose is to minimize or lessens the impact of the attack. Fig.2 demonstrates the different modules involved in the DDoS defense framework.
Fig.2. DDoS Defense Modules
This paper makes the following contributions To detect DDoS attacks in a data center where numbers of servers are deployed and one of the servers is under attack. The destination address based entropy is used. To traceback the edge routers of the ISP domain using differential entropy method. To use standard six-sigma method for identifying the threshold values of the entropies for normal traffic. To validate the detection and trace back methods using the NS2 simulation scenarios integrated with GT-ITM topology generators. The rest of the paper is organized as follows. Section II demonstrates the research efforts related to detection and trace back of DDoS attacks. Section III charts out, the information theory basic concepts and their modeling into DDoS detection and trace back problem. Section IV describes the details of simulation scenarios along with results and discussion. Section V concludes to provide future directions in this research area.
II. RELATED WORK Due to prevalent problem of DDoS attacks over the Internet. It is the need of the hour to accurately detect and trace back to mitigate their impact of attacks. Information theory methods include entropy based and information Copyright © 2015 MECS
distances based techniques for detection of attacks. Entropy has been differently used by various researchers. Most of the researchers [2], [3], [4], [5] have used the source IP address entropy for detection for DDoS attacks. In [2] distributed entropy has been used for DDoS detection. The source base IP address entropy may be easily deceived by spoofing of the packet headers. Chi square method has been used for the detection of DDoS attacks [5]. In [6] conditional entropy, information distances have been used for the anomaly base detection. [7] has proposed a hybrid method using traffic volume and entropy for DDoS detection. [4] used the traffic cluster entropy to distinguish between DDoS and flash event. Jun et al. [8] developed a detection method based on the traffic volume and entropy of packet header field. Suspicion is raised to the system on the basis of the traffic volume and further investigation is performed on entropy of source port and number of packets per second. Shi et al. [9] proposed a probabilistic approach to predict potential attacks. They used K means clustering algorithm to define network states and Markov chain model for probabilistic modeling. System is tested using the entropy of source IP address, source port, and destination address and destination port. Rahmani et al. [10] used joint entropy of received packets along with the number of connections per second whereas Gu et al. [11] used relative entropy to detect the anomalies in the network traffic. Oshima et al. [12] developed short-term entropy for detection of DDoS attacks. Standard deviations of entropy distributions are calculated for characterizing the attack traffic from the normal traffic. Sachdeva et al [4] used traffic cluster entropy to discriminate the attack traffic and flash crowd traffic. They used the concept that, during a flash crowd event most of the users have already visited the website some time before which is not in the case of DDoS attack leading to drop in the traffic cluster entropy. Trace back is the process of identifying the true source of origin of the attack. A Number of trace back techniques have been proposed but most of the network security researchers [13], [14], [15] and [16] used packet marking, deterministic packet marking, log based and hybrid of both to identify source of the attack path. These strategies require intermediate routers to alter the packets by injecting their identification mark in the header field. In our earlier work [17] a comprehensive review of the trace back techniques have been done to compare them against some identified metrics. It has been found that all of these methods require ISP involvement, scalability issues and processing overheads. A complete framework includes the detection, characterization, trace back and mitigation module in it .In some recent work of [18] proposed an FCMDPF (flexible, collaborative, multilayer, DDoS prevention framework). This framework mitigates the DDoS attacks using three layered architecture. First layer is deployed at the edge router from where the whole traffic is entering towards the victim. This layer called the OB (Outer Attack Blocking) maintains a database of blacklist IPs that regularly updates by the other two layers by using the signaling technique. The second layer is STBOA (service trace
I.J. Computer Network and Information Security, 2015, 8, 9-20
Destination Address Entropy based Detection and Traceback Approach against Distributed Denial of Service Attacks
back oriented architecture) used to find the source IP of the incoming HTTP request and accustomed to distinguish whether the request is being sent by the machine or a legitimate user. Last layer FAEB (flexible advance entropy based) scheme is used to discriminate between the high rate DDoS attack and flash crowd. Zhou et al. proposed a modular architecture that consists of head sensor, detection module, and traffic filter [19]. The detection of different types of application layer attacks is based on the ratio of entropy of source IPs and URL accessed and they concluded that this ratio is smallest in case of flash events and maximum in repeated request application layer DDoS attacks. We note the key findings related to the current DDoS defense mechanism after thorough analysis. Source IP based entropy is used to detect DDoS attacks in general. Destination address can be helpful to detect DDoS attacks in data centers where network traffic is flowing to the number of servers. Most of the trace back schemes used the third party detection system; moreover for trace back, they used the marking and logging methods which employ extra overhead to the routers. Threshold for the normal traffic is the key concern for generating DDoS alarm.
III. INFORMATION THEORY BASICS Information theory had played a vital role in the anomaly based detection methods. Due to the increase in the unusual traffic patterns because of the DDoS attacks it is very much required to monitor these abnormal behavior. Entropy is a concept identified by the Shannon (1948). It is the measure of randomness or uncertainty of a random variable [20]. Let X be a discrete random variable with alphabet µ and probability mass function as in (1) (1) The Entropy defined as in (2)
of a discrete random variable ∑
is
(2)
Where is the entropy of a random variable X with possible values and distribution of probabilities with n elements, where and Probability is the probability of a packet belonging to a particular flow, where numerator is the number of packets going towards the destination xi and denominator is the total number of packets going towards the different destinations. Entropy can be used in many different ways for detection of anomalies in traffic features. It can be applied to port number, source IP, destination IP and flow. The function of the basic properties of entropy is defined as concave function of the distribution. More random will be the distribution, more will be the value of entropy and more ordered is the distribution lesser will be the value of Copyright © 2015 MECS
11
the entropy. The value of the entropy lies between the ranges of ( ) where Log is of the base 2. The value 0 indicates that there is no randomness in the distribution and the value indicates the maximum randomness in the distribution. Entropy is maximum when the probability mass function have value p=1/2 and its zero when p=0 or 1.This property of information theory can be used in network traffic monitoring. It means entropy can be employed to measure the randomness of flows on a given router. This basic phenomenon can be applied to the different attributes extracted from packet headers like source IP, destination IP, source Port, total number of packets, and even in the clustering schemes leading to the different types of entropies. Our rationale is, when there is flooding based DDoS attacks there is will be possibility that one of the flow which is coming from the attacker dominates the other flows leading into the decrease in the value of entropy. Router entropy stays in stable range when there is no attack and it drops dramatically when there is DDoS Attack or even a Flash event (FE). Second rationale is DDoS attack flows are more similar than the flash crowd flows due to programmed bots. A. Applying Information Theory for DDoS Detection. Concept of entropy as stated above can be applied for DDoS Detection. For this we need to define a very basic concept which is called flow. As stated by [21], a flow is packets who share the common destination address at a router. The frequency of that flow is calculated by finding out the probability of that flow by using “(1)” stated above. After that entropy of that flow at a particular router is calculated by using the “(2)”. When there is DDoS Attack the frequency of the flow which is targeted on victim is extremely high leading to the decrease in the entropy of the router and vice versa for the non-attack case. But when then there is a surge of legitimate accessing i.e. when a flash event occurs entropy also drops dramatically so decrease in entropy at a router can’t distinguish between a surge of legitimate accessing and DDoS Attack. There is a need of the detection metric which can solve this problem. B. Entropy Calculation Example Consider the following example, where two flows, F1 and F2, are incoming at the router R1 and are going towards two different destinations servers D1 and D2 respectively shown in the Fig.3. Then the entropy is calculated on the basis of total number of packets along with the particular destination address as under:
Fig.3. Scenario depicting different flows
I.J. Computer Network and Information Security, 2015, 8, 9-20
12
Destination Address Entropy based Detection and Traceback Approach against Distributed Denial of Service Attacks
No. of packets belonging to F1 = 600 No. of packets belonging to F2 = 400 Total No. of packets = 1000 Probability of packets belonging to F1 = P (F1) = 600/1000= 0.6 Probability of packets belonging to F2 = P (F2) = 400/1000= 0.4 Entropy component of F1 going towards
Entropy component of F2 going towards
dropped dramatically as the case in DDoS attack. Both DDoS attack and FE are required to be handled separately[4]. In order to handle DDoS attack some filtering mechanism is required but to handle FE there in need of extra infrastructure. It has been proved that, for high rates of attacks few of the flows will contribute more in attack resulting in positively skewed distribution and in case of low rate attack, no. of attack flows will be more than legitimate flows resulting in negatively skewed distribution.The value of the for negatively skewed distribution will be more than normal value of entropy without attack and for positively skewed the case will be the reverse C. Stochastic Process and Average Entropy
So Overall entropy of Router R1 is the ∑ of the individual components of the flows giving value
Suppose there is a DDoS attack generated by the attacker with the packets of flow F2 at destination D1. It means the frequency of a flow F2 will be more than the frequency of flow F1. Let’s say 900 packets will be of Flow F2 which is an attack flow and 100 packets of flow F1 going towards victim D1. So, calculating entropies using the “(1)”. Entropy component of F1 going towards
Shuiyu [21] argued that entropy can’t distinguish different distributions with the same amount of uncertainty. This limitation arises due to the fact that the same decrease in the entropy of edge router in case of DDoS and FE. Average entropy is defined on the stochastic process. A stochastic process is an indexed sequence of random variables. A stochastic process is said to be stationary if the joint distribution of any subset of random variables is invariant with respect to shifts in the time index i.e.
The average entropy of a stochastic process {Xi} is defined by Entropy component of F2 going towards (3) Overall entropy will be
So it is been evident from the above example the entropy of a flow at a router will be dropped when there is a DDoS attack. We can check the range of values of entropies also. Suppose there is only one flow alive i.e. all the packets of flow F1 are there and flow F2 packets are not passing through the router. The probability of the flow F1 is 1 which is giving value 0 to entropy of this flow. Similarly if the flow F1 and flow F2 have equal number of packets going through the router to the destination D1 then both has probability 1/2.
that is equal to the value of Log (N) where N is the number of flows i.e. 2 so Log (2) is 1. So it is been clear that value of the entropy will be in the range of , Where N is the Number of flows When there will be a huge number of requests due to flash event, its behavior will be same as that of DDoS attack but the intention is entirely different. In case of flash event value of entropy at a router will also be Copyright © 2015 MECS
It is the average of all the entropies in different time windows. DDoS attack and FE generation are both stochastic processes. We considered that DDoS attacks are generated due to programmed bots due to which the average entropy will be almost similar for the different time windows but the flash crowd events are generated by the legitimate users leading to different average entropy for different time windows.
IV. THE PROPOSED MODEL FOR DETECTION AND TRACEBACK A. Detection Approach In this section we introduce our proposed model for detection and trace back of attack. The flow chart shown below in the Fig.4 describes the detection approach for different cases. The traffic monitoring module is deployed on the edge router of the ISP Domain and it continuously monitors the traffic flowing inside the network domain. The module also calculates the router entropy on the basis of different flows flowing through it for a particular time window. When there is a sudden decrease in the value of the router entropy for or value of entropy falls below the given threshold, there might be possibility of the DDoS attack but the system is not sure whether it
I.J. Computer Network and Information Security, 2015, 8, 9-20
Destination Address Entropy based Detection and Traceback Approach against Distributed Denial of Service Attacks
is a DDoS Attack or a flash event because of the similar characteristics of both the events. So system marks the dominant flow as a suspicious flow. At this stage the program installed on the router calculates the average entropy of different flows at a router using the eq.3 and send notification to its downstream router to calculate the same. The previous value of the average entropy rate at the upstream router and the new value at the downstream router are matched. If the values are exactly same or difference of values is nearly equal or less than a given threshold then system generates the alarm of DDoS to the edge router. To validate more about attack flows we check the standard deviation of flows at different time windows, standard deviation of attack flows will be far less as compared to the flash flows due to programmed bots. So by combining entropy, average entropy and standard deviation of flows, system is able to identify the flow as DDoS. The major challenge in the detection approach is to decide the threshold values of entropy and entropy rate. Wrong value of threshold may lead to increase in the false negative and false negative in turn increases the collateral damage in the system. Six-sigma approach has been used to calculate the threshold value of the entropy and entropy rate [22]. To find six-sigma, calculate sigma or standard deviation, multiply by 6, and add or subtract the result to the calculated mean. Consider the following example where legitimate traffic is flowing through the network for t seconds and the entropy of flow is calculated after every Δt seconds, and then the threshold using Six-Sigma approach is calculated using the following method. β=
13
Edge Routers: These are the routers from where the whole of the traffic is entering in to the victim’s network in an ISP domain. Differential entropy: It is the difference between the overall entropy of the router and entropy component of the flow with maximum no. of packets. This value is the key for taking decision for the trace back process.
(4)
Standard Deviation= σ
(5) –
(6)
B. Traceback Approach Before explaining the trace back approach shown in the Fig.6, we should understand some of the basic terminology used in this method. We considered the Flow: Flow is defined as the no. of packets that are coming from the upstream routers and going towards a particular destination. Most of the times flow is defined on the basis of source address sending packets to the particular destination. Defining flow by this way helps us in the trace back approach in a collaborative manner. Local Flow: It is defined as a flow which is coming out from a local area network (LAN). Upstream Router Flow: It is defined as a flow which is coming out from upstream router not from a LAN. Attack Path: It is defined as the path of routers from the where the attack traffic is passing through and moving towards a particular destination. Copyright © 2015 MECS
Fig.4. Flow chart for detection process
Symbols used in flow chart: H(X): Entropy of flow at a router LT: Legitimate Traffic AT: Attack Traffic Avg. E(X): Average Entropy Rate of a flow at a router µ: Reasonable Threshold value of Entropy in the non-attack case ΔT: Time Window for which traffic is monitored Avg. Ed(X): Average Entropy of downstream Router FE: Flash Event or Surge or Legitimate Accessing
I.J. Computer Network and Information Security, 2015, 8, 9-20
14
Destination Address Entropy based Detection and Traceback Approach against Distributed Denial of Service Attacks
Threshold Entropy Values: These are the values of the entropies of the all the routers when the normal traffic is flowing in the network. Six-sigma method can be used to obtain these values.
Fig.5. Data center scenario
Data center scenario is shown in the Fig 5. There are different servers in the data center and one of the servers is under attack. Hierarchical view of the routers is shown. Router R1 is attached to LAN and flow F1 is a local flow. All the other flows are upstream router flows. R2, R3 and R4 are edge routers. Once the attack has been detected by the detection module, the traceback process is initiated by the router closest to the victim i.e. by R7. R7 has only two incoming flows F5 and F6. Two sets set TR and set ER are initialized and made empty at that router. Set TRwill contain the routers where we have to send the traceback requests and set ERis used for saving the routers of the attack path. Obtain the local parameters like mean and threshold values using the six-sigma method defined above using the normal traffic flows. Arrange all the flows going towards the victim in descending order. If there are variations in the flows (upstream router, destination address) in terms of the packets passing through the router towards the victim then take out the flow with highest no. of packets and calculate the overall entropy of the flow by taking out that flow. If the flow is local flow then add it to the Set ER and if not then add the upstream router of that flow in set TR. Again calculate the variation in the flows if it is still more than the threshold value then take the flow with maximum no. of packets from the remaining flows and repeat this procedure until there are no more variations in the flows passing through that router. If there are no more variations then take one router from set TR and apply above traceback process on it do this until there is no more element in the set TR. Then at last the all the routers that are in the set ER are the edge routers of the attackers. The information regarding these routers are passed to the victim for the mitigation purposes. The victim server sends the messages to all the edge routers to filter out the flow which contains the attack traffic.
Copyright © 2015 MECS
Fig.6.Flow chart for Traceback Method
Symbols used in flow chart: EBA- Entropy Value before Attack THV- Threshold value of Entropy E(X)- Current Entropy Value E(MX)- Entropy Value of Maximum no. of packets in a Flow E(X)-E(MX)- Difference in Entropy(Differential Entropy) SET TR- Contains the upstream routers SET ER- Contains routers in between attack path
I.J. Computer Network and Information Security, 2015, 8, 9-20
Destination Address Entropy based Detection and Traceback Approach against Distributed Denial of Service Attacks
V. SIMULATION AND EXPERIMENT A. Simulation Results This section evaluates the validation of our proposed method using various simulation scenarios generated with and without GT-ITM using NS2 platform shown in Fig.7.The First Scenario is without GT-ITM topology generator. With following Simulation parameters listed in the Table1. Table1. Simulation Parameters 36
ATTACKER NODE
8
LEGITIMATE NODES
13
NO. OF LOCAL ROUTERS
7
NO OF ROUTERS
6
NO. OF EDGE ROUTER VICTIM NETWORK
IN
1
NO. OF VICTIM NODE
1
SIMULATION TIME
30 SECS ( FIRST 5 SECS NON ATTACK, 20 SEC ATTACK PERIOD, LAST 5 SECS NON
Throughput(KB\Sec)
INTERMEDIATE
ATTACK TRAFFIC AGENTS
UDP
APPLICATION OF AGENTS
CBR
During first 5 seconds only legitimate traffic flows through the network. The attack packets are launched at 5.001 seconds. The attack packet generation rate is increased after every 5 seconds. The attack lasts for 20 seconds (i.e. up to 25th second of simulation). Then again the legitimate traffic flows for next 5 seconds. The traced data is analyzed after every 5 seconds. The data required for analysis includes traffic id, source node, number of packets generated by a node, total no of packets lost, total number of packets received, probability of a packet belonging to a particular flow, dropping probability and entropy value for a particular flow. During the non-attack cases, the router entropy remains stable. But during attack periods the router entropy drops dramatically. The quality of service parameters of the user nodes also get affected by the attack i.e. the throughput of the nodes get decreased, delay increases, jitter increases. Thus, there is a decrease in quality of services provided to the legitimate users. The graph presented in Fig.8 shows the effect of DDoS attacks on the throughput of legitimate user nodes for node N23.
The legitimate user nodes are green in color and attacker nodes are red in color. The traffic generation rate of legitimate users is set constant and the simulation of attack traffic is achieved by increasing the rate of the attacker nodes after fixed intervals of time by a constant amount. The legitimate traffic and attack traffic flows are generated by using constant bit rate (CBR) UDP flows in NS2. The legitimate users start sending packets from the time of 0.1 second and the attacker starts sending attack traffic at 5.0 seconds. The experiment lasts for 30 seconds. We have traced the no of packets received in every 5.0 second interval and used this data to perform the further calculations.
60 40 20 0 0
2
4
6
Time(secs)
Fig.8. Decrease in throughput due to DDoS attack at Node 23
As it is clearly visible from the graph the throughput of the legitimate flow decreases when DDoS attacks occurs in the network. The graph presented in Fig.9 shows the variation in entropy when a DDoS attack occurs. 3 2.5 2
Entropy
TOTAL NUMBER OF NODES
15
1.5 1 0.5 0 0
2
4
6
8
Time Fig.9. Variation in Entropy at Router R0
Fig.7. Simple topology without using GT-ITM Model
Copyright © 2015 MECS
The topology shown in Fig.10 is generated by using GT-ITM topology generator tool. The green colored nodes represent the legitimate user nodes, red colored nodes represent the attacker nodes, blue node N14 is the main target of the attackers and yellow colored node N26 I.J. Computer Network and Information Security, 2015, 8, 9-20
16
Destination Address Entropy based Detection and Traceback Approach against Distributed Denial of Service Attacks
represents the second destination node available in the network. The blue colored node is the famous node in the network (i.e. a node which is accessed by most of the visitors). The legitimate traffic flows through the network for first 5 seconds. The attackers start sending large volumes to data packets towards the victim after first 5 seconds at a rate which keeps on increasing with time. The entire simulation runs for 30 seconds. In the last 5 seconds, again only the legitimate traffic flows through the network. The details of the simulation scenario are presented in Table 2 as shown below.
Table 3. Flow based entropies in different time windows at Router R0 Time Window 1 2 3 4 5 6
Flow-based Entropy at R0 Flow Flow towards N14 Flow towards N26 Flow towards N14 Flow towards N26 Flow towards N14 Flow towards N26 Flow towards N14 Flow towards N26 Flow towards N14 Flow towards N26 Flow towards N14 Flow towards N26
Entropy Value 1.3167 0.5161 0.2761 0.1701 0.1629 0.1075 0.1176 0.0803 0.0930 0.06475 0.7473 0.4985
Entropy
1.4 1.2 1 0.8 0.6 0.4 0.2 0 0
2
4
6
8
Time Fig.11. Variation in Entropy at Router R0
The above graph presented in Fig.11shows that as one flow starts dominating in the network, the entropy value starts decreasing. The entropy value starts decreasing after the first time window and then keeps on decreasing with time as the attack strength is increasing. As there is no attack in the last time window, therefore the entropy starts increasing with time. The same change in entropy values is observed at all the router of the transit domain shown in the Fig12.
Fig.10. Topology using GT-ITM Table 2. Simulation Parameters TOTAL NUMBER OF
27
NODES
ATTACKER NODE LEGITIMATE NODES NO. OF DESTINATIONS NO OF TRANSIT DOMAINS AVG NO. ROUTERS IN TRANSIT DOMAIN AVG NO. OF STUB DOMAINS PER TRANSIT DOMAIN ROUTER AVG NO OF NODES IN EACH STUB DOMAIN SIMULATION TIME
TRAFFIC AGENTS APPLICATION AGENTS
4 13 2 1 2 3
4 30 SECS ( FIRST 5 SECS NON ATTACK, 20 SEC ATTACK PERIOD, LAST 5 SECS NON ATTACK UDP
OF
CBR Fig.12 Entropy variation of Flow towards N14 at Router R1
Table3 depicts the entropy calculations for the flow towards N14 (main target node of attackers) at router R0, R1 and R15 respectively. The changes in the value of the entropy are also depicted graphically. Copyright © 2015 MECS
Table.4 depicts the entropy calculations for the flow towards N14 (main target node of attackers) at router R1.The changes in the value of the entropy are also depicted graphically.
I.J. Computer Network and Information Security, 2015, 8, 9-20
Destination Address Entropy based Detection and Traceback Approach against Distributed Denial of Service Attacks
Simulation scenario generated to implement the proposed traceback algorithm using GT-ITM topology generator integrated with NS2. Fig.13.depictsthe scenario in attack case. We have created different LAN’s as stub domains. The nodes in the blue color are the normal users and the nodes in red color are the attackers. Only two attacknodesare created to make the simulation and procedure as simple as possible. The nodes in yellow color are ISP domain routers and the node in green color is the server node N14 which is acting as null agent linked with all UDP agents. This simulation runs for 5 seconds. The details of simulation are given below in Table 5.
Table4. Flow based entropies in different time windows at Router R0 Flow-based Entropy at R1 Time Window
Flow
1
Flow towards N14 Flow towards N26 Flow towards N14 Flow towards N26
0.4307 0.9030 0.0629 0.2434
3
Flow towards N14 Flow towards N26
0.0336 0.1503
4
Flow towards N14
0.0229
Flow towards N26
0.1111
Flow towards N14 Flow towards N26
0.0177 0.0903
Total no. of nodes
36
Flow towards N14
0.3618
No of attacker nodes
2
Flow towards N26
0.8145
No of legitimate nodes
18
No of transit domains
7
Avg. no. of router in transit domain
4
Avg. no. of stub domains per transit node
2
Avg. no. of nodes in each stub domain
4
Simulation period
5 sec
Traffic agent used
UDP
Application on agents
CBR
2
5 6
17
Entropy Value
Table5. Details of Simulation
It is evident from the above calculations and graphs that as the DDoS attacks occur, the entropy of the flow decreases dramatically. This is due to the reason that one flow remains dominant in the network during that attack period. This decrease in entropy value raises an alarm at the transit routers. The transit routers then start calculating the average entropy for the suspicious flows. If the calculated average entropy is less than the threshold value or the difference between the values of the average entropy at different routers is equal or less than the threshold then DDoS attack is confirmed.
Fig.13. Traceback Topology using GT-ITM
The legitimate users start sending packets from 0.0 second, attacker starts sending attack packets at 2.8 second and the simulation lasts for 5.0 seconds. We have traced no. of packets received in every 0.7 second interval and used this data to perform the further calculations i.e. time window is of 0.7 second.In our earlier work regarding Copyright © 2015 MECS
performance metrics we evaluated various metrics at different levels of defense framework [23]. So, to confirm the DDoS attack had launched in simulation, quality of service parameters like throughput, delay and jitter are calculated shown in the Fig.14, Fig.15 and Fig. 16.
I.J. Computer Network and Information Security, 2015, 8, 9-20
18
Destination Address Entropy based Detection and Traceback Approach against Distributed Denial of Service Attacks
Entropy
than the threshold value we can say attack is detected and now we can launch our traceback technique to identify the edge routers of the attackers.
Fig.14. Decrease of throughput of server node (N14)
4.5 4 3.5 3 2.5 2 1.5 1 0.5 0 0.7
Above graph shows the effect of DDoS attack on the throughput of server node N14 for the legitimate users.
1.4
2.1
2.8
3.5
4.2
4.9
Time window
Entropy
Fig.17. Entropy variationsof flows towards node (N14) at router R0
1.4 1.2 1 0.8 0.6 0.4 0.2 0 0.7
Fig.15. Jitter at Server node (N14)over simulation time
Above graph show the effect of DDoS attackon jitter of server node N14 for legitimate users, it got increased after the attack
1.4
2.1
2.8
3.5
4.2
4.9
Time window Fig.18.Differential entropy variations of flows towards node (N14) at router R0
Now it’s time to traceback the source of the attackers. We know that in our simulation there are two attack nodes N6 and N31 with edge routers R1 and R3 respectively. The traceback process is started from the edge router of victim (Server) node i.e. from router R0 in our case. After applying our traceback approach at router R6 the values of two sets are mentioned below. SET TR
SET ER
R2 R3 Fig.16. Delay of all flows at N14 over time
Above graph show the effect of DDoS attacks on delay of flows of legitimate users after confirmation of attack. It has been evident form Fig.17, Fig.18below that the entropy at Router R0 decreases dramatically after the attack traffic reaches to the router R0 i.e. after 2.8 seconds and differential entropy increases after this time interval. When the value of differential entropy is more Copyright © 2015 MECS
There is no attack flow, so apply the traceback process to the routers in Set TR i.e. to the router R3 and R2.Afterapplying our traceback algorithm at router R3 the values of two sets are marked below SET TR
SET ER
R2 R3
I.J. Computer Network and Information Security, 2015, 8, 9-20
Destination Address Entropy based Detection and Traceback Approach against Distributed Denial of Service Attacks
After applying our traceback approach at router R2 we values of two sets are shown below [5] SET TR
SET ER
R2
R3
R3
[6]
R1
there is an attack flow which is not local flow, so put upstream router R1 in Set TR and apply traceback process to the router R1.After applying recursively the same algorithm at router R1, the values of two sets are shown below SET TR
SET ER
R2
R3
R3
R1
[7]
[8]
[9]
There is attack flow which is local flow so put Router1 in Set ER and apply traceback process to router in Set TR, if no more element is left in the set TR, stop the traceback process. Set ER will contain the edge routers of attacker i.e. router R3 and R1.
[10]
[11]
VI. CONCLUSIONS Entropy has been recently used for detection of DDoS attacks. Entropy of the network traffic can be calculated on different basis. Our proposed scheme calculates the entropy on the basis of the destination address of the flows. Different simulation scenarios have been generated to validate the proposed schemes for detection and traceback. Six-sigma approach is employed for calculating the threshold values. The proposed scheme does not impose computational overhead on the routers. Moreover, there is no marking overhead for routers for traceback. The schemes can be implemented as a separate module on various routers of the network. However, approach is not able to detect and traceback the DDoS attacks which are isotropic in nature. This is due to the reason that entropy decreases only when one flow dominates over other flows in the network. REFERENCES
[13]
[14]
[15]
[16]
[17]
[1] "Worldwide Infrastructure Security Report," Arbor Networks, 2014. [2] K. Kumar, R. Joshi and K. Singh, "A Distributed Approach using Entropy to Detect DDoS Attacks in ISP Domain," in Signal Processing, Communications and Networking, 2007. ICSCN '07. International Conference, 2007. [3] Y. Chen and K. Hwang, "Collaborative Change Detection of DDoS Attacks on Community and ISP Networks," in Collaborative Technologies and Systems, 2006. CTS 2006. International Symposium, 2006. [4] M. Sachdeva and K. Kumar, "A traffic cluster entropy based approach to distinguish DDoS Attacks from flash
Copyright © 2015 MECS
[12]
[18]
[19]
[20]
19
event using DETER testbed," ISRN Communications and Networking, 2014. L. Feinstein, D. Schnackenberg, R. Balupari and D. Kindred, "Statistical approaches to DDoS attack detection and response," in DARPA Information Survivability Conference and Exposition, 2003. Proceedings, 2003. L. Wenke and X. Dong, "Information-theoretic measures for anomaly detection," in Security and Privacy IEEE Symposium, 2001. Y. chen and K. Hawang, "Collaborative change detection of DDoS attacks on community and ISP networks," in Collaborative Technologies and Systems, CTS IEEE, 2006. J.-H. Jun, C.-W. Ahn and S.-H. Kim, "DDoS attack detection by using packet sampling and flow features," in Proceedings of the 29th Annual ACM Symposium on Applied Computing., 2014. S. Seongjun, S. Lee, H. Kim and S. Kim, "Advanced probabilistic approach for network intrusion forecasting and detection," Expert Systems with Applications, vol. 40, no. 1, pp. 315-322, 2013. H. Rahmani, S. Nabil and K. Farouk, "Joint entropy analysis model for DDoS attack detection." Information Assurance and Securit," in Information Assurance and Security, 2009. IAS'09. Fifth International Conference, 2009. G. Yu, A. McCallum and T. Don, "Detecting anomalies in network traffic using maximum entropy estimation," in Proceedings of the 5th ACM SIGCOMM conference on Internet Measurement, 2005. S. Oshima, N. Takuo and S. Toshinori, "DDoS detection technique using statistical analysis to generate quick response time," in Broadband, Wireless Computing, Communication and Applications, 2010. A. Yaar, A. Perrig and D. Song, "StackPi: New Packet Marking and Filtering Mechanisms for DDoS and IP Spoofing Defense," Selected Areas in Communications, IEEE Journal, vol. 24, no. 10, pp. 1853-1863, 2006. A. Belenky and N. Ansari, "On IP traceback," Communications Magazine, IEEE, vol. 41, no. 7, pp. 142153, 2003. T. Baba and S. Matsuda, "Tracing Network Attacks to Their Sources," IEEE Internet Computing, vol. 6, no. 2, pp. 20-26, March/April 2002. B. Al-Duwairi and M. Govindarasu, "Novel hybrid schemes employing packet marking and logging for IP traceback," Parallel and Distributed Systems, IEEE Transactions, vol. 17, no. 5, pp. 403-418, 2006. K. Kumar, A. Sangal and A. Bhandari, "Traceback techniques against DDOS attacks: A comprehensive review," in Computer and Communication Technology (ICCCT), 2011. M. Saleh and A. Manaf, "A Novel Protective Framework for Defeating HTTP-Based Denial of Service and Distributed Denial of Service Attacks," The Scientific World Journal, 2014. W. Zhou, W. Jia, S. Wen, Y. Xiang and W. Zhou, "Detection and defense of application-layer DDoS attacks in backbone web traffic," Future Generation Computer Systems, vol. 38, pp. 36-46, 2013. T. M. Cover and T. A, Elements of Information Theory, Wiley, 2006.
I.J. Computer Network and Information Security, 2015, 8, 9-20
20
Destination Address Entropy based Detection and Traceback Approach against Distributed Denial of Service Attacks
[21] S. Yu and W. Zhou, "Entropy-based collaborative detection of DDOS attacks on community networks," in Pervasive Computing and Communications, 2008. PerCom 2008. Sixth Annual IEEE International Conference on. IEEE, 2008. [22] B. B. Gupta, M. Misra and R. C. Joshi, "An ISP level solution to combat DDoS attacks using combined statistical based approach.", in arXiv preprint arXiv:1203.2400, 2012. [23] A. Bhandari, A. L. Sangal and K. Kumar, "Performance Metrics for Defense Framework against Distributed Denial of Service Attacks," International Journal of Network Security, vol. VI, pp. 38-47, 2014.
and 2 International Books in the field of Computer Science & Network security. He has published more than 90 papers in national / International peer reviewed / Indexed / impact factor Journals and IEEE, ACM and Springer proceedings. His publications are well cited by eminent researchers in the field.
Authors’ Profiles Abhinav Bhandari received a Bachelor of Engineering degree in Computer Science & Engineering from P.T.U in 2001, and M.Tech. Degree in Computer Science & Engineering from PTU in 2008.Since July 2010 he has joined as a research scholar in Dr. B.R Ambedkar National Institute of Technology, Jalandhar. His research interests are in Computer Networks, Network Security, DDoS attacks.
Dr.A. L. Sangal is professor in the Department of Computer Science and Engineering, at Dr. B.R. Ambedkar National Institute of Technology Jalandhar (Punjab), India since 2008. He obtained his B.Tech. Degree from Panjab Engineering College Chandigarh, India in the year 1985 and Master Degree in the year 1991 from Thapar Institute of Engineering & Technology Patiala (Punjab), India and Ph.D. in the field of Scientific Computing from Dr. B.R. Ambedkar National Institute of Technology Jalandhar (Punjab), India in 2008. He has served as a faculty at Thapar Institute of Engineering & Technology Patiala and Dr. B.R. Ambedkar National Institute of Technology Jalandhar and served as Head of the Department of Computer Science and Engineering since 1992-2006. He has published many research papers in the field of Scientific Computing and Wireless Networks in International Journal and Conferences. One candidate has completed his doctorate under his guidance and presently guiding seven research scholars of Ph.D.
Dr. Krishan Kumar is Associate Professor in department of Computer Science & Engineering at Shaheed Bhagat Singh State Technical Campus, Ferozepur, Punjab, India. He has done B. Tech. Computer Science & Engineering from National Institute of Technology, Hamirpur in 1995. He completed his Master of Software Systems from Birla Institute of Technology & Sciences, Pilani in 2001. He finished his regular Ph.D. from Indian Institute of Technology, Roorkee in February, 2008. He has 20 years of teaching, research and administrative experience. His general research interests are in the areas of Network Security and Computer Networks. Specific research interests include Intrusion Detection, Protection from Internet Attacks, Web performance, Network architecture/protocols, and Network measurement/ modeling .He has published 2 national
Copyright © 2015 MECS
I.J. Computer Network and Information Security, 2015, 8, 9-20