Entropy Based Community Detection in Augmented Social Networks Juan David Cruz
C´ecile Bothorel
Franc¸ois Poulet
LUSSI Department T´el´ecom – Bretagne Brest – France
[email protected]
LUSSI Department T´el´ecom – Bretagne Brest – France
[email protected]
IRISA Universit´e de Rennes I Rennes – France
[email protected]
Abstract—Social network analysis has become a major subject in recent times, bringing also several challenges in the computer science field. One aspect of the social network analysis is the community detection problem, which is seen as a graph clustering problem. However, social networks are more than a graph, they have an interesting amount of information derived from its social aspect, such as profile information, content sharing and annotations, among others. Most of the community detection algorithms use only the structure of the network, i.e., the graph. In this paper we propose a new method which uses the semantic information along with the network structure in the community detection process. Thus, our method combines an algorithm for optimizing modularity and an entropy–based data clustering algorithm, which tries to find a partition with low entropy and keeping in mind the modularity. Index Terms—Social Networks Analysis, Graph Clustering, Community Detection, Entropy
I. I NTRODUCTION A social network is composed of a group of actors linked according to different types of relationships. However, a social network contains more information than only links and actors: all the elements in the network may have additional information regarding the social context in which they exist. This non–topological information enriches the network, allowing several social network analysis to be performed from different semantic perspectives and not only from the structural one. For example, in a social network of the employees from an enterprise, and being their links whether they have sent messages to each other or not, it is possible to consider the type of projects each employee has been involved into. Thus, we could search communities of people which have met before and have worked in similar projects. Those communities of cooperation could be used to find experts or to create work teams in the organization. We could also consider the employees’ competencies and discover communities of practice. If the profiles reflect more organizational aspects, it could be interesting to compare organisational communities with the above communities of practice. In order to provide such analysis from different perspectives, we propose a method which combines information from the network topology and from the actors’ profile (also called here the network’s semantic information). This semantic information can be divided into subsets of information, called points
of view. Then, a point of view can be defined as an ensemble of features which represents a state of the network under a given perspective and can be used to guide, in this case, the communities detection process. The paper is organized as follows: in Section II some relevant previous work is presented, in Section III is presented the point of view and its relation with social networks. In Section IV presents the algorithm of communities detection, in Section V some experiments are presented and discussed, and in Section VI some conclusions and future work are presented. II. R ELATED W ORK Several methods have been developed to find clusters in a graph, or which is equivalent, to find communities in a social network. In general, those methods have been defined as optimization problems where the objective function is the maximization of some quality index. The indices measure the quality of a partition C based on the number of edges within the cluster and the number of inter–cluster edges. Gaetler [1] and Brandes et al., [2] define three quality indices: the coverage, which measures the weight of all the intracluster edges compared to the weight of all edges within the graph; the conductance, which is based on the observation that if a cluster is well connected, then, a large number of edges have to be removed in order to bisect it, and the performance, which defines the quality of a given cluster based on whether a pair of nodes forming an edge belongs to the same cluster or, two disconnected nodes belong to different clusters. In both cases it is said that the classification is correct. Additionally, another index, the modularity Q, proposed by Newman et al. [3], compares the fraction of the edges within each cluster with the fraction of edges among clusters, i.e., the intracluster edges density versus the inter-cluster sparsity. The algorithm proposed by Newman [4] iteratively finds and removes the edge with the highest betweenness score. This process allows to find groups which are loosely connected between them and with well connected nodes within the group. The partition with the highest modularity gives the best partition. The main drawback of this approach is the complexity of the calculation of the betweenness, the general algorithm will take O (mn2 ) for m edges and n nodes, its cost for huge graphs is prohibitive.
One of the most commonly used to measure the quality of a graph partition, according to Fortunato [5] is the modularity Q proposed by [3]. In general these approaches can find better partitions when the adjacency matrix of the graph is sparse [5]. The modularity compares the fraction of the edges within each cluster with the fraction of edges among clusters, thus, a higher modularity means that the proportion of the edges falling into clusters are grater than the edges between them. However, the direct calculation of the modularity is an O (n2 ) operation. To reduce the calculation time of the modularity, Blondel et al., [6], have proposed an agglomerative algorithm to find communities. In the first step each node is assigned to one community and the initial modularity is calculated. Then, each node i is removed from its community and moved iteratively to each community. After each movement the modularity gain is calculated, and i will be assigned to the community giving the largest positive gain of Q. If no positive gain is possible, i remains in its original community. This process is applied iteratively until no further improvement can be achieved and no individual move will improve the modularity. This algorithm is executed in linear time for sparse graphs [6]. Du et al., [7] present an algorithm to detect communities in large–scale social networks. Their method is based on the enumeration of all the maximal cliques, i.e., a complete subgraph which is not contained in any other complete subgraph. After all the maximal cliques are enumerated, they generate kernels associated to those cliques and then, perform the community detection by assigning nodes to each kernel. After this, they try to optimize the modularity obtained by moving nodes accordingly. Most of the classic algorithms find disjunct partitions. However, most of the social networks from the real world may contain actors belonging to more than one community. For example, Pizzuti [8] presents a method for detecting overlapped communities. This method uses a genetic algorithm with a fitness function which minimizes the relation between the edges within each group and the edges connecting nodes outside each group. Lipczak et al., [9] propose a genetic algorithm for detecting communities. In this case, the individuals are represented as a string of groups, which is a vector of size n containing the number of items in each of the n groups. During the selection and the crossover operations, the genes are selected according to the potential improvement of the fitness function they may give. The fitness function, in fact, is composed of three measures, the normalized cut, proposed in [10], the modularity, proposed in [3], and the silhouette width, proposed in [11]. Other clustering methods, such as Markov Clustering, Iterative Conductance Cutting and geometric minimum spanning tree, are discussed in [2], and some methods for evaluating communities are presented in [12] and in [13]. The previous methods only consider topological properties of the Social Network. The closest related work is the one by Zhou et al. [14], who present a communities detection
approach using structural and attribute similarities. They use a random walk throughout a predefined set of k clusters, and tries to maximize the distance between clusters by moving nodes according to their similarity. First, they create an augmented graph from the node attributes, then they execute the random walk over the transition matrix generated by the augmented graph. This leads to find k groups of semantically close nodes. To measure the clustering from a structural point of view, they use the density of edges within the clusters. III. D EFINING THE P OINT OF V IEW OF S OCIAL N ETWORKS Non–topological information can be seen as features associated to the actors and to the relationships in the network, and give more elements to analyze an augmented network from different perspectives. A. Some Notations Given an undirected graph G (V, E) representing a social network, where V, ∣V ∣ = n, is the non-empty set of vertices representing actors and E, ∣E∣ = m, is the set of edges representing the relationships among them. Let vi and vj be two vertices from V , if e (vi , vj ) ∈ E then vi and vj are neighbors. Let Dvi be the set of neighbors of the node vi . A partition C = {C1 , C2 , . . . , Ck } is a partition of the set V into k non–empty disjoint subsets Ci . To take actors’ profiles into account, let FV be the set of features describing the actors of the social network, which can be represented by a matrix of size n × ∣FV ∣. B. Representation of Point of View A point of view of a graph represents a subset of features of the nodes that can be used to find semantic similarities among them. Thus, given an augmented social network S = ⟨G, FV ⟩, let FV∗ ∈ ℘ (FV ), be a set of features to define the point of view P oV . For each vertex vi ∈ V we assign a vector ξi → R, of size ∣FV∗ ∣ = f . Then, each vector ξ can be defined as ξi = vi × FV∗ , where vi ∈ V . Therefore, a point of view is defined as the set of the union of all instances derived from the set FV∗ : n
P oVFV∗ = ⋃ ξi
(1)
i=1
Note that different nodes could have the same instance ξ. C. Data Entropy Entropy measures the average Shannon information content of a set: a highly disordered set has a high entropy. When it comes to data mining, the entropy of a group is used to measure how similar are its elements: a group with similar elements has a low entropy, i.e., is more ordered. Thus, given a group C of N = ∣C∣ elements, the entropy H (C) of the group is given by: N −1
N
H (C) = − ∑ ∑ sij ln sij + (1 − sij ) ln (1 − sij ) i=1 j=i+1
(2)
where sij is a similarity measure of elements i and j [15]. Note that lim x ln x = 0. x→0 Using the entropy, it is possible to measure the overall quality of a partition P using: H = ∑ H (Ci ) Ci ∈P
(3)
D. Using the Entropy to Measure the Semantic Similarity Given a node partition C and a P oVFV∗ , it is possible to measure the entropy of the partition HC to minimize the semantic disorder: k
HC = ∑ H (Ci )
(4)
i=1
In this case, the entropy of a cluster i, H (Ci ), is calculated for the point of view instances of the nodes in the cluster. Hence, using the equation 2: ∣Ci ∣−1 ∣Ci ∣
H (Ci ) = − ∑
∑ sjl ln sjl + (1 − sjl ) ln (1 − sjl )
(5)
j=1 l=j+1
where sjl is the similarity between the instances ξj and ξl ∀j, l ∈ Ci . Thus, the entropy of a cluster is minimized when its nodes are semantically similar. Note that the maximum possible entropy value, M axHC , is obtained when all the nodes are grouped into the same cluster. IV. C LUSTERING AUGMENTED S OCIAL N ETWORKS The goal of clustering an augmented social network S is to find partitions of nodes which are both structurally and semantically close according to some given point of view. The structural closeness is, in general, given by the proportion of intra–cluster edges versus the inter–cluster edges. This closeness can be measured using the modularity Q. On the other hand, the semantic closeness is given by the similarity of the instances ξ of the nodes in groups. To measure this closeness, we use the equation 3. Thus, our approach maximize the modularity and minimize the entropy of the partition C taking into account that by improving one, the other will be diminished. A. Entropy Minimization Given a partition C, the entropy optimization is performed using a Monte-Carlo approach, similar to the one presented in [16]. The algorithm begins by measuring the initial entropy of the partition using the equation 3. Then, a random node nr is removed from a random cluster Ar and inserted into another random cluster B such that B ∉ DAr . If the change does not improve the entropy, the node is returned to its original community, otherwise is kept. This is repeated until all the nodes have been tested and no further changes improve the entropy or a maximum number of iterations is reached.
Algorithm 1 Entropy Optimization Algorithm Require: C, imax, P oVFV∗ 0 1: H0 ← HC 2: i ← 0 3: while i < imax and More possible changes do 4: i←i+1 5: A ←random cluster from C 6: x ←random node ∶ x ∈ A 7: A (x, −) 8: B ←random cluster from C ∖ {DA ∪ A} 9: B (x, +) 10: Hi ← HCi 11: if Hi ≥ Hi−1 then 12: B (x, −) 13: A (x, +) 14: end if 15: end while 16: return CH {A new partition with a reduced entropy}
The algorithm 1 shows how the optimization works. In the algorithm, the function Cj (x, ⋅), represents either the insertion ’+’ or the removal ’−’ operation. Note that the algorithm requires a predefined partition to select and move nodes, so this step will be an intermediate one in the whole process of communities detection. In next section the complete communities detection algorithm is presented. B. Graph Clustering Algorithm The graph clustering algorithm is based on the modularity optimization algorithm proposed by Blondel et al., [6]. This is an agglomerative algorithm which maximizes the modularity by locally changing the composition of the communities. The algorithm has two steps: i) first, the modularity optimization, then ii) a community aggregation to create a graph of communities. These two steps are repeated until the modularity cannot be improved. To integrate the semantic aspect of the nodes, we include the entropy optimization as an intermediate step between i) and ii). This will move nodes among the clusters found during i) to minimize semantic disorder. Then, the community aggregation is performed using the new partition configuration given by the algorithm 1. In the algorithm 2 is presented the method used, which combines the two aspects of the social network. Thus, the algorithm begins calculating the actual modularity (line 2), as a reference value. Then, a single modularity optimization step is performed, creating the initial partition C0 and returning its modularity Q0 (line 3). Then, in the line 4, a single entropy optimization step is performed using the actual partition Ci . This returns a partition CH used to aggregate the communities (line 7). After the aggregation, another step of the modularity optimization is performed (line 10). This process is repeated iteratively until no modularity improvement can be achieved. According to Blondel et al., [6], the modularity optimization algorithm runs in O (n) for sparse networks.
Algorithm 2 Augmented Graph Clustering Algorithm Require: ε, imax, P oVFV∗ 1: i ← 0 2: Qactual ←modularityCalc() 3: Qi ←modularityOptimizationStep() 4: CH ←entropyOptimization ( Ci ) 5: C0 ← CH 6: while Qactual − Qi > ε and i < imax do 7: communityAggregation( Ci ) 8: Qactual ← Qi 9: i←i+1 10: Ci ←modularityOptimizationStep() 11: Qi ←modularityCalc() 12: end while 13: return C
●
Gender Major ● Second major or minor ● House ● Year ● High school The goal of the experiments is to observe how the partition configuration can be changed using non–topological information and to look what happen with the communities. For the experimentation we compare the clustering results of a classic clustering algorithm and our proposed method. The classic algorithm is the fast unfolding which finds communities using only the structure of the graph, denoted by CF U , and our proposed method denoted by CF U +Ent . ●
Initial Q −2.8629 × 10⁻⁴
The calculation of the entropy for the whole data set is 2 O (∣P oV ∣ × ( n 2+n − 1)), taking most of the calculation time. Then, to reduce the calculation time of the entropy, we store the contribution of each node to the entropy of its community making only sums and subtractions of it when a node is moved. This contribution is given by: δ (vj , i) = ∑ suvj ln suvj + (1 − suvj ) ln (1 − suvj )
(6)
u∈Ci
where vj is the j−th node from community i. Using equation 6 only the difference of entropy is computed when each node is moved; no need to recalculate the entropy of the whole partition. Thus, during each movement of nodes δ (vj , i) will be calculated twice, one for the departing community and one for the arriving community. The complexity Oδ of the operation is: O (∣P oV ∣ × ni ), where ni is the number of elements inside the community i. Note that the objectives of each optimization are different, which makes that the entropy optimization will change the value of the modularity in each single step, creating a trade–off between the modularity and the entropy. This means that while perfect semantic groups produce bad modularity values, good structural graph partition produces, in general, bad semantic groups. V. E XPERIMENTS AND C OMPLEXITY Experiments were performed to measure the quality of the clustering and to analyze the complexity of the algorithm in terms of the time execution.
PoV 1 2
Feature Gender Major
Initial Entropy 0.2286 0.2318
TABLE I D ESCRIPTION OF THE DATA SETS USED IN THE EXPERIMENTATION .
The table I shows the initial configuration of the data set. For measuring the entropy we use a normalized value instead of a raw value. This gives an idea of the reduction of the entropy compared to the maximum value M axHC . Thus, the initial entropy is calculated using the partition obtained from the structural clustering and measuring how similar are the nodes according to the selected point of view, in this case, gender, for the first experiment, and major for the secon. The selected points of view are composed of one feature, the first one, the gender which may be one of three value: 1 male, 2 - female, or 0 if the value is not known. The second point of view is the major of each student. For this point of view there are 76 different majors plus a group of unknown values. To perform the experiments, for each point of view the algorithm was executed 30 times. Each execution gives a value for the modularity and another value for the entropy, then, we take the average modularity and entropy to compare with the reference values. PoV P oV1 P oV2
Exp. CF U
CF U +Ent CF U CF U +Ent
Average Q 0.4180 (±0) 0.2565 (±0.006065) 0.4180 (±0) 0.2440 (±0.004242)
Average Entropy 0.2286 (±0) 0.1381 (±0.0025741) 0.2318 (±0) 0.1356 (±0.001493)
A. Experiments
TABLE II R ESULTS OF THE EXPERIMENTS PERFORMED COMPARING THE RESULT OF THE CLASSIC ALGORITHMS VERSUS THE PROPOSED METHOD .
Some quality test preliminary experiments have been developed using a graph extracted from the Facebook100 data set [17]. The graph contains 6386 nodes and 435324 edges, representing intra–school social links, and has an initial modularity of −2.8629 × 10⁻⁴ . Each graph in this data set contains a set of semantic information for each node: ● Student faculty
The table II shows the results for 30 executions of the algorithm for each point of view. In both cases, the entropy value is below the references shown in the table I, which represents an improvement of the semantic proximity. Note also that in both cases the modularity is lower than the
Pair P oV∅ − P oVGender P oV∅ − P oVM ajor P oVGender − P oVM ajor
Rand Index 0.4232 0.3070 0.3919
TABLE III R AND INDEX OF PARTITIONS
The table III shows the percentage of agreements of each pair of points of view. This means, first, that the partition configuration is different for each point of view, showing that using non–topological information will change the result of the clustering process. The structural partition is closer to the Gender-oriented partition than the Major-oriented one. Such conclusion may be useful to conduct sociological studies. Additionally, the different point of view analysis may reveal different interaction patterns between communities. For example, some actors, influent in a point of view context, may be less central in another point of view context. B. Complexity Considerations One concern about clustering algorithms is the complexity, specially the execution time. We know from [6] that the complexity of the fast unfolding algorithm is linear according to the number of edges. Our algorithm introduces a complexity layer due to the entropy calculation for the while node set. By using equation 6 the total entropy do not need to be recalculated each time a node is moved to another group, instead, only the entropy contribution is changed. This reduces
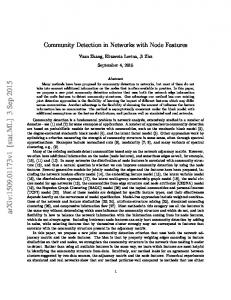
the general complexity. However, the entropy of each group has to be recalculated, which takes some time according to the number of features in the point of view. To test the complexity of the algorithm in terms of the number of features, we have created a point of view of 100 features with random values, and the same graph used in the previous section. The idea in this case is not to measure the quality of the clustering but to measure how the number of features influence the execution time. Figure 1 shows the impact of the number of features in the execution time for two similarity measures. Both experiments were executed in the same machine under the same conditions. Algorithm Execution Time 60000
50000 Execution Time (ms)
reference value, i.e. modularity of CF U . This is explained by the fact that changing the “optimal” community structure will reduce the modularity. For example, as in [18], when the nodes are perfectly grouped according the point of view, the modularity has its worst value. In the partition using a null point of view, i.e., using only the topological information, there are 18 communities, which do not take into account any semantic information. For the first point of view, there are 7 communities, grouped into more, semantically, homogeneous clusters. Remind that there are 3 semantic classes (including the unknown values) to group all the nodes, thus, to have a perfect semantic clustering, we would need to group all the nodes in three different clusters, however, since these classes do not represent the structure of the graph, the obtained modularity may be worse than the initial one. For the second point of view there are 7 communities also. however, these communities are differently configured. Since the grouping criteria is different, looking into the clusters through the gender feature, we can see how the distribution of each gender within the groups are different from the first point of view. This different configuration will lead to further analyses regarding some communities interaction patterns and how they are changed when the grouping condition is changed. To compare how different are the partitions it is possible to use the Rand Index [19], which measures the percentage of agreements between partitions.
40000
30000
20000
10000
0 0
20
40 60 Number of Features
80
100
Simple Matching Coefficient Cosine Distance
Fig. 1. Execution time of the algorithm for the same graph and point of view with different similarity measures.
The experiments were executed in the following way: first, the execution time for the algorithm and 0 features, i.e., the point of view null, is calculated; then, the number of features used is increased by one until all the features are used. After each increase the algorithm is completely executed. Note that in both cases the trend is linear over the number of features. The difference between the graphs is due to the calculation time of each similarity measure. The simple matching coefficient simply counts one by one the matches between two vectors and then divides that count into the number of values. On the other hand, the cosine distance calculates the projection of the vectors. These two measures are linear, however the cosine distance has a bigger constant, which in the long turn will make the algorithm to take more time to finish. VI. C ONCLUSIONS AND F UTURE W ORK In the communities detection problem the goal is to find groups of nodes which are related in some way, wether structurally, semantically or both. However, most of the current algorithms have been developed to use only de structural information to find these communities, or groups, by trying
to optimize the fraction of edges within a group with respect the edges between the groups. The inclusion of semantic information to the communities detecting problem is challenging because of the nature of the data: in one hand, a graph structure, and in the other hand, multidimensional points representing some latent space. Each one has different measures of proximity and similarity and they have also different representations. To use at the same time both types of information we proposed an entropic based approach, which takes a previously calculated modularity based partition, i.e., grouping nodes according to their social links, and reduces the entropy by moving nodes from one community to another using a Monte– Carlo approach to aggregate similar nodes according to their profiles according to a particular PoV. The result is another partition with less entropy i.e., the communities are more similar, semantically speaking, but with some sacrifice of modularity. Since we try to optimize two quality measures, which behave oppositely, this approach can be stated as a multi– objective optimization problem. In this case it is necessary to tune some values up to have good enough results for both measures. The overall complexity of the algorithm is linear on the number of features used to calculate the entropy, however, the baseline is given by the complexity of the complexity of the fast unfolding algorithm, i.e., the complexity if T (F U ) + T (Ent) = O (e) + O (f ), where e is the number of edges and f is the number of features. As part of the future work, it is necessary to take a deeper look into what is happening between communities when the partition configuration is changed to find out how the different communities interact. This involves not only mathematical approaches but social ones. Additionally, the development of a visual tool for aiding the analysis of the partitions changes it is being developed. R EFERENCES [1] M. Gaetler, Network Analysis: Methodological Foundations, ch. Clustering, pp. 178 – 215. Springer Berlin / Heidelberg, 2005. [2] U. Brandes, M. Gaetler, and D. Wagner, “Engineering graph clustering: Models and experimental evaluation,” Journal of Experimental Algorithmics, vol. 12, pp. 1–26, 2008. [3] M. E. J. Newman and M. Girvan, “Finding and evaluating community structure in networks,” Physical Review. E, Statistical Nonliner and Soft Matter Physics, vol. 69, p. 026113, Feb 2004. [4] M. E. Newman, “Scientific collaboration networks. ii. shortest paths, weighted networks, and centrality.,” Physical Review. E, Statistical Nonliner and Soft Matter Physics, vol. 64, p. 7, July 2001. [5] S. Fortunato, “Community detection in graphs,” Physics Reports, vol. 486, no. 3-5, pp. 75 – 174, 2010. [6] V. D. Blondel, J.-L. Guillaume, R. Lambiotte, and E. Lefebvre, “Fast unfolding of communities in large networks,” Journal of Statistical Mechanics: Theory and Experiment, vol. 2008, no. 10, p. P10008 (12pp), 2008. [7] N. Du, B. Wu, X. Pei, B. Wang, and L. Xu, “Community detection in large-scale social networks,” in WebKDD/SNA-KDD ’07: Proceedings of the 9th WebKDD and 1st SNA-KDD 2007 workshop on Web mining and social network analysis, (New York, NY, USA), pp. 16–25, ACM, 2007.
[8] C. Pizzuti, “Overlapped community detection in complex networks,” in GECCO ’09: Proceedings of the 11th Annual conference on Genetic and evolutionary computation, (New York, NY, USA), pp. 859–866, ACM, 2009. [9] M. Lipczak and E. Milios, “Agglomerative genetic algorithm for clustering in social networks,” in GECCO ’09: Proceedings of the 11th Annual conference on Genetic and evolutionary computation, (New York, NY, USA), pp. 1243–1250, ACM, 2009. [10] J. Shi and J. Malik, “Normalized cuts and image segmentation,” IEEE Transactions Pattern Analysis and Machine Intelligence, vol. 22, no. 8, pp. 888–905, 2000. [11] P. Rousseeuw, “Silhouettes: a graphical aid to the interpretation and validation of cluster analysis,” Journal of Computational and Applied Mathematics, vol. 20, no. 1, pp. 53–65, 1987. [12] H. Kwak, Y. Choi, Y.-H. Eom, H. Jeong, and S. Moon, “Mining communities in networks: a solution for consistency and its evaluation,” in IMC ’09: Proceedings of the 9th ACM SIGCOMM conference on Internet measurement conference, (New York, NY, USA), pp. 301–314, ACM, 2009. [13] S. G¨unter and H. Bunke, “Validation indices for graph clustering,” Pattern Recognition Letters, vol. 24, no. 8, pp. 1107–1113, 2003. [14] Y. Zhou, H. Cheng, and J. X. Yu, “Graph clustering based on structural/attribute similarities,” Proc. VLDB Endow., vol. 2, pp. 718–729, August 2009. [15] M. Kantardzic, Data Mining: Concepts, Models, Methods, and Algorithms. Wiley-IEEE Press, 1 ed., Oct. 2002. [16] T. Li, S. Ma, and M. Ogihara, “Entropy-based criterion in categorical clustering,” in Proceedings of the twenty-first international conference on Machine learning, ICML ’04, (New York, NY, USA), pp. 68–, ACM, 2004. [17] A. L. Traud, P. J. Mucha, and M. A. Porter, “Social structure of facebook networks.” arXiv:1102.2166, 2011. [18] J. D. Cruz, C. Bothorel, and F. Poulet, “Semantic clustering of social ´ networks using points of view,” in CORIA, pp. 175–182, Editions Universitaires d’Avignon, 2011. [19] W. M. Rand, “Objective criteria for the evaluation of clustering methods,” Journal of the American Statistical Association, vol. 66, no. 336, pp. pp. 846–850, 1971.