Detecting and Recognizing Tables in Spreadsheets Iyad Abu Doush
Department of Computer Science Yarmouk University Irbid, Jordan
[email protected]
ABSTRACT Detecting tables in a spreadsheet is the first step needed to make spreadsheet documents accessible to individuals with visual disabilities. Techniques to enable aural presentation and navigation of tables have been proposed, but they assume a thorough knowledge of the structure of the table; on the other hand, boundaries and structure of tables in a spreadsheet are not evident without a visual exploration. This paper presents an algorithm for table recognition in spreadsheets. The algorithm uses three types of cells as its basis: title cell, header cell, and data cell. Different attributes of the cells are used to identify the cell type within a spreadsheet. Hierarchical clustering is used to aggregate cells to compose the functional components of a table. The algorithm has been evaluated on a diverse set of benchmarks with very encouraging results.
Categories and Subject Descriptors K.4.2 [Social Issues]: Assistive technologies for persons with disabilities
General Terms Algorithms
Keywords Visual Impairments, Table Navigation, Spreadsheets, Table Recognition, Spreadsheet Analysis
1.
INTRODUCTION
A survey by Douglas et al. in 2007 [1] shows that one of every three working adults who are blind deals regularly with spreadsheets and databases. There is a need to give individuals who are blind and visually impaired the chance to learn applications that are used regularly in the workplace. Microsoft ExcelTM spreadsheets are frequently used in the workplace to store and analyze data. A spreadsheet can have multiple components—e.g., several tables and charts—and most of these components are distinguished through visual
Enrico Pontelli
Department of Computer Science New Mexico State University Las Cruces, NM 88003, USA
[email protected]
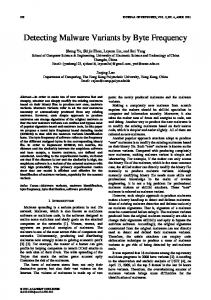
clues, such as use of background colors, borders, and location on the spreadsheet. The literature has extensively studied the problem of delivering effective presentation of 2-dimensional tables through non-visual mechanisms (e.g., aural presentation methods) (e.g., [16, 14, 3, 19]), to meet the needs of individuals with visual disabilities. Nevertheless, all these approaches rely on the basic assumption that the layout of the table, in terms of rows and columns, is explicitly defined (e.g., as in the case of an HTML document). The problem of non-visual access is compounded in the case of spreadsheets. The entire spreadsheet is composed of rows and columns of cells. Spreadsheets are used to organize the information in a tabular format. A worksheet in a spreadsheet may contain several distinct tables, and typical spreadsheet environments do not provide an explicit mechanism to identify the subsets of cells in a worksheet to be treated as a single table. Recognition of tables in a worksheet is relatively simple for a sighted individual—items like borders, background colors, fonts, empty rows/columns are commonly used to clearly mark the collection of cells representing a single table. These features are inaccessible to a visually impaired individual, thus making the identification of a table a challenging problem. Tables are an important medium for presenting information as they visualize the data and show particular relations between its contents in a compact way. Some definitions view the table as a multi-dimensional structure to represent information. Pinto et al. [15] define tables as a structure used to present a multi-dimensional dense information in a structural compact form. One of the most complete model for defining table structure has been introduced by Wang [17]. The author identifies three main sections for the structure of the table: a relation for indexing table elements, a spatial definition for table contents using header, stub or both, and a graphical representation of its contents using fonts, separators, and other formatting features. Figure 1 shows different components that may appear in a table. Several research studies (e.g., [10, 9]) have analyzed the problem of extracting knowledge from tables in a document. In order to comprehend tables in documents, two main phases are typically needed: detecting the table and recognizing the
ysis Box Driven Reasoning (BDR) method to analyze table structure, by surrounding small regions in the table with boxes. This method is capable of identifying tables with broken lines and touching edge characters.
Figure 1: Functional Structures in a Table Based on Wang [17]. functional components of the table [6]. Table detection is the problem of determining the occurrence of a table model in the document. Table recognition is the problem of analyzing a detected table to determine its different elements according to the table model (e.g., title and header). To solve the problem of table detection and recognition it is important to analyze both the language and the layout of the table. General separators (e.g., spaces, ruling lines, horizontal and vertical lines, and blank rows) in the table are used to determine the layout structure of the table. The common problems in table detection and recognition are: false detection of a non table component, detecting a non table area, giving a table functional component a wrong label, detecting several tables as one table, and detecting one table as more than one table. In this paper, we propose a novel algorithm for detecting and recognizing tables in spreadsheets. The algorithm uses similar formatting, separators detection, and hierarchical clustering to recognize different functional components of the table in a spreadsheet (i.e., table title, table headers,. . . ). The result from the detection and recognition process is used to perform a non-visual navigation of the tables by users who are blind or visually impaired.
2.
BACKGROUND
The literature on detection and recognition of tables is rich; in this section we provide a brief overview of some relevant proposals. We distinguish the proposals according to the medium used to present the table—i.e., image, text, or markup language. Tables in Images: Images that contain tables may come from many sources. For example, scanned books, reports, and forms may contain different tables. An extensive literature exists on table detection and recognition using image processing and pattern recognition. Several approaches (e.g., [21, 11, 7]) rely on the identification of separators (e.g., lines, spaces, ruling lines) to recognize the different components of the table inside the image. The use of clustering to detect table components has been suggested by other researchers (e.g., [21, 12]). The work of Hori and Doermann [4] explored the use of an image anal-
Tables in ASCII Documents: ASCII tables can be found in several types of documents (e.g., traditional email formats). A large amounts of research work has been directed towards detecting and recognizing tables in ASCII text documents. The recognition of the main components of the table is usually achieved by detecting separators (e.g., spaces and special characters). Hu et al. [8] developed a hierarchical clustering method for recognizing columns in a table, and lexical analysis for identifying the table headers. In another work, Hu et al. [5] developed a table recognition algorithm for ACII text tables using dynamic programming. The problem with this method is that sometimes it may split a table into more than one table. Pinto et al. [15] introduced an undirected graphical model, called Condition Random Fields (CRF), to extract tables and then compare them using Hidden Markov Models. ASCII text government statistical reports have been used for testing the algorithm with 92% table detection accuracy and 94% table recognition accuracy. Ng. et al. [13] developed a machine learning approach for table detection, with very good results—their system is capable of recognizing table boundaries, rows, and columns inside the text. They tested 50 text patent reports with 85%– 95% accuracy of table boundary, row, and column detection. This approach does not capture the functional components in the table (e.g., title and headers). Tables in Markup Languages: Markup languages (e.g., SGML, HTML, and LaTeX) for document description and formatting commonly offer constructs to describe the physical structure of a table. The tags represent the kind of the data and the function it represents in the table. For example, in HTML, the table grid can be defined using tags like tr and td. Separators in the table (e.g., spaces, lines) and the position of the table body or header all can be identified using tags [20]. While the presence of tags automatically solve the problem of table detection, the problem of table recognition remains open—even though markup languages provide elements and attributes to provide a description of the semantics of the table (e.g., using items like header, axis, scope), their use is not enforced. The work described in [16] illustrates the use of Hidden Markov Models to estimate the functional components of a table in an HTML document. Another problem arising in the context of HTML documents is the abuse of tables to format document components instead of encoding tabular data.
3. METHODOLOGY 3.1 Overview The attributes of the cell in a spreadsheet and its relation with the surrounding cells can be used to detect different functional component of the table. The boundary of the table is based on the density of information within closed distance cells.
Many attributes about the table layout structure, cell formatting, and the values inside the cell can be used to detect and recognize the table in a spreadsheet. The separators (e.g., empty rows, borders, cell font or background colors) can be used to differentiate between different functional components of the table. The use of pattern recognition and hierarchical clustering can be helpful in realizing the logical and physical structure of the table. The cell weight is a number that is used to attach a cell with a specific type according to a pre-defined set of conditions. Weights for different attributes are used to recognize different types of cells (i.e., data cell, title cell, and header cell) in the table. Specific thresholds are established on the weight of attributes to support the classification of a cell according to one of the three types. Cells with weight values equal or exceed their cell type threshold are labeled as one of that cell type. The algorithm used will scan the spreadsheet from the first cell in the left top corner until the last non-empty cell in the right bottom corner. During the scanning the algorithm checks for the following attributes in the cell: Figure 2: Table in a Spreadsheet as a Tree Structure
• Similar formatting (e.g., border and color) for the cells in a spreadsheet. This is an indicator for a similar table functional components (i.e., headings, columns, total row, and title). • Detection of separators (empty rows, different cells formatting, use different kinds of borders, and different cell value types). This information is used as identification of the table functional components. Accuracy of the table detection and recognition is measured by comparing the program results with the results obtained from a human annotator.
3.2 Figure 3: Components of a Table in a Spreadsheet
A table in a spreadsheet can be viewed as a collection of functional components presented in a tree structure. The assembling of the table components by the aggregation of spreadsheet cells can provide a view of the table and later on it can be used to perform a non-visual navigation on the table. For example, consider the table in figure 2; each component in the table is a collection of homogenous cells. The header “Interest Rate” spans over two cells in the spreadsheet, but it represents one component in the table (i.e., a header). Similarly, the title of the table “Financial Future Payments” is the result of the aggregation of the spreadsheet cells that represents the table title. The table in a spreadsheet contains three types of cells: header cell, data cell, and title cell. A header cell is a cell that contains a value that describes the contents of the current table column. A data cell is a cell that contains a value that is part of the table data (i.e., body of the table), data cells on the same table column usually have the same data type. A title cell is a cell that contains a value that describes the contents (or purpose) of the table.
Detection Rules for Spreadsheet Tables
A spreadsheet can be viewed as a collection of cells arranged in a 2D grid, where each cell can be uniquely identified using a specific address. Each cell in the grid has a row index, a column index, and a value, which is either a constant or it is calculated using a formula. We describe a cell in a spreadsheet using the notation C[i,j], where i and j are the row and the column indices for the spreadsheet cell. The spreadsheet cell attributes that are used in the detection and recognition algorithm are: (1) border, (2) formula, (3) format, and (4) data type. Each cell attribute in the spreadsheet has a specific value associated with that cell. The values of the attributes are explicitly available (e.g., as attributes in an OOXML file). We introduce the notation C[i,j].attribute_name to identify the value of the attribute attribute_name for the cell C[i,j]. For example, C[2,3].border.left.color can be used to identify the value of the left border color for the cell in row 2 and column 3 in the spreadsheet. The cell data type (C[i,j].type) can have the value double, string, boolean, empty, or error. A border for a spreadsheet cell (C[i,j].border) is an edge line that surrounds the cell. In turn, The cell border has the attributes direction, style, and color. The border may surround the cell in 4 different directions: top, bottom, left, and right. For example, to test if a cell has a border in a spe-
Figure 4: From Spreadsheet Cells to Tables.
cific direction we can use C[i,j].border.border_direction and the result will be either true or false. For the other two border attributes we use C[i,j].border.border_direction.style and C[i,j].border.border_direction.color to denote the style of the border line and the color of the border line, respectively. Figure 5: Stages in Table Detection and Recognition A cell format (C[i,j].format) is the visual formatting applied on the data of the cell. The following list of format attributes has been used in the algorithm: number format, font style name, font name, font size, font bold, font italic, • Stop if there is a number of empty rows within a deand font color. fined threshold. A formula for a cell is a mathematical equation used to calculate the value of the cell, and it may use values from other cells. The formula can use built-in functions in the spreadsheet or user-defined functions. In order to check if the cell contains a formula we use the notion C[i,j].formula.has, while C[i,j].formula.text denotes the actual text of the cell formula. The table detection and recognition is performed as a pipeline, in which the cells are detected orderly by cell type, in the sequence data, header, and title cell respectively (i.e., from the table bottom to the table top). This sequence is used in order to make the detection process easier in the case of multiple tables in the same worksheet. The detection of multiple tables in the same worksheet is performed by finding a separator between the two tables (usually a set of empty rows). The classification of the spreadsheet cells into title, header, and data cells using the rules mentioned before is used to aggregate the cells into table functional components (i.e., title, headers, and columns of the table). Figure 4 shows how the spreadsheet classification for a specific group of cells is used to recognize the table functional components. A futher step is a grouping of the tables in the worksheet to form multiple tables component from which the user can select which table to navigate. To detect a table in the spreadsheet the following steps are followed: • Start from the rightmost, bottom-most, non-empty cell, and add it to the table cells set (T). • Cluster these cells with the previous row. • Add these cells to the table cells set T.
The steps of the recognition of different table components is explained in figure 5. Similar cell types (i.e., title, header, or data cells) are aggregated as a table functional component (e.g., header or title). As mentioned earlier, the recognition of different cell types is performed using weight values for different attributes in order to detect the cell type. The rules for the determination of the cell type are discussed in detail in the next section. The use of weight value makes the modification for the recognition algorithm easier. Also, it is possible to relax or tighten the recognition process for different cell types by just changing the value of the cell type threshold. The use of three different cell types according to their function in the table helps in separating the recognition process concerns. The information about that cell is saved in a structure for a later use during the non-visual navigation of the table. The title cells for the table are assembled to form the text of the table title. During the identification of the data cells, the start row, end row, start column, and end column of the table are recognized and saved to be used in identifying the table boundary. In the case of header cells, the cell content is piled up to form the text of the table header. Also, the column number for that header is saved for later use in the non-visual navigation (e.g., when the user navigates a data cell in the same column, the header information can be provided as information for context reinforcement). All the detection and recognition rules have been derived from heuristic observations obtained from a group of 55 sample spreadsheet tables. The heuristic rules cover the layout of most common tables by using the sample tables as guidance. Ideas from the previous research (e.g., [21, 11, 7]) have also been incorporated.
Figure 6: Headers with Borders Example.
3.3
Rules for Different Cell Types
3.3.1
Header Cell Rules
A header cell is a cell or a group of cells above a table column, used to describe the categories in that column. Sometimes a group of header cells are merged to show that this header span across the group of cells underneath. The merged cells in the header can span horizontally or vertically during the building of the table headers. In the following example (see table 1), “Exam” is a merged cell that span in two columns. In order to add this semantic to the header information in the table the merged header cell value will be added to all the headers that span under it. In this example, the table header for the first column will be “Exam Midterm” and for the second column “Exam Final”. The header information can be used later by the user to know the category of the cell value in the same column or to browse different categories in the table.
C[i,j].font.color, and so on). Similar formatting is used usually in a spreadsheet to show a grouping of the cells. The three consecutive cells on the same row with similar format may imply that they belong to the same group of cells (i.e., headers in this context). • If C[i,j], C[i,j-1], and C[i,j+1] have any borders (i.e., C[i,j].border.left or C[i,j].border.right or C[i,j].border.top or C[i,j].border.bottom, and the same for the cells C[i,j-1] and C[i,j+1]). The border in consecutive cells is usually an indicator of semantic information embedded in the cells as a group (see fig. 6). • If C[i-1,j] is not an empty cell, C[i,j] and C[i,j+1] have a similar format, C[i,j] and C[i-1,j] do not have a similar format, and C[i,j].type is string while C[i-1,j].type is not string. This rule means that we are detecting a header cell that comes after a data cell in the table (see fig. 7). The current cell and the cell below do not have similar formats. The other indicator is the cell type which is text for the current cell (i.e., header cell) and not text for the cell below (i.e., data cell).
Table 1: A Table with Merged Cells. Exam Midterm
Final
Header cells often contain strings (i.e., text) as data type, since they usually contain a description of the table column category. Visual formatting of the cells in a spreadsheet table is usually used to embed a semantic meaning of the cells. Similar formatting (e.g., border, font color, and font style) for a group of horizontal cells which is different than the formatting of the cells in the following row (i.e., first row in the table body) can be used as an indicator of table headers in the spreadsheet. In some cases table headings are followed by an empty row. This empty row is used as a separator between the header cells and data cells in the table (i.e., separate the table headings from the table body). In some spreadsheet tables the header for one column may span over more than one cell, as a vertical stack of header cells. Other kind of headers in a spreadsheet may imply a hierarchical structure of the header. The spreadsheet cell C[i,j] is considered a header cell if one of the following is satisfied: • If C[i-1,j] is tagged previously as a header cell and C[i,j].type is string: Header cells are usually of string type because they use text to describe the category of the table column. • If C[i,j], C[i,j-1], and C[i,j+1] have the same format (i.e., C[i,j].font.size has the same value as C[i,j-1].font.size and C[i,j+1].font.size, and C[i,j].font.color is equal to C[i,j].font.color and
Figure 7: Headers Recognition Example • If a header cell has been detected in C[i-1,j] and C[i,j] and C[i-1,j] have a similar format. This rule applies to the case where adjacent cells share the same formatting and one of such cells has already been labeled as a header cell (e.g., the header spans across multiple rows). • If row i contains a cell that is tagged as a header then the cell C[i,j] is also a header cell. This rule assumes that headers usually are presented as a group on the same row. • If C[i-1,j] is not an empty cell, , C[i,j].type is string, and the format of C[i,j] is not equal to C[i1,j] format. This part of the rule uses the formatting of two consecutive cells in the same column to distinguish between header cell (i.e., C[i,j]) and data cell (i.e., C[i-1,j]). Also, C[i,j+1] is not an empty cell, C[i,j] and C[i,j+1] have a similar format. This part of the rule suggests that similar formatting between two consecutive cells in the same row as an indicator of being header cells.
3.3.2
Data Cell Rules
Identifying the data cells is based on clustering table columns, following the general principle that the elements of a column tend to share similar formatting parameters. In turn, consecutive columns are aggregated in clusters of columns that will constitute the body of the table.
Usually table columns have similar data types because the column contains data from the same category. In some cases the grouping of the data cells is implied by using similar formatting of the table cells (e.g., border, font color, and font style). Another indicator for the data cells in the table may be having a group of cells that use similar formula to calculate the cell content. For example, the same formula is used in a table column that calculates the summation of the grades for each one of the students. The spreadsheet table cell C[i,j] is considered a data cell if C[i,j], C[i-1,j], C[i+1,j] have the same type, format, and formula. We opted to ignore the border attributes in the analysis of data cells, as frequently data cells do not share common border attribute values. For example (see fig. 8), the border can be detected in the first data cell after the header as a top border (and it is the bottom border for the header cell) but it will be absent in the rest of the column.
Figure 10: Incorrect Recongition of Header as a Title. • If a title cell has been found and in the last row scanned we have detected a title cell. • If a header cell has been found, C[i,j-1] is an empty cell, C[i,j+1] is an empty cell, and j is the first column of the table (as titles usually set in the first column). For example figure 10) shows an example where the cell ”Sell This” satisfies the conditions of this rule.
3.3.4 Figure 8: A Data Cell with No Border.
3.3.3
Title Cell Rules
A table title usually forms a separate block (i.e., group of cells). The title cell is usually resides above the table headers and commonly it is in the first column of the table. It is generally of type string, providing a text describing the content of the table. In some cases the table title in a spreadsheet may span over several rows above the table headers. In this case the algorithm will cluster all the title cells in the correct order. A title cell usually does not contain any border. This attribute, on the other hand, can help in differentiating between header cells (which may contain border) and title cells. Another aspect that can be used to distinguish between header cells and title cells is that usually the left and the right cell that surrounds the title cell are empty cells. The cell C[i,j] in a spreadsheet table is considered a title cell if one of the following conditions is satisfied: • If a header cell has been found, C[i,j].type is string, and there is a set of empty rows (separator between headers and the table title) before encountering the header cell (see fig. 9).
Multi-Level Table Detection Rules
A multi-level table is a table with a main title and a group of sub-tables with each having a unique attribute (e.g., a school grades table with a group of sub-tables, each subtable is for one of the teachers in the school). In a multi-level table each sub-table may have its own title (sub-title) and its own headers—though sometimes headers will be only at the beginning of the first sub-table. Usually empty rows are used as separators between sub-tables. The following rules are used in the recognition of multi-level table: • Usually a sequence of empty rows is used as a separator between sub-tables; thus, if a small number of empty rows is found followed by a table structure then this is treated as a sub-table. • If a sequence of empty rows is followed by a sub-title (defined in the next sections) or followed by a new table body then this is a new sub-table. • If we found a table title after a sequence of empty rows then this denotes the end of the multi-level table.
3.3.5
Sub-Table Title Cell Rule
A sub-title cell is a cell that contains a value that describes the contents (or purpose) of the sub-table in a multi-level table. A sub-title cell usually appears in several places in a multi-level table, to describe the contents of each one of the sub-tables. It appears either above the sub-table body or above the sub-table headings. The attributes described in the title cell rules fits the sub-title cell but in the context of multi-level table. The cell C[i,j] in a spreadsheet table is considered a subtitle cell if one of the following is satisfied:
Figure 9: Title Recognition Example. • If the title cell is already found, the table is a sub-
Figure 12: Sample Table 1.
Figure 11: A Snapshot of a Multi-level Table. table, and title cell weight obtained is less than title threshold. • It is a sub-table, table title is not empty, and title cell weight obtained is greater than the title threshold.
4.
IMPLEMENTATION
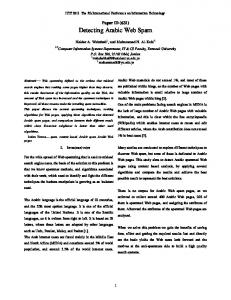
outs and from various domains. The figures 12 and 13 contains tables from the sample worksheets used in the testing. The set of sample worksheets selected contains tables with different layouts. Also, it contains worksheets with embedded charts. The collected worksheets are used to build the benchmark suite, which includes 21 worksheets with 55 tables. This collection of worksheets has been used for testing the table detection and recognition algorithm employed by the proposed system.
The system has been implemented using Visual Basic for Applications (VBA), and developed as a macro plug-in for Microsoft ExcelTM . MicrosoftTM SAPI SDK has been used for the speech synthesis. The active worksheet is scanned by the algorithm to detect and recognize different tables and their functional components. If the user selects another worksheet, then the table detection and recognition algorithm is applied to the selected worksheet. The functional components (i.e., table title and table headers) are saved and used when the user starts a non-visual navigation of table content. The system adds structural information, according to the navigation and reading mode selected by the user, and outputs the table information to the user using speech. The macro plug-in adds a new menu (assisted navigation menu) that is accessible via the keyboard to the user. The non-visual table navigation is activitated when the user selects the table navigation mode from the assisted navigation menu in ExcelTM . All the user interactions during nonvisual navigation are controlled by the user through keyboard shortcuts.
5.
RESULTS AND EVALUATION
In order to test the system with tables from different domains we used a set of ExcelTM worksheets that are posted online (e.g., sales, schools, and tax statistics worksheets). We obtained the benchmark worksheets from several web sites, such as the web sites for Excel workshops of the Chicopee Public Schools1 and the Statistics of Income Division and Other Areas of the Internal Revenue Service.2 A set from each worksheet group have been selected (e.g., from the tax worksheets of 2001 a set of 10 worksheet has been selected). We selected worksheets that have tables with different lay1 2
www.chicopee.mec.edu http://www.irs.gov/taxstats/index.html
Figure 13: Sample Table 2 The sample data set has 1737 rows and 426 columns with a total number of cells 800,259. The largest table has 154 rows and 14 columns with a total of 2156 cells. The smallest table in the test sample contains 6 rows and 4 columns. The suite contains 7 multi level tables, 3 tables with merged header cells, and 2 ExcelTM worksheets that include other components (i.e., forms, pictures, and charts). In the evaluation process, the results of the detection and recognition algorithm have been compared with manual annotations performed by a human reviewer. The detailed results from the second stage are presented in table 2. The Recall is the number of correct cells detected from the total number of correct cells and it is calculated for each cell type in the tested tables. The results show that only one table in the benchmark suite has not been properly recognized. The table whose headers have not recognized correctly has header names that are numbers under which the table values are numbers. Also, there is no special formatting or borders used that could help
Table 2: Table Detection and Recognition Algorithm on a Data Set of 55 Tables Cell Type
# of Cells
Recall
Data Cell Header Cell Title Cell
799709 440 110
100% 98% 100%
in detecting the table headers. All this make the recognition for the headers a difficult task to achieve. Although the preliminary results are very encouraging, more testing activities are in progress. One situation where we expect our methodology to fall short is the case of multi-tables with internal separators that are less than the thresholds stated in the algorithm (i.e., the number of empty rows that separate between the two tables is less than the threshold number that would detected a new table). In that case the algorithm would detect the two tables as a single table. The algorithm would not recognize tables correctly in cases where the table cells do not have any attributes or separators (e.g., a table with no borders, no font formatting, no background colors, and no empty rows that separate between headers and table title).
6.
CONCLUSIONS AND FUTURE WORK
In this paper, we presented a preliminary investigation aimed at detecting tables within an Excel spreadsheet page. The goal of the proposed solution is to identify tables and classify the functional components of each table (e.g., headers and titles). The target application of this approach is the support of alternative presentation methodologies of Excel spreadsheet for individuals with visual disabilities. The majority of the existing methodologies for the non-visual presentation of tables rely on providing aural feedback to the user as he/she navigates the table. All these methodologies assume that the functional components of the table have already been identified—this is realistic when dealing with tables described in formats like HTML or LaTeX, but not in the case of spreadsheets. In a spreadsheet, multiple tables can co-exist with the same worksheet, and their location and components are not explicitly identified. Our methodologies provide this automated identification, enabling the application of proven non-visual presentation methods to the case of Excel worksheets. The future work includes the following main activities: • We are continuing to evaluate and refine the proposed approach, with larger pools of benchmarks; we are also extending our analysis to recognize not only the functional components of a table, but also whether the table is indeed used to provide content or simply as a mechanism to format the content of the worksheet. • The methodology described is one component of a larger effort, aimed at enhancing the accessibility of Excel for individuals with visual impairments. The current research include the development of novel methodologies to provide accessibility of Excel charts and graphs.
7.
REFERENCES
[1] G. Douglas et al. The role of the who icf as a framework to interpret barriers and to inclusion. British J. Visual Impairment, 25(1):32–50, 2007. [2] D. W. Embley et al. Table-processing paradigms: a research survey. Int. J. Document Analysis and Recognition, 8:66–86, 2006. [3] R. Filepp et al. Improving the accessibility of aurally rendered HTML tables. ASSETS, ACM Press, 2002. [4] O. Hori and D. S. Doermann. Robust table-form structure analysis based on box-driven reasoning. Int. Conf Document Analysis & Recognition, 1995. [5] J. Hu et al. A system for understanding and reformulating tables. 4th ICPR Workshop on Document Analysis Systems, pp. 361–372, 2000. [6] J. Hu et al. Evaluating the performance of table processing algorithms. Int. J. Document Analysis and Recognition, 4(3):140–153, 2002. [7] J. Hu et al. Medium-independent table detection. In SPIE, volume 3967, pp. 291–302, 1999. [8] J. Hu et al. Table structure recognition and its evaluation. In SPIE, vol. 4307, pp. 44–55, 2001. [9] M. Hurst. Layout and language: An efficient algorithm for detecting text blocks based on spatial and linguistic evidence. Document Recognition and Retrieval VIII, pp. 56–67, 2001. [10] M. Hurst and S. Douglas. Layout and language: Preliminary investigations in recognizing the structure of tables. 4th. Int. Conf. Document Analysis and Recognition (ICDAR’97), pp. 1043–1047, 1997. [11] K. Itonori. Table structure recognition based on textblock arrangement andruled line position. 2nd Int. Conf. Document Analysis & Recognition, 1993. [12] T. Kieninger. Table structure recognition based on robust block segmentation. Document Recognition V, SPIE, pp. 22–32, 1998. [13] H. T. Ng et al. Learning to recognize tables in free text. 37th Annual Meeting of the ACL, 1999. [14] T. Oogane and C. Asakawa. An Interactive Method for Accessing Tables in HTML. ASSETS, ACM Press, pp. 126–128, 1998. [15] D. Pinto et al. Table extraction using conditional random fields. Annual Nat. Conf. Digital government research, pp. 1–4, 2003. [16] E. Pontelli et al. Navigation of html tables, frames, and xml fragments. ASSETS, ACM Press, 2002. [17] X. Wang. Tabular abstraction, editing, and formatting. PhD thesis, University of Waterloo, 1996. [18] Y. Wang and J. Hu. Detecting tables in html documents. In Document Analysis Systems V, pp. 609–614. 2002. [19] Y. Yesilada et al. Rendering tables in audio: the interaction of structure and reading styles. ASSETS, ACM Press, pp. 16–23, 2004. [20] R. Zanibbi et al. A survey of table recognition: Models, observations, transformations, and inferences. Int. J. Document Analysis & Recognition, 7(1), 2004. [21] K. Zuyev. Table image segmentation. 4th Int. Conf. document analysis and recognition, pp. 705–708, 1997.