Non-Visual Navigation of Tables in Spreadsheets Iyad Abu Doush and Enrico Pontelli Department of Computer Science, Yarmouk University, Irbid, Jordan
[email protected] Department of Computer Science, New Mexico State University, Las Cruces, USA
[email protected]
Abstract. This paper presents a new system for non-visual navigation of spreadsheet tables using synthesis speech. The purpose is to provide a flexible hierarchical non-visual navigation for tables in Excel. The hierarchical view of the spreadsheet contents along with the user ability to select the table provides more flexibility than current assistive technologies. The proposed system allows the user to select a table and choose between different navigation options for the navigation. The proposed approach introduces the solution in two stages: table detection and recognition and non-visual navigation of the selected table. The system is implemented as a plug-in for Microsoft Excel with an accessible interface. Key words: Accessibility, Tables, Spreadsheets, Non-Visual Navigation
1
Introduction
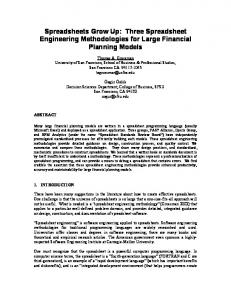
A survey in 2007 [1] shows that one of every three working adults who are blind deals regularly with spreadsheets and databases. Providing accessible information to the individuals who are blind and visually impaired will help them in having a better chance in getting a job. Also, their communications with their peers in the work place would be much easier and more effective. A spreadsheet usually contains several components (i.e., charts, tables and mathematical formulas). The common medium used for accessing such information by individuals who are blind or visually impaired is synthetic speech, Braille displays, and printed Braille. Figure 1 shows a spreadsheet in Microsoft ExcelTM . Usin a screen reader the user who is blind or visually impaired will not be able to know what components are in the worksheet (i.e., one table and one chart). Another problem is if the user wants to navigate the table. In this case the user needs to skip several rows to reach the table in the worksheet. If the current worksheet contains more than one table the navigation using the screen reader becomes more difficult and frustrating (especially if the user wants to navigate a table that is at the bottom of the worksheet). Tables are an important medium for presenting information as they visualize the data and show particular relations between its contents in a compact way
2
Lecture Notes in Computer Science: Authors’ Instructions
Fig. 1. A Spreadsheet in Microsoft ExcelTM .
[9]. Several researchers (e.g., [14, 13, 10]) developed accessible solutions for nonvisual table navigation. Most of the research work has been proposed in the context of navigation tables in the web. According to Ramloll et al. [13] the main problems of the users who are visually impaired and blind when they navigate tables using a screen reader are: – The user does not know his/her current position in the table. In the case of navigating tables in a spreadsheet this is more difficult because tables are not recognized as a separate objects and the user will not know his position according to the table boundaries. – Too much speech feedback associated with the navigation movements. The non-visual table navigation is usually performed as speech of the current cell row index, column index, and followed by the contents of the cell. These information maybe not needed for all the navigation tasks performed by the user (e.g., the user is looking for the minimum value in a table column). – Not providing the user with an abstract view of the table structure. To get a better idea about the table data users need to know the role of this piece of information in the table, the size of the table, title of the table, and the headers of the table. This paper introduces a system that provides a hierarchical view of the table structure. The user can directly access different functional components of the table (e.g., table title, table header). The information about the tabular data is rendered using synthesis speech. The system starts by detecting and recognizing tables in Microsoft ExcelTM spreadsheet. After identifying the tables in ExcelTM worksheet, the user can select a table and then the user can navigate the table or request special movement (e.g., beginning of the current row or column) inside the table. The user can ask the system to go to the position of a specific information (i.e., minimum or maximum value) in the current column.
Non-Visual Navigation of Tables in Spreadsheets
3
The results from the pilot studies conducted show that users could quickly (in less than 18 seconds) answer different questions about the table data. In addition to that, a Braille printed version of the same table navigated using the system is compared. The findings from this study shows that the time needed to answer similar questions about the tables take less time in the proposed system (i.e., using speech) than in the Braille printed version.
2
Background
Several solutions have been provided by the previous research to support recognizing tables and allow the non-visual access of tables. Due to the lack of space, we will cite only some of the relevant works in this area. 2.1
Table Detection and Recognition
To comprehend tables in documents two main phases are needed: detecting the table and recognizing functional components of the table [4, 3]. Table detection is determining the occurrences of a table model in the document [3]. Table recognition means analysis of the detected table to determine its different elements according to the table model (e.g., title and header) [3]. To solve the problem of table detection and recognition it is important to analyze both the language and layout of the table. Some researchers (e.g., [15, 6, 5]) rely on using separators (e.g., lines, spaces, ruling lines) to identify different components of the table. The use of clustering to detect table components has been performed by other researchers (e.g., [15, 7]). Pontelli et al. [11] pointed out that grouping of cells is usually introduced in tables in the form of applying similar formatting (e.g., same font color or same font style). 2.2
Non-Visual Navigation of Tables
Scanning tabular data to get an overview about the table is quite easy for sighted people. On the other hand, this is a harder task for the users who are visually impaired and blind. Gunderson and Mendelson [2] mentioned that identifying specific information inside a table is one of the most difficult tasks to be performed by the visually impaired users. Using sonification sound to give the user an overview about the table data is used by a number of researchers [13, 8]. The non speech sounds with different tones are used for table navigation. Higher pitch MIDI sound were used with larger table values. Planning and reasoning are used by other researchers to add structural information that can help the users when they navigate tables. Pontelli et al. [12] provide an intelligent agent to help users who are blind and visually impaired in getting a better mind image about complex HTML structures (e.g., tables, frames).
4
Lecture Notes in Computer Science: Authors’ Instructions
3
Methodology
Spreadsheets are used to organize the information in a tabular format. A worksheet in a spreadsheet may contain more than one table and there is no implicit recognition of these tables inside the spreadsheet application. The attributes of the cell in a spreadsheet and its relation with the surrounding cells can be used to detect different functional component of the table. The boundary of the table is based on the density of information within closed distance cells. The system allows the user to select a table to navigate. After that the navigation is applied inside the selected table and the user will not go outside the selected table boundary. The user can then select a reading mode for the table navigation according to the task s/he is interested to accomplish. Table Detection and Recognition: The table in a spreadsheet contains three types of cells: header cell, data cell, and title cell. A header cell is a cell that contains a value that describes the contents of the current table column. A data cell is a cell that contains a value that is part of the table data (i.e., body of the table). A title cell is a cell that contains a value that describes the contents (or purpose) of the table. Many attributes about the table layout structure, cell formatting, and the values inside the cell can be used to detect and recognize the table in a spreadsheet. Weights for different attributes are used to recognize different types of cells (i.e., data cell, title cell, and header cell) in the table. Cells with weight values equal or exceed their cell type threshold are labeled as one of that cell type. In order to recognize a table inside a spreadsheet analyzing different attributes of the spreadsheet cells is needed. The algorithm used will scan the spreadsheet from the first cell in the left top corner until the last non-empty cell in the right bottom corner. During the scanning the algorithm checks for the following attributes in the cell: – Similar formatting (e.g., border and color) for the cells in a spreadsheet. This is an indicator for a similar table functional components (i.e., headings, columns, total row, and title ). – Detection of separators (empty rows, different cells formatting, use different kinds of borders, and different cell value type). These information is used as identification of the table functional components. Non-Visual Navigation of Tables: The system tells the user how many tables the current worksheet has (i.e., using speech). It provides the user with a hierarchical view in which all the tables inside the current worksheet can be browsed by using the tables titles and then the user can select one of them. Using the system the user browses within the current table boundary (i.e., from the cell in the first row and first column to the cell in the last row and last column). The navigation within the boundary of the selected table can help the user in focusing more on the current table contents instead of being aware to not sliping off into another table in the spreadsheet.
Non-Visual Navigation of Tables in Spreadsheets
5
The system provides the user with two navigation modes that the user can select from: row navigation and column navigation. In row navigation mode the user can move in four directions to listen to the table values of the current table. In the column navigation the user can select a column to navigate by listening to the headers of the selected table. This type of navigation is helpful if the user is interested in browsing a specific category in the table (e.g., browse only the students grades in math). The user can switch between the two navigation modes at any time without losing the navigation context.
Fig. 2. Table Selection and Circular Navigation.
In both navigation modes (row and column) a circular navigation is applied (see figure 2) in which when the user reaches the edge cell (i.e., last cell or first cell) and move to the next cell (or previous cell in the case of the first cell) then the user will go to the next cell in the edge. The proposed table navigation system can view the table contents from different perspectives by allowing the user to select between different reading modes for the table cells. The reading modes available for the user are: cell value, cell position followed by the cell value, cell value with formula presence notification, and cell category followed by the cell value. Providing the user with a quick method to access specific information in the table reduces the search time needed when looking for this specific piece of information. The system allows the user to access the minimum or the maximum value in a column that contains numerical data.
4
Implementation
The system is implemented using Visual Basic for Applications (VBA). A macro plug-in for Microsoft ExcelTM is developed to make the spreadsheet more accessible. MicrosoftTM SAPI SDK is used for the speech synthesis. An overview
6
Lecture Notes in Computer Science: Authors’ Instructions
Fig. 3. An Outline of the Non-Visual Table Navigation System.
of the implementation of the system is shown in figure 3. The active worksheet is scanned by the algorithm to detect and recognize different tables and their functional components. If the user selects another worksheet the table detection and recognition algorithm is applied on that selected worksheet.
5
Results and Evaluation
Data Set: In order to test the system with tables from different domains we used a set of ExcelTM worksheets that are posted online (e.g., tax statistics). The set of sample worksheets contains tables with different layouts. The collected worksheets are used to build the test sample which includes 21 worksheets with 55 tables. The sample data set has 1737 rows and 426 columns with a total number of cells 800,259. The results show that one table with its headers are not detected correctly with 98% accuracy. The table that its headers are not recognized correctly has header names that are numbers under which the table values are numbers. Also, there is no special formatting or borders used that could help in detecting the table headers. Evaluation of the Non-Visual Navigation of Tables: The system is piloted in two studies. In the first study 8 sighted students (5 females and 3 males) from an introductory psychology class at NMSU use the proposed system. The age range of the subjects is from 18 to 24. In the second study 5 students who are blind (4 males and 1 female) from the New Mexico School for the Blind and Visually Impaired (NMSBVI) use the system. The age range of the subjects is from 15 to 28. In the second study the students’ class levels range from 8th grade to 12th grade and all of them are students who are blind with high cognitive abilities. The second study is conducted in two parts in the first part the student who is blind is asked to navigate the tables using the proposed system (i.e., using audio speech). In the second part the students who are blind were asked to browse one of the tables navigated in the first part but this time the table was printed using Braille. The Braille encoding used to represent the table is 2nd grade Braille. Table Navigation Using the System: In both studies conducted on users who are sighted and users who are blind three tasks were tested: browsing one table from a list of tables, browsing one table with a formula calculated cells, and
Non-Visual Navigation of Tables in Spreadsheets
7
getting specific information about the table. One extra task has been tested only on the first study (i.e., the one conducted on sighted users) which is browsing a multi-level table. The features that we investigated during the study are: the time needed to answer questions about the table, time needed to find summary information about the table, time needed to find a formula for a specific table category, the accurate identification of the formula, user accuracy when answering questions about the table, and how accurate and effective are the audio cues. First Study: From the group of 7 sighted students tested the system 63% used Microsoft ExcelTM more than twice. The system evaluation is based on exploring 3 tables in a worksheet that contains 4 tables from different domains (movie store, grocery store, and school grades). The navigation has been performed with the computer screen turned off. The results show that selecting a table from 4 different tables by listening to the tables titles takes an average time of 24 seconds. In the task of browsing one table (it has 7 rows and 7 columns) from a list of tables it takes the user an average time of 42 seconds with 88% accuracy to answer the question “what movie title has the maximum price?”, on the other hand all the students answer correctly the question “how many copies are there of the movie title X?” with an average time of 57 seconds. All students agreed that starting the non-visual table navigation was easy to do. Most of the students (88%) agreed that finding the maximum value feature in the system was helpful. The second task of table browsing is for one table (it has 14 rows and 5 columns) with a formula calculated cells. The average time to answer the question “what is the retail price for the item X?” was 49 second with 75% accuracy. When using the finding the minimum feature in the system it takes the students 30 seconds in average to answer the question “which item has the lowest profit?” with 75% correct answers. All students agreed that it was easy to learn and use the system. Many students suggests the use of a sound alert (e.g., beep) to identify that the current cell is calculated using formula instead of using the audio speech. Other students did not like some words in the speech (e.g., “you selected”) because the action is explicitly identified (e.g., the user already pressed a key to select the table). Second Study: In the second study 60% from the group of 5 students who are blind never used the Microsoft ExcelTM application. The results are based on browsing 2 tables in a worksheet that contains 3 tables from different domains (movie store, grocery store, and school grades).The findings from this study show that the average time to select a table from 3 tables and start the navigation is about 35 seconds. The first task performed is browsing one table (it has 7 rows and 3 columns) from a list of tables. All the students identify correctly the table title with an average time of 5 seconds. Answering questions about the table ( e.g., “what is the rating for the movie X?”, “What movie title has the minimum price?”) takes an average time of 16 seconds with 100% accuracy answers. When searching the
8
Lecture Notes in Computer Science: Authors’ Instructions
table to see if a movie title exist it take the students an average time of 6 seconds with all the students perfectly answer the question correctly. The second task performed is browsing a table (it has 4 rows and 7 columns) with a formula calculated cells. All the students answer correctly the question “What is the retail price for the item X?” with an average time of 36 seconds. The average time when answering the question “which item has the lowest profit?” is 50 seconds with 100% accuracy. The majority of the students (80%) agreed that the system is usable but they need more time to learn about using it. Some students recommended adding a notification to telling the user when s/he reaches the end of the table. One student suggests that the use of Braille displays with the speech system would be a better solution because the user will have his/her hands on the table (to know what the table looks like). Comparsion Between Braille and the System: In order to compare the system with a common medium used to present tables for the individuals who are blind we asked the same group of students who are blind to browse the table and then answer a set of questions about the table contents. All the students are familiar with reading Braille and they have been using it for reading for more than three years. Compared to the table presented in Braille most students who are blind like using the table speech system because it is easier to follow. On the other hand they mentioned that it “is easy to lose your place when using the printed Braille table.”. This is shown when the students answer the question, “what is the name of the movie in row 5 of the table?” using Braille with an accuracy of only 20% and an average time of 18 seconds. Many students say that the proposed system is better than Braille table because “it explains everything to you and there is no need to search for the information.”. The results between navigating the table using speech and using Braille (Figure 4) show a faster navigation average time using speech. Although the size of the navigated table was small (it has 7 rows and 3 columns), but the user could answer questions about the table data faster using the speech table system. Larger tables will increase the gap between the two lines in the chart because it will need from the user more time to comprehend the information in the table and answer the questions about it. The other thing to compare is the accuracy of the results, which is the same in this case because of the small size of the table.
6
Conclusion and Future Work
A system is proposed that detect and recognize tables in the spreadsheet along with their functional components (e.g., headers and title). The non-visual table navigation has been performed using audio speech. For the table navigation the ability to go immediately to the minimum or maximum value on the current column has given the users a fast way to go to the desired value in the table. The user can navigate the table using different navigation and reading modes according to the task they needed to accomplish.
Non-Visual Navigation of Tables in Spreadsheets
9
Fig. 4. Comparison Between Table Navigation Using the Proposed System and Braille.
In the future we could add a query answering component to the system to help the users in acquiring more information about the data represented by the spreadsheet. The system can help the user by filtering the spreadsheet data for an easier search. For example, browse only the students with a grade greater than 50 in biology course.
References 1. Graeme Douglas, Christine Corcoran, and Sue Pavey. The role of the who icf as a framework to interpret barriers and to inclusion: visually impaired people’s views and experiences of personal computers. British Journal of Visual Impairment, 25(1):32–50, 2007. 2. Jon Gunderson and R. Mendelson. Usability of world wide web browsers by persons with visual impairments. In In Proceedings of the RESNA Annual Conf., 1997. 3. J. Hu, R.S. Kashi, D. Lopresti, and G.T. Wilfong. Evaluating the performance of table processing algorithms. International Journal on Document Analysis and Recognition, 4(3):140–153, 2002. 4. Jianying Hu, Ramanujan Kashi, Daniel Lopresti, , and Gordon Wilfong. A system for understanding and reformulating tables. In Fourth ICPR Workshop on Document Analysis Systems (DAS’2000), pages 361–372, Rio De Janeiro, Barazil,, 2000. 5. Jianying Hu, Ramanujan S. Kashi, Daniel P. Lopresti, and Gordon Wilfong. Medium-independent table detection. In Proc. SPIE, volume 3967, pages 291– 302, 1999. 6. Katsuhiko Itonori. Table structure recognition based on textblock arrangement andruled line position. In Proceedings of the Second International Conference on Document Analysis and Recognition, pages 765–768, Tsukuba Science City, Japan, 1993. 7. Thomas Kieninger. Table structure recognition based on robust block segmentation. In In Proc. Document Recognition V, SPIE, pages 22–32, 1998. 8. Johan Kildal and Stephen A. Brewster. Providing a size-independent overview of non-visual tables. In in 12th International Conference on Auditory Display (ICAD2006), pages 8–15, Queen Mary, University of London, 2006.
10
Lecture Notes in Computer Science: Authors’ Instructions
9. David Pinto, Andrew McCallum, Xing Wei, and W. Bruce Croft. Table extraction using conditional random fields. In Proceedings of the 2003 annual national conference on Digital government research, pages 1 – 4, Boston, MA, 2003. 10. Enrico Pontelli, Douglas J. Gillan, Gopal Gupta, Arthur I. Karshmer, Emad Saad, and W. Xiong. Intelligent non-visual navigation of complex html structures. Universal Access in the Information Society, 2(1):56–69, 2002. 11. Enrico Pontelli, Douglas J. Gillan, W. Xiong, Emad Saad, Gopal Gupta, and Arthur I. Karshmer. Navigation of html tables, frames, and xml fragments. In Proceedings of the fifth international ACM conference on Assistive technologies, pages 25 – 32, Edinburgh, Scotland, 2002. 12. Enrico Pontelli, Tran Cao Son, Keshav Reddy Kottapally, Co Thai Ngo, Ravikumar Reddy Kotthuru, and Douglas J. Gillan. A system for automatic structure discovery and reasoning-based navigation of the web. Interacting with Computers, 16(3):451, 2004. 13. Rameshsharma Ramloll, Stephen Brewster, Wai Yu, and Beate Riedel. Using nonspeech sounds to improve access to 2d tabular numerical information for visually impaired users. In In Proceedings of BCS IHM-HCI 2001, pages 515–530, 2001. 14. John H. Shamilian, Henry S. Baird, and Thomas L. Wood. A retargetable table reader. In Proceedings of the 4th International Conference on Document Analysis and Recognition (ICDAR ), pages 158 – 163, 1997. 15. Konstantin Zuyev. Table image segmentation. In In: Proceedings of the 4th international conference on document analysis and recognition, page 705 708, Ulm, Germany, 1997.