Detecting Malicious Logins in Enterprise Networks Using Visualization Hossein Siadati∗
Bahador Saket †
Nasir Memon‡
New York University
Georgia Institute of Technology
New York University
A BSTRACT Enterprise networks have been a frequent target of data breaches and sabotage. In a widely used method, attackers establish a foothold in the target network by compromising a single computer or account. They then move laterally between computers to access valuable resources and information located deeper inside the network. To move laterally, attackers often steal valid user credentials. This paper is based on the observation that an attackers’ pattern of access characteristics of the stolen credentials in the form of deviates from benign patterns and can be used to detect malicious logins. In this paper, we present APTHunter1 , a visualization tool that helps security analysts to explore login data for discovering patterns and detecting malicious logins. To evaluate the proposed system, a pilot study was conducted over an open dataset of more than one billion logins of an enterprise network, provided by Los Alamos National Lab (LANL). Using APTHunter, security analysts (unfamiliar with the dataset) were able to detect 349 of 749 malicious logins related to lateral movements performed by a Red Team during a penetration test conducted at LANL. APT-Hunter is currently deployed in a global financial company and helps security analysts detect account compromises. Index Terms: K.6.1 [Visualization, APT, Login, Security]; K.7.m [Attack]—Alert 1
I NTRODUCTION
Numerous enterprise networks have been hacked in recent years [25]. Famous cases including JPMorgan Chase [19], Target [14], Home Depot [28], and Sony Pictures [7] have resulted in significant damages. The common theme of these incidents is that attackers start by compromising a single computer or account to establish a foothold in the network. The attackers then escalates privileges, pivot the attack towards other computers, and move between them to find crown jewels (the most valuable assets) located deeper inside the network. The movements between computers and the escalation of privileges are referred to as lateral movement. To compromise the next computer in the path of the lateral movement, attackers frequently steal user credentials (e.g., password, authentication token). Using valid credentials to move laterally across the network is stealthy (cannot be detected by anti-malware and IDS), persistent (credentials can be used to come back to network anytime even after clean-ups by anti-malware), and scalable (multiple computers can be accessed by stealing a single credential) in comparison with exploiting vulnerabilities of the computers. For these reasons, as Rob Joyce —the head of the NSA’s TAO group (Tailored Access Operations)— states: ∗ e-mail:
[email protected]
† e-mail:
[email protected] ‡ e-mail:
[email protected]
1 APT
stands for Advanced Persistent Threat.
“Zero-day vulnerabilities are overrated, and credential stealing is how he [the attacker] gets into networks.” [20] Traditional security tools mainly work based on prevention and detection of exploits (e.g., sequences of commands sent to a remote computer to compromise it). Lateral movement using stolen credentials does not create suspicious network traffic or system calls on the destination computer. Consequently, these tools can not detect this widely used method of the lateral movement. Methods used for classification of malicious logins to websites, such as [10], can not address the problem of credential based lateral movements effectively. This is mainly due to the large variation among types of accounts and roles of computers, assignment of multiple accounts to individuals, activities of several accounts on one computer, and network and business dynamics that make login events inside enterprise networks more complex and variable than user logins to online services. This paper is based on the observation that an attacker’s usage of stolen credentials might differ from the expected login behaviors of a credential in terms of: • Access Characteristic. For example, an attacker may use a stolen credential to log in from a desktop to another desktop, as opposed to a server, a valid but rarely expected login in most enterprise network. • Time. For example, the attacker may be located in a different time-zone and use the credentials when the actual user is not usually active. • Frequency. For example, attackers may connect to destination(s) more often than expected. • Login Result. For example a login failure may happen because the stolen credential is not authorised to login to the destination due to an access rule unknown to the attacker. Hence, deviations from expected login (i.e., benign login) behavior can signify an attack. While attackers can avoid being detected by using stolen credentials cautiously (e.g., using the credentials less frequently, at the time that credential is usually active), some suspicious login behaviors are inevitable. This is because (I) an attacker needs to move between computers to access more valuable resources located deeper in the network, and (II) he can only use one of the already compromised computers to move to the new ones. Hence these inevitable login deviations can potentially be used to detect subtle lateral movements. Security Information and Event Management systems (SIEM) are widely deployed in enterprise networks and collect a myriad of relevant login information to aid detection. However, effective detection of malicious logins by such systems alone is difficult for two reasons: 1. Variability of login events: Network anomaly detection is challenged by variability of network traffic [24]. Similarly, the process of automatically detecting logins abnormalities based on the changes in access characteristics () of
c 2016 IEEE 978-1-5090-1605-1/16/$31.00
logins is hindered by variability of login events. For example, a new domain controller in a network is a new destination of logins from hundreds of computers. Without the required background knowledge about this change in the network, these new logins may create an unmanageable number of false alerts. Variability of logins are also related to the role of the users, computers, and business needs of the organization. The need for integrating the background knowledge about the rules governing the login between computers (which is network-specific) with the detection system demands keeping security analysts in the loop. 2. Lack of an appropriate presentation method: Even if a security analyst is in the loop, the process of discovering login patterns is hindered by a lack of appropriate methods to present the collected login information to the analyst. Many existing systems show collected login information using tables where each row shows a user login and each column indicates different characteristics of the login (e.g., username, source and destination of the login, time, result of login). While using tables is a good first step toward visualizing such data, exploration and detection of malicious logins using tables is non-trivial since a combination of different user attributes (e.g., type of user, department, unit, role) and computer attributes (e.g., type of machine, location) need to be considered. As the number of collected data increases, the size of the tables also increases and it becomes more challenging to explore login events using a tabular presentation. In this paper, we present APT-Hunter, a visualization tool that helps security analysts integrate their knowledge about the organization and the network to discover malicious login events in an enterprise network. To achieve this goal, security analysts iteratively discover suspicious and benign login patterns with the help of an interactive node-link visualization tool. In order to increase the flexibility of the pattern discovery process, APT-Hunter is equipped with a rule-based language that enables analysts to assign the discovered patterns into two classes of suspicious and benign rules. Based on defined patterns, APT-Hunter then matches and tags suspicious and benign patterns in the login events. As a result of this matching, the system generates a list of alerts (i.e., suspicious logins). Analysts are then able to verify suspicious logins by performing a deeper analysis and positively identify malicious logins. The rest of the paper is organized as follows. Background is given in Section 2. In Section 3 we describe design guidelines, an example usage scenario, and internals of the APT-Hunter. In Section 4, we evaluate the efficacy of this visualization tool for detecting lateral movements. We review the related work in Section 5. Finally, we discuss limitations and future work, and then conclude the paper. 2
BACKGROUND
In this section, we discuss background required to better understand the threat model and scenario of attacks. Advanced Persistent Threats. Advanced Persistent Threats (APT) are targeted cyber attacks against organizations and companies. Most resources that are of value to attackers are not directly exposed to an external network. It is rather a lengthy journey to try different approaches persistently in a long span of time (from few months to a few years) to get access to such resources. The security community has recognised that credential stealing is the most frequently used technique in APT attacks [4, 20, 9]; The Target customers’ massive data stealing in 2013 was carried by hackers stealing the login credentials of the company’s HVAC vendor [14], the JPMorgan Chase data breach in 2014 began after the attackers stole the login credentials of a JPMorgan employee [19], the Home Depot data breach in 2014 started by stealing a password from a vendor [28], and the Sony Pictures’ network compromise in late 2014 began by hacker(s) physically breaking into site and stealing computer credentials of a system administrator [7]. Most of the
companies had security monitoring tools including anti-malware, Firewall, and Intrusion Detection Systems (IDS). However, because of the stolen credentials, the attackers were able to bypass these tools to complete their missions. Therefore, credential stealing has become the favorite method of attackers. Credential Stealing. Almost any collaboration between hosts in a network (e.g., file sharing, screen sharing, application access) requires user authentication. Windows networks mostly use NTLM [15] and Kerberos [17] to authenticate the users and processes. A process in the client machine starts the authentication procedure by providing a user entered password, to the authenticator process in the destination machine (or the Key Distribution Center (KDC) in the Kerberos protocol). After the first successful authentication, and in order to avoid requesting the password from users again, the client machine will receive a token (e.g., the cryptographic hash, Tickets) to use for further communications. Credential stealing is easier than it is perceived. The most desired type of credentials that the attackers look for is plaintext passwords because (1) they expire or get updated infrequently, (2) they are re-used by users for multiple accounts, and (3) they can be used by attackers to guess other passwords. Attackers may try one of a few methods to find the plain text passwords, including phishing, online password guessing (e.g., brute-forcing frequently used passwords), Offline password cracking, and password dumping. In an offline password cracking, the attackers use hash-cracking methods to find the plain text password related to a captured hash of a password. Attackers get access to the hash of the passwords using different methods including running a rogue service (e.g., Domain Controller) to get other computers to send authentication requests including hashes of the passwords. Password cracking has become incredibly fast [3]. Password dumping is one of the main methods to capture more important credentials. By accessing the memory of the compromised computers using tools such as Mimikatz[16], the attackers will be able to read the plain text password after user enters them into the computer. This method is able to capture the password of a user who uses Windows remote interactive login (i.e., Remote Desktop) to access an infected computer. Keylogger Malware is another means of capturing plain text credentials whenever an attached keyboard is used for password entry. If the attackers fail to gain access to plaintext password, they can still authenticate themselves on the destination computer using pass-the-hash method [26]. This method exploits the fact that authentications in the network are often done using the tokens delivered to the client after initial authentication. These tokens, in the form of Hash (in NTLM protocol) or Ticket (in Kerberos) can be reused by attackers to connect to destination computer. In the case of Kerberos, one type of Ticket (i.e., Ticket Granting Ticket) can be used to issue other forms of Tickets usable to login to destination computers. Pass-the-hash method is not always persistent because the hash/tickets expire after a defined period of time (in the order of hours). 3
APT-H UNTER
Anti-malware and IDS are not able to detect attackers that use valid credentials to move laterally. As a result, we have developed the APT-Hunter to aid with detection of login-based lateral movements. APT-Hunter is a visualization tool that helps the security analysts detect malicious login events inside an enterprise network. The key idea used is that the graph of logins between computers follows patterns that are understood by security analysts who have designed or operated the systems and network that they are monitoring. Our visualization tool enables security analysts to integrate this knowledge into the detection system in the form of rules that define login patterns. These patterns include both logins that are expected to be seen (benign), and those that are conceptually prohibited (suspi-
2016 IEEE SYMPOSIUM ON VISUALIZATION FOR CYBER SECURITY (VIZSEC)
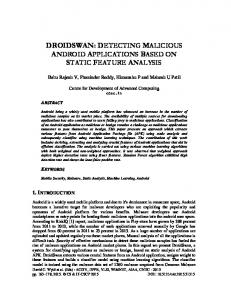
Figure 1: The APT-Hunter user interface consists of a Search, Filter, Alert, Visualizer and a Details panel. The Search panel support searching login events. The Filter panel supports filtering login events. The Alert panel shows alerts generated by the system. The Visualizer panel visualizes the login data using a node-link diagram. The Details panel indicates details of logins.
cious). In this section, we discuss the design guidelines and an usage scenario for APT-Hunter. We also detail the user interface and back-end of the system. 3.1
Design Guidelines
We identify the design guidelines for a visualization tool that helps security analysts to detect malicious logins in enterprise networks. G I: Enhance the recognition of login patterns. Inspired by previous work [8, 5] tools developed for monitoring login events should ease the recognition of suspicious and benign patterns using appropriate visual representations. G II: Enable expressing and matching login patterns. To decrease the effort required to recognize suspicious and benign login events, the system should allow analysts to express the rules of interest permanently (e.g., login events from a specific source should be recognized as suspicious). So, the next time that the system recognizes such patterns it will automatically label them as suspicious or benign without requiring analysts interference. G III: Enable selection and filtering of login events. To facilitate the data exploration process for a large number of login events, the system should allow analysts to select (i.e., query) and filter a specific subsets of login events based on their desired criteria. 3.2
Usage Scenario
In this section, we motivate the design of our system and illustrate the functionality via a usage scenario of real deployment in an enterprise network.
Assume that Walter2 is a security analyst responsible for detecting malicious logins using APT-Hunter. The user interface of APTHunter that helps Walter to do this task is shown in Figure 1. We detail one iteration of tasks for finding suspicious logins. Search. Upon loading the latest login data, the system will show a node-link visualization of collected logins. Since the number of logins is very large, Walter decides to start by working on a subset of important logins. That is, he decides to see the login to/from a number of critical servers hosting an important application. He does so by searching the application from a dropdown menu from the search panel of the APT-Hunter. Other criteria for search include name or type of user and computers, location and result of the login, and the date interval (see Search in Figure 1). Exploration and Rule Creation. The result of Walter’s search is shown in the Visualizer panel using a node-link visualization. In this visualization, nodes represent computers, links show login from one computer to another one, and line endings show the direction of the login (see Visualizer in Figure 1). Further details about the logins are represented by icons, text, or placement of elements. For example, type of computers (e.g., desktop, database, domain controller) is presented using different icons in the graph, names of the computers and users are shown as text next to the nodes and edges of the login graph, and geolocation information about computers is presented by placement of all the computers in the same location next to each other grouped by a colored canvas. It is optional to see some of these layers of details. Moreover, by selecting specific nodes or links in the Visu2 Walter
is a warden [22]
2016 IEEE SYMPOSIUM ON VISUALIZATION FOR CYBER SECURITY (VIZSEC)
(a) Analyst visits the details of computers and users related to a login.
(b) Analyst adds a rule (suspicious or benign) to the system.
(c) By adding a pattern of benign logins, matching logins are identified and shown in the user interface.
(d) Analysts can filter logins based on different criteria (e.g., benign) to see a subset of logins of interest.
(e) Analysts can see data from different views include geolocation. Computers in the same location are shown in one canvas.
(f) By adding a suspicious login pattern, the system matches and visualizes the instances of the malicious attack with a different color. Alert(s) also will be listed in Alerts table.
Figure 2: This figure shows a series of screenshots based on the deployment of the system in an enterprise network. The screenshots show the usage of the APT-Hunter for pattern discovery and malicious login detection. The details of users and computers are being anonymized for security reasons. The node in the center represents a server hosting an application, and the computer with a “globe” icon is a web-proxy.
2016 IEEE SYMPOSIUM ON VISUALIZATION FOR CYBER SECURITY (VIZSEC)
alizer panel, Walter would be able to see their details in the Details panel (see Figure 2a). By exploring logins and different layers of details, Walter discovers some benign and suspicious logins: Discovering a benign login pattern: By exploring logins, Walter notices that a subset of these logins are related to staffs from a specific office that should be able to use the specified application. Since they are using their own computers to connect to these server, and are allowed to use this application as part of their duties, Walter assumes that these logins are harmless. This conclusion is based on his background knowledge about the system and what is presented by APT-Hunter. Walter decides to define this type of login as a benign patterns. To do this, Walter selects one of these logins by clicking on the link between two nodes. He then clicks on the Add rule option in the Action panel. The application recommends potential rule in text format using a dialog box (See Figure 2b). Walter can edit the rule to adjust the right level of generalization. He is also able to make the rule that defines the pattern stricter by specifying the time (e.g., weekday vs. weekends), maximum allowed login failure or account lockout, and frequency of logins. Rules are composed of pairs of attribute-values with a comparison operator between them. The grammar of rules is similar to Snort [21] and is easy to learn. As soon as the rule is added to the system, APT-Hunter tags all matching logins of this type as benign. These logins are presented with a different color indicating that they are benign logins (See Figure 2c). Discovering a suspicious login pattern: While exploring the login events further, Walter filters out benign logins by choosing options from the Filter panel. By doing this, he can stay focused on logins that might be suspicious (See Figure 2d). He observes that an admin account has connected to the web-proxy from the server. Based on his knowledge about the logic of the network communication in this enterprise network and role of the servers, he can not find any legitimate reason for the server to login to the web-proxy. He concludes that this login is potentially related to an instance of data exfiltration by an attacker. Therefore, he decides to look further into this incident. He creates a new login pattern to tag the similar suspicious login incidents by using the Add rule from Actions. By defining this rule, the APT-Hunter’s rule engine will tag and generate an alert for each login incident matching this pattern. The edges of the node-link graph related to the login will be marked by a red color indicating the suspicious login (see Figure 2f). The alerts will also be shown in the Alerts table. Alert Verification. Alerts generated by APT-Hunter signify suspicious logins and need to be verified further for assurance. The outcome of the verification of an alert may indicate a compromised account (e.g., stolen password), an account abuse (e.g., an admin account used for running a scheduled process instead of using a service account), or a false alarm. For verifying the alerts, Walter utilizes the user interface to study the details of logins and search the login events to/from nodes connected to the potentially infected computer. 3.3 The APT-Hunter Interface Design Figure 1 shows the user interface of APT-Hunter. It is composed of Search, Filter, Visualizer, Details, and Alert panels. In this section, we detail these elements and their functionality. Search. The APT-Hunter user interface supports searching login events (design guideline G III) based on different criteria. The criteria include application (servers hosting the applications in the enterprise network), computer, and user name. More general search can be done based on computers and user type (e.g., domain controller and database server; admin and help-desk users). Visualizer. The login data is mainly composed of source and destination computers and users that login from one to the other. The Visualizer panel visualizes this data using an interactive node-link
New Login Login History Computer Attributes
Login Processor and Aggregator
Pattern Matcher
Tagged Login
User Attributes
Rules
Figure 3: The pipeline architecture of backend of the APT-Hunter. The inputs of the system are login events, details of computers and users, and rules (i.e., patterns) defined by operators. The output is the tagged login events identifying benign/suspicious logins.
diagram. In this visualization, nodes represent computers, and links show login events from the sources to the destinations. User can interact with nodes to locate them in the screen or to see more details about them. Some details about computers and logins are encoded using icon and color of the nodes and links. Icons of the nodes show the type and role (e.g., web-server, domain controller) of the computers. The color of the link shows if it is a suspicious login. In addition, geolocation of the nodes are shown by placement of all the computers in the same location next to each other grouped by a colored canvas (see Figure 2e). The visualizer enables recognition of login patterns and abnormalities (G I). Login Details. Login events include details of logins that are presented as itemized text. These details include frequency of login, average number of days in a week that a source logins to the destination, number of users that login from a source to a destination, and number of login failures and lock-out of an account. The Details panel provides this information for recognition of patterns (G I). Alert List. APT-Hunter generates alerts by finding login events that match the defined suspicious login patterns. The list of alerts is presented in tabular format. The alerts are sorted in descending order of the number of alerts for the username involved in the alert. Each row of the table shows the source, destination, and user related to the alert. For the sake of verification, a “details” link for each alert links the alert to the visualization of all logins of the user involved in the suspicious login. The status of the investigation can be updated using a drop-down list that appears in front of each login event (G II). 3.4
APT-Hunter Back-end Engine
In this section, we present the back-end engine of the APT-Hunter. The backend has two components: Login Processor & Aggregator, and Pattern Matcher. These components are organized based on a pipeline architecture as shown in the Figure 3. The input of the back-end includes login information, details about users and computers, and user defined rules (i.e., login pattern). Its output is the list of the login events tagged based on the matched patterns. 3.4.1
Login Processor & Aggregator
The inputs of this component are login events in the network, information about type and role of computers (e.g., workstation, server, database server), their location, and information about type (e.g., admin, service account, normal user), and role (e.g., HR hierarchy) of users. Login events include source, destination, user, type, login result (i.e., success, failure), and date/time. The login information for each day are processed to generate a summary of the number of logins per-day. The login data is also aggregated with computer and user information. This component compares the login events with history of logins (e.g., logins in the past three month) to spot the login changes. Changes in the login events can be one of the 4 different types: (a) Source Change, (b) Destination Change, (c) User Change (d)
2016 IEEE SYMPOSIUM ON VISUALIZATION FOR CYBER SECURITY (VIZSEC)
Net Flows data logs. The dataset contains 1.05 billion logins of about 12,000 users and 18,000 computers. The dataset also contains labeled login event related to a simulated attack by a Red Team. The total number of malicious logins was 749 involved 305 unique computers and used 98 different compromised accounts. 4.3
Data Processing procedure
We processed the data before loading it into APT-Hunter. For this, we partitioned the logins into days and computed the summary of logins (i.e., triple of and the count) per day. We use the login events that happen more than 10% of the days to form a model that helps with tracking the changes in the network structure. Since we did not have any detail about the role of the computer and users, we used some heuristics to identify the type of computers. For this, we labeled computers that are frequent destination of logins as “global-server”, ’local-server’, and others as “desktop”. The data was made ready to be loaded to the APT-Hunter. Figure 4: White bars show the number of logins per day related to lateral movements of the Red Team (penetration test) in the LANL dataset. Black bars show the number of detected malicious logins by APT-Hunter. Overall, 349 out of 749 malicious logins were detected. The false positive rate is 0.005%. and Source&Destination&User Change. For example, a login with “Destination Change” is recognized when a user login to a computer that he has not logged into before (in comparison with the history of logins) from a computer that he has used before. By marking the changes in the login events, this component enables pattern matching based on the changes of the logins. The processed and aggregated login data is used for login visualization as well as pattern matching. 3.4.2 Pattern Matcher This component loads, parses, and executes the login rules that are defined by operators of the system. The inputs of this system are rules and login events. The output of this component is the set of annotated events for each login which indicates whether the login matches any benign/suspicious login pattern. The rules are expressed in a grammar similar to Snort [21]. For example, the following rule generates an alert for an event of login from a desktop to another desktop by a non-admin user3 : h*i RULE_TYPE = ALERT; SRCM_T = DESKTOP USER_T = NORMAL ->DESTM_T = DESKTOP ; LOGIN-TYPE = NETWORK 4 E VALUATION We conducted a pilot study to assess the effectiveness of APTHunter for helping security analysts in detecting malicious logins. 4.1 Participants and Setting Two security analysts (1 male, 1 female) aged 22-30 participated in our study. Both analysts were from the same financial company and familiar with the concept of anomalous logins. They were unfamiliar with the dataset used in this study. 4.2 Dataset used in the study We used the publicly available dataset “Comprehensive, MultiSource Cyber-Security Events” [13, 12] released by Los Alamos National Laboratory. This dataset represents 58 consecutive days of anonymized event data collected from five sources within Los Alamos National Laboratory’s corporate, internal computer network. The dataset includes Authentication, Processes, DNS, and 3 This
might be a suspicious login in an enterprise network because logins of non-admin users are expected to be from desktops to servers.
4.4
Study Procedure
At the beginning of the experiment, the participants were briefed about the goal of the study. The participants were then trained for 30 minutes to use different features of the system. We then asked them to load the dataset into the APT-Hunter with the goal of detecting the attacks. We did not time-limit the process of discovering malicious login. The overall study was done during the course of 3 days a few hours each, since the analysts had full-time jobs during the day. 4.5
Study Results and Discussion
APT-Hunter performs best when the rule discovery is done by analysts who are familiar with the role of computers and users of an enterprise network. The security analysts in this experiment were not familiar with the network of LANL. However, using the visualization tool, they were able to discover login patterns that were similar to the patterns that they see in their network (at their full-time job) with a bit of customization. For example, desktop-to-desktop logins are considered as inappropriate login events in many enterprise network. They noticed similar patterns in the LANL dataset. They added rules defining these patterns (both suspicious and benign) to APT-Hunter. By applying these rules to the system, APT-Hunter started generating alerts. The dataset used in this study contains 749 malicious logins that happened during 30 days. Two security analysts were able to detect 349 of these 749 malicious logins using APT-Hunter. Figure 4 shows the number of malicious logins detected by APTHunter per-day. The average number of false positives per day was 593 logins (0.005% of all the logins). Integrating knowledge about the specific structure of network, and role of computers and users of LANL, using their security analysts, would further improve the detection rate and decreases false positives. This observation is supported by the results obtained from deployment of the system in an enterprise where the security analysts did know their network, as described in Section 6. Both participants found the rule-based engine feature of the system helpful since it eased the gradual filtering of the benign logins. By defining a pattern of a benign login, the system matched all the logins and filtered the similar ones. This decreased the search space of the malicious logins for the participants dramatically. Additionally, this decreased the density of the node-link visualization by removing benign logins from the network. In some cases after detecting suspicious logins, security analyst needed to contact the account owners to verify the suspicious login. In the existing version of the APT-Hunter, this requires the analysts to go through the process of verification by manually sending emails to the account owners. One of the suggestions of the analysts
2016 IEEE SYMPOSIUM ON VISUALIZATION FOR CYBER SECURITY (VIZSEC)
was to automate this process by preparing emails with the details of logins to be sent to the owner of the accounts. 5
R ELATED W ORK
In this section, we list some of the related work both from the domains of security and visualization. Implicit Authentication. Credentials are prone to guessing/stealing and therefore are not sufficient for authentication of critical operations (e.g., password rest). Freeman et al. [10] have demonstrated the effectiveness of using a supervised statistical method for implicit authentication (i.e., reinforced authentication) using different features, including IP address, geolocation, operating system and browser configuration, and the account’s patterns of usage. The main intuition is that users usually use certain IP addresses and computers to connect to a websites. As a result, probability of a malicious login can be computed based on observed features. Similar methods are used by online service providers for user authentication. These approaches are not applicable for the problem addressed in this paper. Firstly, dynamics of the network configuration, computer roles, and user role and duties make the login behaviors in the enterprise networks more variable than the user’s login to online services. Secondly, each pair of computers in an enterprise network can authenticate to one other and needs to be validated. In comparison, only logins to servers are validated in online services. Finally, labeled data is not available for supervised learning in this work. Shi et al. [23] have proposed a method for mobile authenticating by computing an authentication score based on a user’s activities. The score is boosted upon observing consistent behaviors (e.g., buying coffee in the same store) and is lowered upon observing inconsistent (e.g., calling an unknown number) or suspicious behaviors (e.g., events commonly associated with abuse or device theft). This method is limited to the cases where the device is stolen by an attacker and an aggregation of suspicious behaviors is observed. In comparison, the scenario of concern in this work is related to the account compromise where the account is used by normal user and the attacker at the same time, and therefore will not be detectable by this approach. Network Data Visualization. Computer networks are very active, and the volume of log data generated based on the host and network activities is huge. Network data comes from different sources including Firewalls, IDS, DNS, and proxies. Other source of network data includes logs generated on workstations and servers, including anti-malware alerts, processes, registries, and Windows login events. Having a good perception of the network events is crucial for security analysts to identify security problems. However, the volume and variety of data (often referred to as being “hairballs”) as well as the complexity of the relation between events in the network make it challenging to present these data in their original text format or tabular format [11]. Therefore, different visualization techniques are being proposed and used for the purpose of attack detection and forensics. Abdullah et al. [1] have proposed a histogram-based visualization technique that visualizes the summary of requests to/from different ports. The X-axis shows the time and Y-axis shows stacked size of packets sent to each port. This visualization helps to detect connection to abnormal ports, port scanning, and excessive traffic to/from ports. Overall, this approach is useful when an attack shows statistics significantly different from the normal behaviors. In comparison, APT-Hunter is able to detects individual malicious logins even if they don’t cause a change in the login statistics. Ball et al. [6] have implemented a network security visualization tool that allows admins to explore communication between internal and external machines. For this, they use two grids of cells each presenting an IP address inside or outside the network. By select-
ing a cell from internal IP plate (an internal computer), all the the cells in the external IP plate that have communicated with this IP are highlighted (selection of external IPs is possible). This presentation is suitable to detect infected internal machines or external IP addresses attacking the network. In comparison, APT-Hunter is designed to maximize the pattern discovery by presenting data with a node-link graph and encoding different attributes of the computers and users into the user interface. Nyarok et al. [18] have developed visualization techniques including a graph-based visualization that represents a node under attack and the other nodes communicating with it. The main goal of this forensics tool is to enable a better understanding of an attack and the scale of its effects required for post-actions. In comparison, APT-Hunter facilitates pattern discovery and detection and represents a more complex graph of nodes and information encoding. Xiao et. al [29] have proposed a system that allows users to visualize the network traffic and iteratively extract patterns from the visualized data and express it using the first-order logic. Their tool is useful for detecting bulky attacks such as brute-force or network scanning. However, it is not suitable for representing the complexities concerned with the network of logins and attributes of the computers and users for dealing with the subtlety of the lateral movements. In comparison with the visualization tools listed in this section, the proposed visualization tool uses login event data for detecting lateral movement. To the best of our knowledge, we are the first to use visualization to tackle this problem. 6
D ISCUSSION
APT-Hunter is an ongoing project for visualization of login events with the goal of aiding the security analysts to detect malicious logins. In this section, we discuss our observations from the deployment of this system in a financial company. This aids in discussing other usages of such a system. We also describe our plans for further improvements. APT-Hunter was deployed in a financial company with 7,000 computers and 5,000 user/computer accounts. A number of security analysts of the company used APT-Hunter regularly to detect malicious logins. They used the system iteratively for exploring logins, defining patterns, and verifying alerts. We were able to observe how the APT-Hunter helped them to achieve their goals and received feedback on how to improve the system. We observed that the security analysts of the company are using the APT-Hunter mainly for monitoring and detecting malicious logins. In some cases, the analysts reported that APT-Hunter was able to detect attacks that other security products including antimalware, NetFlow-based detections, and network analytical tools were unable to detect. In fact, these attacks used compromised accounts to jump between computers and did not exhibit characteristics detectable by other tools. We also observed that the analysts used the APT-Hunter to identify the account misuses. For example, according to the principle of least privilege [27], an admin account should not be used for running a scheduled task (a limited service account should be used instead). In this case, the APT-Hunter was able to detect if an admin account was used a service account. This helped the enterprise to better enforce the security policies and recommendations of best practices for using credentials. Finally we noticed that APT-Hunter was used for network integration monitoring. It often happens that big companies acquire smaller ones. Integrations of the two enterprise network should be done with care since the infections in small networks that are not maintained well can break into the larger enterprise network. APTHunter was used to define the policies governing the gradual integration of one network to the enterprise network and helped monitor the process in order to avoid security risks.
2016 IEEE SYMPOSIUM ON VISUALIZATION FOR CYBER SECURITY (VIZSEC)
We received several comments from analysts for further improvements of the APT-Hunter. One possibility is adopting machine learning techniques to improve the rule recommendation feature. For example, the system could learn patterns of frequent logins and suggest new rules accordingly. Additionally, the system could learn from the user feedback over time. For example, after verifying the alerts by analysts, the system will be able to rank the alerts based on their importance. 7
L IMITATIONS
AND
F UTURE W ORK
Due to practical limitation of conducting such an evaluation study (recruiting expert security analysts), our evaluation study involved only two participants. Although results of our study with these two participants showed effectiveness of the APT-Hunter, in future, we plan to conduct an evaluation with a larger pool of participants. A strong adversary who knows the “access characteristics” and detection rules defined for the APT-Hunter might move laterally over the links that are considered as “benign” according to the APTHunter. While the current version of our tool delays the moves of such attacker (by shrinking his choices of destination computers in a malicious login), it can not detect them. Another possible improvement is to advance the detection process by adding more sources of information such as process names on both source and destination machines. Another venue of improvement could be providing a more flexible user interface for alert verification. Security analysts often need to put different pieces of evidence together to decide correctness of an alert. Previous work indicated how space was used by people as a means to organize the information, as well as structure their analytic process [2]. In our case, it might be extremely helpful to have a workbook that allows them to add evidences and explore them would be helpful. The current version of APT-Hunter requires knowledge about the computers (e.g., location) and the users (e.g., type of the user) to be able to visualize the network of logins and facilitate discovery of the login patterns. Although many enterprises have part of such information readily available and use them for other purposes including human resource and network management, it is more desirable if the system can discover such attributes automatically. It would be an interesting follow-up work to design algorithms for this purpose. 8
C ONCLUSION
Visualization is useful for helping security analysts to discover and integrate the organization’s knowledge into the detection systems. By designing and implementing APT-Hunter, we demonstrated the efficacy of such system in detecting malicious login, a common method for the most dreadful type of attacks. R EFERENCES [1] K. Abdullah, C. Lee, G. Conti, and J. A. Copeland. Visualizing network data for intrusion detection. In IAW, pages 100–108. IEEE, 2005. [2] C. Andrews, A. Endert, and C. North. Space to think: Large highresolution displays for sensemaking. In SIGCHI, CHI ’10, pages 55– 64, New York, NY, USA, 2010. ACM. [3] arstechnica. 25-gpu cluster cracks every standard windows password in