MUTON: Detecting Malicious Nodes in Disruption-Tolerant Networks Yanzhi Ren∗ , Mooi Choo Chuah †, Jie Yang∗, Yingying Chen∗ of ECE, Stevens Institute of Technology † Dept. of CSE, Lehigh University Castle Point on Hudson, Hoboken, NJ 07030 Bethlehem, PA 18015 {yren2, jyang, yingying.chen}@stevens.edu
[email protected]
∗ Dept.
Abstract—The Disruption Tolerant Networks (DTNs) are vulnerable to insider attacks, in which the legitimate nodes are compromised and the adversary modifies the delivery metrics of the node to launch harmful attacks in the networks. The traditional detection approaches of secure routing protocols can not address such kind of insider attacks in DTNs. In this paper, we propose a mutual correlation detection scheme (MUTON) for addressing these insider attacks. MUTON takes into consideration of the transitive property when calculating the packet delivery probability of each node and correlates the information collected from other nodes. We evaluated our approach through extensive simulations using both Random Way Point and Zebranet mobility models. Our results show that MUTON can detect insider attacks efficiently with high detection rate and low false positive rate.
I. I NTRODUCTION Ad hoc networks can be easily deployed because they do not require fixed network infrastructures such as base stations or routers. Due to its self-organizing nature, an ad hoc network can be formed in real-time with only the participating nodes perform packet forwarding. Thus, ad hoc networks are flexible and can provide mission critical services in emergency applications and battlefield scenarios. However, in practice, due to high node mobility, low node dentisy, and short radio ranges, traditional ad hoc routing protocols do not work well as end-toend paths may not always exist. For instance, nodes are sparsely connected in tactical fields, and search and rescue missions. To address this issue, the Disruption Tolerant Network (DTN) concept [1] is introduced, which uses a store-and-forward approach to deal with such challenging networking scenarios. In DTNs, nodes store packets if they cannot find a next-hop node to deliver them to destinations. The routing protocols in DTN, e.g., MaxProp [2] and Prophet [3], require each node first stores packets in its memory and then selectively transmits packets when it encounters other nodes based on various metrics including the numbers of previous encounters, the last encounter time, and the estimated packet delivery probability values to other nodes. Such metrics are derived from information broadcasted by other nodes. However, in DTN, it is hard to verify the trustworthiness of these information due to the network sparseness as well as the intermittent
connectivity between nodes. Further, the portability of modern devices makes them tempting targets for thefts. Moreover, authenticated devices in chaotic battlefield environments are also likely to be captured by the enemy. Thus, it is easy for an adversary to compromise nodes within the network and launch insider attacks using the compromised nodes. Insider attacks can cause significant problems in networks. For instance, a black hole attack [4] can be launched using compromised nodes. In a black hole attack, the compromised nodes can become malicious by partially or entirely dropping data packets while participating correctly in the routing process. Further, the malicious nodes can use faked packet delivery probability to increase their chances of being selected as the next hop nodes and attract more data packets from other nearby nodes. Most of the current work focus on securing routing protocols [5], [6]. However, they cannot address insider attacks launched by compromised nodes. Recently, a ferry based detection method (FBIDM) [7] is proposed to detect malicious nodes and mitigate insider attacks by using a trusted examiner, ferry node. However, they did not consider the transitive property when calculating the delivery probability, which is an important property reflecting the encountering of nodes in DTNs. In this paper, we propose a mutual correlation detection scheme (MUTON) which also uses the ferry node, but takes into consideration of the transitive property and correlates the information collected from other nodes. In MUTON, each node will collect the packet delivery probabilitiess of any node that it encounters with and the past encounter history of that node. The collected information is used for estimating the changes in the delivery probabilities to other nodes due to the transivity property. During the detection process, when the ferry encounters a node, instead of cross-checking the delivery probabilities reported between a pair of nodes as in FBIDM, MUTON uses a self-examination approach: it is sufficient for the ferry to only examine the node itself based on its recorded information of other nodes and then compare the calculated packet delivery probability to the claimed probability by the node to determine the sanity of the node. The advantage of MUTON is that it can detect malicious nodes more efficiently and effectively when utilizing the transitive property in DTN
routing protocols. To evaluate the effectiveness of MUTON, we conducted simulation experiments using a 40-node network where the nodes run a representative routing protool PROPHET. We tested with different node densities and different movement patterns. Comparing with the FBIDM scheme in [7], MUTON can achieve a 50% lower false positive rate, and can detect malicious nodes faster. The rest of the paper is organized as follows. Section II discusses the related research. In Section III, we provide an overview of PROPHET routing protocol and the attack model that we considered in our work. In Section IV, we describe the MUTON detection scheme. We present simulation evaluation of MUTON in Section V. Finally, we conclude our work in Section VI.
A. Overview of PROPHET PROPHET [3] is a routing protocol proposed for DTNs, which uses history of node encounters and transitivity. In this probabilistic routing scheme, a probabilistic metric P (a, b) called delivery probability is established at each node a for each known destination node b. This metric indicates how likely it is that the node a could deliver a message to the destination node b. A node will forward the data to another node it encounters if that node has a higher delivery probability to the destination than itself. In PROPHET, three equations are used to update the delivery probability values: The node a will update its metric whenever it encounters with another node b using Equation (1): P (a, b) = P (a, b)old + (1 − P (a, b)old ) × α.
II. R ELATED W ORK
(1)
where α is an initialization constant which is set to 0.75. If a pair of nodes a and b do not encounter each other for a time period, node a would update its delivery probability to node b using Equation (2):
There are few reasearches that address attacks launched from compromised nodes within a network. [8] attempted to address the survivability problem of the routing service when selective dropping attacks were launched. They used trusted nodes to monitor their neighbors. However, this method did not work well in DTNs where the network can be so sparse that there were not enough neighbors to act as the monitoring nodes. [9], [10] required that each node overheard all traffic of its neighbors and then compared the values it observed with some metrics to detect the abnormal behaviors. This method required nodes to be in promiscuous mode and process all overheard packets, and thus it can be energy consuming. Futher, in sparse networks nodes might not hear its neighbor’s transmission due to insufficient transmission power. The work that is most closely related to ours is [7]. [7] proposed a solution of intrusion detection in sparsely connected ad hoc networks by introducing a monitoring node called ferry. The ferry traveled in the networks and validated the packet delivery propobabilty of each node based on cross-examination of pairs of nodes. However, the transitive property in the routing protocols was not considered in their approach, which could happen frequently even in sparse networks. Our work is different from [7] in that MUTON correlates the packet delivery probability of nodes based on the transitive property, and thus examining information stored at each individual node is sufficient to detect malicious nodes. In this approach, the ferry does not need to store any node information.
P (a, b) = P (a, b)old × γ k
(2)
where γ is the aging constant which is set to 0.98. In addition, the delivery probability also has a transitive property: when node a encounters node b, which encountered node c previously, node a will update its delivery probability to node c based on the delivery probabilitis of P (a, c) and P (b, c) using Equation 3: P (a,c)=P (a,c)old +(1−P (a,c)old )×P (a,b)×P (b,c)×β
(3)
where β is a scaling constant that controls the impact the transitivity value has on the delivery predictability and is set to 0.25. The PROPHET routing protocol is used in our simulation to evaluate the performance of MUTON. B. Attack Model In this work, we consider the following attack model: a number of nodes in the network are compromised by adversaries. Once compromised, these nodes will maliciously affect the normal data delivery in the network by attracting more packets as the next hop delivery node and then dropping packets. To disguise its malicious behavior, a compromised node uses on and off periods to perform attacks, which is more advanced than the continuous attacks in [7]. During the period of on, the compromised node will attack other nodes by declaring a higher random packet delivery probability to those nodes, which is larger than a threshold P τ . For instance, the compromised node a can randomly choose a delivery probability of P (a, b) greater than P τ = 0.75 to attack node b by lying P (a, b) to other nodes. Whereas during the period of off, the compromised node behaves honestly and uses its true packet delivery probability. The on and off periods are adjustable parameters.
III. BACKGROUND AND THE ATTACK M ODEL In this section, we first provide an overview of the PROPHET routing protocol, which we used in our simulation to evaluate our proposed approach. We then present our attack model. 2
E0
E1
L
Em −1
Em
L
EN
Notation Em
Current Time
t0
Description
t
t1
TE1
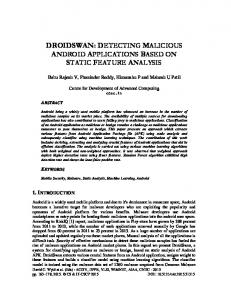
Fig. 1.
TEm−1
tm
TEm
TEN
tdiff
t0 t tm T Em m P (i, j)E bef ore Em P (i, j)af ter beacontime P (i, j)DET P (i, j)T IT α, β, γ tdif f
The timeline of MUTON
——————————————————————————————— Find out the encounter events of Node i from the most recent encountering time up to now : E1 , E2 , E3 , . . . , EN ; for (m = 1; m threshold The ferry would list node i as the suspicious node. end if ———————————————————————————————
Fig. 2.
Node i’s encounter events from nodes i and j’s most recent encountering time up to now. The time when E0 ended. Current time. Time interval between Em−1 and Em . Duration of Em . P (i, j) just before Em .
Notations used in MUTON
regular node knows how to decipher. This can be done by having the ferry encrypt the message using its own private key. This message can be decrypted by the regular nodes since they know the public key of the ferry. In the mean time, each node records the encounter information with its encountering node and collects the packet delivery probabilities of that node and of the other nodes that the the encountering node previously encountered. When a node receives the inquiry message from the ferry, it will share these information with the ferry secretly. The ferry then derives the correlated information to estimate the delivery probability value, and compares the estimated value to the value claimed by the node itself to determine the sanity of the node. There are three tables generated at each node to store the related information, namely Delivery Encounter Table (DET), Delivery Probability Table (DPT), and Transitive Information Table (TIT). MUTON inherited the DET and DPT tables from FBIDM and created the TIT table to record the transitive information. DET: In this table, a node i will record the information of the last three encounters with each of the other nodes (e.g., node j). Each encounter information includes the time when node i encountered with node j, the time and the delivery probability when node i departed with node j. DPT: A node i keeps the current delivery probability values declared by itself to other nodes in this table. TIT: A node i stores the latest delivery probabilities of other nodes when node i encounters with them. Specifically, the TIT of node i only records those delivery probabilities from the nodes it encounters with that can indirectly change node i’s delivery probabilities between node i and other nodes by using the transitive updating in PROPHET. For example, the delivery probability P (i, j) between node i and node j stored in node i may get affected when node i encounters with node k:
Pseudo code of MUTON.
Such actions will increase the chance of a compromised node being selected as the next hop node for relaying packets to the nodes that are being attacked (e.g., node b). Once selected as the next hop node, the compromised node will drop certain percentage (e.g., 50%) of the data it receives from other nodes and undermine the normal data delivery process in the network. IV. D ETECTION M ETHOD A. Previous Method In [7], the authors proposed FBIDM method for detecting malicious nodes in sparsely connected ad hoc networks. They introduced a monitoring node which was called the ferry into the networks of interest. The ferry traveled via a fixed route and correlated the information collected from all the nodes to identify potential malicious nodes in a network. They demonstrated that their method was effective in a sparse network where the nodes run the PROPHET routing protocols [3]. However, they did not consider the transitive updating property of the PROPHET scheme, which happens frequently even in sparse networks. As a result, the delivery metrics of the normal nodes were affected, and consequently resulted in a high false positive rate when using FBIDM. B. Proposed MUTON Overview: As in the FBIDM scheme, our MUTON scheme also uses the ferry node to perform the intrusion detection function in sparse ad hoc networks. At every beacon time, the ferry which travels along a fixed route as in [7] broadcasts a secret inquiry message that each
P (i,j)=P (i,j)old +(1−P (i,j)old )×P (i,k)×P (k,j)×β.
3
(4)
If the value of P (i, j) changes by more than a threshold τ: (5) P (i, j) − P (i, j)old > τ,
i; P (jm , j)T IT is the delivery probability P (j m , j), which node jm tells node i when they encounter, this is obtained from the TIT of node i. The duration of the encountering event E m is denoted by T Em in the pseudo code. Step 3: Let m = m + 1 and repeat Step 2 for the next encountering event E m+1 until m = N . Step 4: The ferry estimates the delivery probability P (i, j)estimate by utilizing the delivery probability just N after the last encounter event E N : P (i, j)E af ter which is obtained from Step 2 and Step 3:
the TIT of node i will record P (k, j). This strategy guarantees that TIT only records those information that are "useful" during the transitive updating. Detection Steps: When a node i receives the secret inquiry message from the ferry, it will send its DET, DPT and TIT tables to the ferry to perform node examination for malicious node detection. Instead of conducting cross-checking of the delivery probabilities between two nodes as in FBIDM, when examining a node, MUTON makes use of the correlations inherited from consecutive encountering events between nodes during the detection process and concludes the sanity of the node based on the information on that node only. We next walk through the detection steps, giving details on how the ferry computes P (i, j) for detection purposes. Figure 1 is an example of the timeline for the encounter events. The pseudo code of MUTON is displayed in Figure 2 and its corresponding notation is summarized in Figure 3. Step 1: The ferry starts the examination of node i by finding the most recent encountering event E 0 which ended at time t0 between node i and node j from node i’s DET. From the DET table, the ferry can also get the delivery probability between node i and node j, 0 P (i, j)E af ter , when node i departs from node j in E 0 . The ferry then searches node i’s DET and TIT to find out the encountering events between node i and other nodes that happened between time t 0 and the current time t. We note that in each of these events the delivery probability between node i and node j may be changed by the transitive updating. Assume that there are N such events. The ferry lists these events chronologically and denotes them as E1 , E2 , E3 , . . . ,EN . Suppose that for an encountering event E m with m ∈ {1, 2, 3, ..., N }, node i encounters with node j m . Step 2: The ferry correlates these consecutive events m to compute both the delivery probability P (i, j) E bef ore between node i and node j just before the encountering event Em as below: E
m−1 tm /beacontime m P (i, j)E . bef ore = P (i, j)af ter × γ
tdif f /beacontime N P (i, j)estimate = P (i, j)E (8) af ter × γ
with tdif f denotes the time interval between just after the last encountering event E N and the current time t. Finally, the ferry compares P (i, j) estimate with the P (i, j) declared by node i in its DPT to perform detection. In particular, if the difference between them is larger than a threshold, the ferry will list node i as a suspicious node. Further, if node i has been listed as a suspicious node more than certain times (e.g., three times), the ferry will declare it as a malicious node. V. S IMULATION E VALUATION In this section, we first describe our simulation methodology and metrics that we use to evaluate our method. We then present the simulation results of detecting malicious nodes. A. Simulation Methodology 1) Simulation setup: To evaluate the effectiveness of our proposed scheme, we conducted simulations for both the MUTON scheme proposed in this paper and the FBIDM scheme proposed in [7] by using NS-2. In our simulation setup, we randomly deployed 40 nodes in a square area. The transmission range of each node is set to be 250 meters. During each experimental run, we randomly selected 10 pairs of nodes and set a constant bit rate (CBR) connection for each pair. For the CBR, the packet rate is 1 packet per second. The packet size is 512 bytes and the buffer size at each node is 600 messages. In our simulation, we chose two different movement patterns, the random way point model (RWP) with the maximum speed of 5 meters per second and the pause time of 10 seconds, and the Zebranet mobility model [9]. The ferry will travel in the environment with the speed of 20 meters per second via the fixed route. Each CBR connection will generate data in the first 3000 seconds and the simulation time is set to be 10000 seconds. We set the first 1000 seconds as the warm up time. To evaluate the performance of MUTON under different node densities and different movement patterns of the nodes, we tested using the following three simulation scenarios: (1) 40 nodes randomly deployed in a 3000 by 3000 meters square area with the RWP mobility model;
(6)
m And then the delivery probability P (i, j) E af ter between node i and node j just after the encountering event E m can be obtained by: m =(1−P (i,j)Em P (i,j)E )×P (i,jm )DET ×P (jm ,j)T IT ×β af ter bef ore m +P (i,j)E bef ore .
(7)
Here, tm is the time interval between the two encountering events Em−1 and Em ; beacontime is the time interval of each beacon period; P (i, j m )DET is the delivery probability P (i, j m ) when node i departs with node jm , which is obtained from the DET of node 4
(2) 40 nodes randomly deployed in a 2000 by 2000 meters square area with the RWP mobility model; and (3) 40 nodes randomly deployed in a 3000 by 3000 meters square area with the Zebranet mobility model. For each scenario, we study the impact of the percentage of compromised nodes in the network by varying the number of compromised nodes from 4 to 12 among those 40 nodes. The compromised nodes start to conduct attacks in the network after the warm up period. Both the on and off periods are set to 250 seconds. The packet delivery probability threshold P τ for the compromised nodes is set to 0.75. The simulation results for each scenario are the average results of 50 experimental runs. 2) Metrics: We use the following metrics to evaluate the efficiency and effectiveness of the detection schemes: (a) average detection time: it measures the average time for successfully detecting each malicious node. This metric shows the efficiency of the detection schemes; (b) false positive rate: it is the percentage of legitimate nodes that are mistakenly detected as the malicious nodes; and (c) detection ratio: it is defined as the percentage of malicious nodes that are detected by detection schemes. The false positive rate and the detection ratio show the effectiveness of the detection schemes.
nodes grows from 4 to 12, which is about 100 seconds shorter than the FBIDM. The percentage improvement of the detection time of MUTON is also about 7% under the Zebranet mobility model. From Figure 4 (a) and (c) we can also find out that the average detection time of MUTON in Zebranet is longer than in the Random Way Point. This is because in the Zebranet mobility model, the nodes move faster and their movements are more chaotic. Therefore, there are more events where the nodes use the transitivity property. Since in our implementation, the ferry delays making any detection decision if the ferry finds that a node (e.g., node a) has updated its delivery probability (e.g., P (a, b)) via more than two different nodes (e.g., node c and d) to the same node (e.g., node b) using the transitivity property during the same encounter duration. Thus, it takes longer for the ferry to detect an attack in the Zebranet model. 2) The effectiveness of the scheme: We further study the effectiveness of MUTON in terms of detection ratio and false positive rate. Figure 5 presents the simulation results of false positive rate versus the number of malicious nodes between MUTON and FBIDM methods under three different scenarios. From Figure 5 (a), we observed that MUTON can achieve a lower false positive rate than FBIDM: the false positive rate of MUTON is around 1% to 2%, however it is about 3% in FBIDM. Note that even with the transitive property in PROPHET, MUTON has better performance in terms of false positive rate. Figure 5 (b) shows the comparison of false positive rate under scenario 2 when the network is denser. Similar to scenario 1, we found that the false positive rate of MUTON is lower than that of FBIDM. Specifically, it is around 3% to 4% as the number of malicious nodes grows from 4 to 12 for MUTON. However, for FBIDM, it is about 10% to 12% for all the number of malicious nodes. In addition, we observed that the overall false positive rate in scenario 2 is higher than that in scenario 1. The reason is that when the network becomes denser, the probability that the ferry encounters with the nodes increases: the ferry performs sanity check of the nodes more frequently than that in scenario 1. As a result, the false positive rate increases. Figure 5 (c) shows the simulation results of scenario 3, in which the Zebranet mobility model is used. We observed that MUTON achieves 0% false positive rate, whereas it is about 3% for FBIDM. This is encouraging as it indicates that MUTON can effectively reduce the false positive rate consistently across different mobility models. Moreover, we found that the false positive rate in Zebranet is lower than that in RWP for MUTON. This is because the speed of the node movement in Zebranet is faster than that in RWP: the frequency that two nodes encounter increases so that the MUTON can make a more accurate estimation in Zebranet than that in RWP. Finally, we studied the detection ratio versus the
B. Simulation Results and Analysis 1) The efficiency of the scheme: Figure 4 presents the comparison of the average detection time versus number of malicious nodes between MUTON and FBIDM methods under three different scenarios. In Figure 4 (a), we observed that the average detection time of malicious node in MUTON is between 1200 seconds and 1400 seconds as the number of malicious nodes increases from 4 to 12, while the detection time of FBIDM is between 1300 seconds and 1500 seconds. Thus, MUTON reduces the average detection time by 7%, which is about 100 seconds shorter than the FBIDM. With an increasing node density in Figure 4 (b), we found that the average detection time of MUTON is around 650 seconds, whereas the average detection time of FBIDM is about 700 seconds. MUTON achieves about 7% improvement of shorter detection time (about 50 seconds) than FBIDM. Compared to the average detection time in scenario 1, the results in scenario 2 are much shorter. This is because the probability that the ferry encounters with each node increases when the network becomes denser. The encouraging observation is that MUTON has achieved similar percentage of improvement in reducing detection time with different network densities. Moreover, Figure 4 (c) presents the simulation results of scenario 3, in which we used the Zebranet mobility model. We observed that the average detection time of MUTON is shorter than that of FBIDM, around 1350 seconds to 1500 seconds as the number of malicious 5
1800
1600
1600
1400 1200 1000 800 600 MUTON FBIDM
400 200 0 4
2000 1800 MUTON FBIDM
Average detection time (sec)
2000
1800
Average detection time (sec)
Average detection time (sec)
2000
1400 1200 1000 800 600 400 200
5
6
7 8 9 10 Number of malicious nodes
11
0 4
12
(a) Scenario 1: 3000 by 3000, RWP
Fig. 4.
6
7 8 9 10 Number of malicious nodes
800 600 MUTON FBIDM
400
11
0 4
12
5
6
7 8 9 10 Number of malicious nodes
11
12
(c) Scenario 3: 3000 by 3000, Zebranet
0.15 MUTON FBIDM
MUTON FBIDM
0.05
False positive
0.1
False positive
0.1
False positive
0.1
0.05
7 8 9 10 Number of malicious nodes
11
12
(a) Scenario 1: 3000 by 3000, RWP
Fig. 5.
1000
(b) Scenario 2: 2000 by 2000, RWP
MUTON FBIDM
6
1200
200 5
0.15
5
1400
Detection time versus number of malicious nodes under three different scenarios.
0.15
0 4
1600
0 4
0.05
5
6
7 8 9 10 Number of malicious nodes
11
(b) Scenario 2: 2000 by 2000, RWP
12
0 4
5
6
7 8 9 10 Number of malicious nodes
11
12
(c) Scenario 3: 3000 by 3000, Zebranet
False positive rate versus number of malicious nodes under three different scenarios.
number of malicious nodes for both MUTON as well as FBIDM under the scenario 1, 2, and 3. We found that MUTON can achieve almost the same detection ratio as FBIDM, and the detection ratio is higher than 95% for various number of malicious nodes. In scenario 2 and 3, we observed that both MUTON and FBIDM can achieve detection ratio of 100%. In general, the detection ratios in scenario 2 and 3 are higher than that in scenario 1. This is because when the network becomes denser, the probability that the ferry encounters with the malicious nodes also increases. Moreover, when comparing scenario 1 with scenario 3, we found that the detection ratio of MUTON in Zebranet is higher than that in RWP. This is because the speed of the node movement in Zebranet is faster than in RWP, which results in higher encountering frequency of two nodes and consequently MUTON could conduct a more accurate examination in Zebranet than in RWP. This is inline with our analysis for lower false positive rate in Zebranet than that in RWP.
same detection rate, MUTON can achieve lower false positive rate and reduce the detection time of malicious nodes, comparing to the traditional detection methods. R EFERENCES [1] S. Farrell and V.Cahill, Delay and Disruption Tolerant Networking. Artech House, 2006. [2] J.Burgess, B.Gallagher, D.Jensen, and B.N.Levine, “Maxprop: Routing for vehicle-based disruption-tolerant networking,” in Proceedings of IEEE Infocom, April 2006. [3] A. Lindgren, A. Doria, and O. Schelen, “Probabilistic routing in intermittently connected networks,” in Mobile Computing and Communications Review, 2003. [4] S.Ramaswamy, H. Fu, M. Sreekantaradhya, J. Dixon, and K. Nygard, “Prevention of cooperative black hole attack in wireless ad hoc networks,” in Proceedings of the 2003 International Conference on Wireless Networks, 2003. [5] Y.-C. Hu, D. B. Johnson, and A. Perrig, “SEAD: Secure efficient distance vector routing for mobilewireless ad hoc networks,” in Proceedings of IEEE 4th Workshop on Mobile Computing Systems and Applicatoins, June 2002. [6] A. Perrig, R. Canetti, D. Song, and J. D. Tygar, “Efficient and secure source authentication for multicast,” in Network and Distributed System Security(NDSS) Syposium, Feb 2001. [7] M. Chuah, P. Yang, and J. Han, “A ferry-based intrusion detection scheme for sparsely connected adhoc networks,” in Proceedings of first workshop on security for emerging ubiquotous computing, 2007. [8] S. Marti, T.J.Giuli, K. Lai, and M. Baker, “Mitigating routing misbehavior in mobile ad hoc networks,” in 6th ACM International Conference in Mobile Computing and Networks, Augest 2000. [9] Y. Wang, S. Jain, M. Martonosi, and K. Fall, “Erasure coding based routing for opportunistic networks,” in Proceeding of Sigcomm WDTN Workshop, Augest 2005. [10] Y.Huang and W.Lee, “A cooperative intrusion detection system for ad hoc networks,” in Proceedings of 1st ACM Workshop on Security of Ad Hoc Networks, 2003.
VI. C ONCLUSION To detect the compromised nodes in DisruptionTolerant Networks (DTN), we proposed MUTON, a mutual correlation detection scheme, which utilizes the correlation between consecutive node encountering events to examine the data delivery probability between nodes. We show that by considering the transitive property in DTN routing protocols, MUTON can effectively detect malicious nodes and mitigate the negative impact on data delivery in DTNs. Our extensive simulation under different mobility models demonstrates that given the 6