http://homepages.lboro.ac.uk/â¼elkk/Site/Testbed data.html. The paper is ... running the BackTrack operating system, using an Atheros wireless card with ...
Detecting Misbehaviour in WiFi Using Multi-Layer Metric Data Fusion Konstantinos G. Kyriakopoulos, Francisco J. Aparicio-Navarro, David J. Parish Department of Electronic and Electrical Engineering Loughborough University, Loughborough, LE11 3TU, U.K. e-mail: {elkk, elfja2, d.j.parish}@lboro.ac.uk. Abstract—One of the main problems in open wireless networks is the inability of authenticating the identity of a wireless client or Access Point (AP). This issue is a concern because, a malicious entity could masquerade as the legal AP and entice a wireless client to establish a connection with a Rogue AP. Previous work by the authors has developed the algorithms used in this work but, in contrast to prior work, there was no analysis or experimentation with Rogue AP attacks. Our purpose in this work is to detect injection type of Rogue AP activity by identifying whether a frame is genuinely transmitted by the legal AP or not. To this end, an identity profile for the legal AP is built by fusing multi-layer metrics, using the DempsterShafer algorithm. The results show high detection results with low false alarms for detecting Rogue AP attacks without requiring configuration from an administrator. Index Terms—Rogue AP, Cross-layer measurements, data fusion, Dempster-Shafer, Wi-Fi
I. I NTRODUCTION
I
N recent years, wireless communication has become ubiquitous and is currently the most convenient way of accessing the Internet for millions of people worldwide. The broadcast nature of wireless networks makes them inherently less secure compared to wired networks. Wireless connectivity provides numerous advantages compared to wired networks such as mobility, flexibility, and remote access. However, they are also posing serious vulnerabilities in the wireless network protocol, particularly in the Physical (PHY) and Medium Access Control (MAC) Layers. Due to these vulnerabilities, wireless users are exposed to an increasing number of sophisticated, easy to launch attacks with the goal of financial gain or private information retrieval. One of the main security issues in open wireless networks is the inability of authentication between an Access Point (AP) and its clients. Authentication schemes, such as Extensible Authentication Protocol (EAP), are focusing on closed network environments, like organisations and companies, but are not appropriate solution for open public networks, such as hotspots in airports or coffee shops. In the latter case, the number and identity of clients change dynamically and can not be either predetermined or preconfigured as this would harm flexibility and convenience to users. The inability of authenticating the identity of a wireless user is a concern because, a malicious entity could masquerade The authors would like to acknowledge the support of EPSRC in funding this work.
itself as the legal AP enticing wireless users to establish a connection and then hijacking the communication link between the users and the Internet. This type of attack is known as a “Rogue AP” (RAP) attack and allows the attacker to breach the security of the client’s communication to the Internet. Most of the Industry solutions addressing this problem are analysing the wireless side traffic gathering statistics from signal strength values in control and management frames received by the wireless client to help detect and localise RAPs. In contrast, the academia has mostly focused on the wired side techniques based on temporal traffic characteristics [1]. The authors in [1] are considering that the ultimate goal of detection schemes would be based on an irrefutable device identification mechanism through the collection and analysis of intrinsic traffic characteristics. In other words the identification process should be based on attributes and characteristics that are not dependent on the reported identity, such as MAC address [2]. However, there are several drawbacks associated with the above solutions. The ones that are based on the wireless side either focus on just one layer of observation (e.g. MAC layer) or use a limited number of metrics without intelligently combining the knowledge derived from each metric. On the other hand, the solutions that only consider the wired side, do not take advantage of the PHY and MAC layer information of WLANs [1], [2]. To address the above shortcomings, our proposed work is using metrics from the PHY up to the Network layers, in a synergistic manner. The power of multiple metrics is harnessed by using the Dempster-Shafer (D-S) as a belief fusion algorithm. Previous work by the authors [3], [4] has described the algorithms used throughout this paper but, in contrast to prior work, there was no analysis or experimentation with Rogue AP attacks as is the focus in this work. The advantage of our approach in comparison to conventional methods is that by using multi-layer measurements on a frame-by-frame basis, the attack can be detected at the instance it is actually launched. In contrast, other techniques, such as [5], are based on counting the number of malicious frames and when this surpasses a threshold, an alarm is triggered. There are two problems associated with such conventional methods. First, an attacker might be aware of such detection techniques and cunningly control the number of injected frames per time interval. And secondly, such approach allows for the malicious
frames to reach the victim until the threshold is exceeded [6]. The contribution of this work is: • Use of data fusion on multiple metrics from multi-layers to detect injection type of RAP attacks. • Evaluation of methodology using data from a real IEEE 802.11 network under RAP attack. • The evaluation of the results is based on Detection Rate (DR), False Positive (FP), False Negatives (FN) and average time to complete the detection since the attack took place. • Analysis of experiments using two methodologies for assigning the beliefs in the D-S algorithm. • We make available the utilised measurement datasets for researchers to compare results at http://homepages.lboro.ac.uk/∼elkk/Site/Testbed data.html The paper is organised as follows. A description of the theoretical background on D-S and the associated belief assignment schemes are presented in Section II. A description and implementation of the Rogue AP attack and the testbed where the experiments took place are presented in Sections III-A and III-B respectively. The procedure of our methodology is presented in Section III-C. In Section IV are discussed the attack experiment results, which are analysed with different versions of our algorithms. Finally, conclusions and future work are given in Section V. II. T HEORETICAL BACKGROUND Data fusion can be defined as the process of collecting information from multiple and heterogeneous sources, and combining them toward obtaining a more accurate final result [7]. There exist different mechanisms for the purpose of data fusion, such as D-S, Bayesian Theory, and Principle Component Analysis. The D-S theory of evidence is a good candidate for this purpose because it does not require a priori knowledge of the system, and provides the ability of managing uncertainty. In contrast, Bayesian inference requires a priori knowledge and does not allow allocation of probability to ignorance but only to an event being normal or abnormal [8]. D-S theory has been previously used in the intrusion detection field to enhance the detection accuracy [7], [9], [10]. For a more detailed description of D-S theory and mathematical foundations the reader can read Appendix A or, for extensive practical explanations, our previous publications [3], [4], [6].
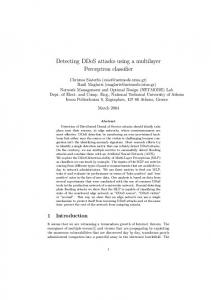
in the considered hypotheses (manual) and the other based on an algorithm that automatically assigns the beliefs with light training (automatic). For the automatic belief assignment mechanism, the reader is referred to Appendix B or to our previous papers [3], [4], [6] for further details. Regarding the manual methodology, the beliefs for “Attack” for each of the selected metrics (described later in Section III-C ) are chosen experimentally and intuitively i.e. the bigger the difference from a historical reference, the higher the belief in the attack (see Fig. 1). The historical reference for each metric is the mean of the metric values collected in a window size of 30 frames. An analysis for the optimum window size can be found in [12]. III. M ETHODOLOGY A. Attack Description We are launching a hijacking type of Rogue AP attack in which the attacker is able to take over the communication between the legitimate AP and wireless devices. One way of luring a client to connect to a Rogue AP is by injecting Beacon and Probe response frames using stronger signal strength than the legitimate AP, since the wireless devices try to associate to the AP with the strongest signal strength [13]. Once the attacker has taken over the wireless communication, it has complete control of the unencrypted communication link to the Internet [14]. B. Testbed In order to evaluate our proposed algorithm under Rogue AP attacks, we set up the following real test-bed. A genuine wireless AP by Liksys was used to provide internet connection to a client running Ubuntu Linux 12.04. The attacker was running the BackTrack operating system, using an Atheros wireless card with AR5213A chipset and ath5k drivers. Finally, a monitoring node was utilised to measure the traffic passing through the network, configured on a specific channel. The tool responsible for monitoring and capturing the wireless
Attack RSSI Doubt RSSI No Attack RSSI Attack Rate Doubt Rate No attack Rate
0.6
0.5
A major challenge for applying D-S theory on IDS is to determine the beliefs of whether an event is malicious or not (i.e. define the mass probability functions m as described in Appendix A), from the collected network measurements [11]. Even though there are multiple ways of assigning probabilities to each of the hypotheses in D-S theory, few of them could be used off-the-shelf without a prior training or fine tuning period. We have considered two distinct mechanisms for this purpose. One based on experimentally assigning the beliefs
BPA %
0.4
A. Belief Assignment
0.3
0.2
0.1
0 0
5
10
15
20
25
Difference from Reference
Fig. 1.
Manual BPA Functions for the RSSI and Rate metrics
30
IV. R ESULTS In order to evaluate the effectiveness of the proposed methodologies, the results from the two multi-layer techniques are compared against each other (manual vs automatic both with the mean statistic as reference), and for each methodology all possible metric combinations are examined. That is equal to 32 metric combinations. The results are evaluated by conN structing the false negative rate F N R = T PF+F N (where TP is FP True Positives), false positive rate F P R = Total captured Frames , TP and the DR = T P +F N . Moving on the examination of the Rogue AP pcap files, it should be noted that, generally, it is not possible to detect this attack just from the management frames apart from when using few specific metrics, and still with high FP. These cases include the metrics: RSSI, NAV and Sequence number (see Fig. 2). The Manual method, when analysing just the management
Rate,NAV,Seq
RSSI,Rate,NAV,Seq
RSSI,NAV,Seq
NAV,Seq
Rate,Seq
RSSI,Rate,Seq
Seq
RSSI,Seq
RSSI,Rate,NAV
Rate,NAV
NAV
RSSI,NAV
Rate
RSSI,Rate
RSSI
Even though our tool is able to run on-line and can detect malicious frames in real-time, it also requires to preselect a particular algorithm; either the manual or the automatic method and also to preselect which metrics should be utilised for the detection. In order to compare multiple options, such as both types of algorithms under all possible metric combinations and during the same experiment, the analysis of the collected measurement files was done off-line, iteratively choosing all possible combinations. Several metrics have been experimentally identified, and used in this work, that could indicate an ongoing attack at the PHY and MAC layers. These metrics are: The Received Signal Strength Indication (RSSI), the transmission rate (or data rate), the Network Allocation Vector (NAV), the Sequence number, and the Time To Live value (TTL). The RSSI is related to the Physical layer and is an indication of the received signal strength. The data rate is the rate with which a frame is transmitted. The NAV value indicates, depending on a the frame and the hardware, how long will the channel be occupied until the end of transmission. Finally, the TTL value is a metric indicating the number of routers passed since an IP packet started its journey towards the destination [4]. The collected metrics are analysed and compared to historical data and each metric gives a belief of whether an attack takes place or not. It should be noted that it is important to understand how one needs to filter the frames from which the metrics will be extracted. In our experiments, the filter that was used was “any frame coming from the legal AP MAC address and destined to the MAC address of the monitored client or Broadcast”. The developed tool can analyse management or data frames. In the case of data frames, the additional network layer is offering information (TTL metric) to assist in the detection of malicious frames.
Percentage %
C. Procedure
Auto Average Method
0 10 20 30 40 50 60 70 80 90 100
traffic was Wireshark [15] and the log files are stored in pcap format [16]. The tool used for the Rogue AP attack was HostAPd [17].
Detection Rate (%) False Positive Rate (%)
Fig. 2. Results for Rogue AP attack using Automatic method and considering management frames only.
frames, presents similar results with the Automatic method but the results are not included due to space restrictions. It should be noted that our proposed methodology is a statistical approach and whenever the attacker injects frames where the values of metrics coincide with those from the legal AP, the malicious frames will be statistically indistinguishable from the legal ones. As a general rule, the majority of metrics will need to be statistically indistinguishable from the collected historical data constructed from legal frames. Because the management frames do not provide adequate metrics that are statistically different from those of the legal AP, in order to detect the Rogue AP attack, we need to use data frames where the extra metric of TTL is included. Note that for other types of attacks, the use of management frames is sufficient and in some cases (with WPA2 encryption), the only option [6]. Figures 3 and 4 depict the results for the manual and automatic method respectively considering just the data frames. The results with the Manual approach are lacking in terms of DR in comparison to those of the Automatic method, especially in the last case of using all possible metrics together. Even though the Manual methodology might have performed well in prior experiments by the authors targeting other attack techniques (eg. Airpwn see [3], [4], [6]), in the case of Rogue AP detection the Manual method fails in most cases with the exception of several metric combinations. This highlights the importance of having an adjustable algorithm to assign the beliefs that can be adapted to various types of attacks and not be customised for some particular scenario. In contrast with the Manual method of assigning beliefs, the automatic BPA works in all attack scenarios without the requirement of painstakingly setting the beliefs beforehand by running multiple experiments. The best results using the Automatic approach are gathered in Table I. The best results indicate that NAV is a powerful metric under this scenario and that the combination of all metrics also achieves good overall results. It should be noted that in most cases the malicious frames have been detected in less than 100 µsec from the time they have been captured
RSSI Rate RSSI,Rate NAV RSSI,NAV Rate,NAV RSSI,Rate,NAV Seq RSSI,Seq Rate,Seq RSSI,Rate,Seq NAV,Seq RSSI,NAV,Seq Rate,NAV,Seq RSSI,Rate,NAV,Seq TTL RSSI,TTL Rate,TTL RSSI,Rate,TTL NAV,TTL RSSI,NAV,TTL Rate,NAV,TTL RSSI,Rate,NAV,TTL Seq,TTL RSSI,Seq,TTL Rate,Seq,TTL RSSI,Rate,Seq,TTL NAV,Seq,TTL RSSI,NAV,Seq,TTL Rate,NAV,Seq,TTL RSSI,Rate,NAV,Seq,TTL
Percentage %
0 10 20 30 40 50 60 70 80 90 100
Manual Average Method
Detection Rate (%) False Positive Rate (%)
Auto Average Method
V. C ONCLUSIONS AND F UTURE W ORK
RSSI Rate RSSI,Rate NAV RSSI,NAV Rate,NAV RSSI,Rate,NAV Seq RSSI,Seq Rate,Seq RSSI,Rate,Seq NAV,Seq RSSI,NAV,Seq Rate,NAV,Seq RSSI,Rate,NAV,Seq TTL RSSI,TTL Rate,TTL RSSI,Rate,TTL NAV,TTL RSSI,NAV,TTL Rate,NAV,TTL RSSI,Rate,NAV,TTL Seq,TTL RSSI,Seq,TTL Rate,Seq,TTL RSSI,Rate,Seq,TTL NAV,Seq,TTL RSSI,NAV,Seq,TTL Rate,NAV,Seq,TTL RSSI,Rate,NAV,Seq,TTL
Percentage %
0 10 20 30 40 50 60 70 80 90 100
Fig. 3. Results for Rogue AP attack using Manual method and considering data frames
help towards detecting a malicious activity. This is the case in that particular experiment. It could be argued that such an attack could easily be detected by simply looking at one particular metric (NAV in this case). However, this is true if the NAV value assignment mechanism between the Rogue AP and the legal AP is different, in which case the NAV value will become a distinctive characteristics between the two APs. There are chances where the attacker might be cunning enough (for example by examining the traffic of the legal AP beforehand), or lucky enough, to choose appropriate hardware to emulate the NAV assignment scheme of the legal AP. Furthermore, depending only on one metric makes sense only if that specific attack is expected and the identifying metric is already known. Otherwise, by depending on a specific metric, attacks that do not manifest with that specific metric, will remain undetected. Therefore, the use of multiple metrics is preferred because it increases the number of characteristics the attacker needs to emulate and also covers a wider range of possible attacks.
Detection Rate (%) False Positive Rate (%)
Fig. 4. Results for Rogue AP attack using Automatic method and considering data frames
by the monitoring computer. This result is consistent with our previous work applied in other cases of wireless attacks[6]. There are cases where the use of a single metric, in this case NAV, can surpass the performance of dual or triple metric combinations in the automatic method. In fact, the use of NAV results in perfect detection, with 100% of DR and 0% of FP. The dominance of this metric in such cases can be explained due to the hardware difference between the Rogue AP and the legal AP. Similarly to the RSSI, different hardware vendors and software drivers, estimate the NAV field each with their own methodology. The NAV field is influenced primarily by the Transmission Rate followed by the length of the transmitted frame. Even if the transmitted frame is identical between the Rogue AP and the legal AP, the NAV value is likely to be different if hardware differences exist between them. Therefore, different hardware might have different NAV field for transmitting a particular frame and that inconsistency could
This paper discusses the concept and implementation procedure of launching a hijacking type of Rogue AP attack and investigates methods of detecting such an attack by trying to establish an identity for the legal AP using statistical characteristics derived from the measured and collected traffic metrics. The identified metrics that are tracked to build an identity for the authentic AP are the RSSI, Data Rate, NAV, Sequence Number and TTL fields of the IP stack. There is a high success in detection rate when using all possible metrics. Furthermore, the use of an automatic belief assignment mechanism, leads to an adjustable system, that performs well in various attack scenarios without requiring tuning by a network administrator. Because the proposed algorithms are based on statistical approaches, it is essential that the frames injected by the Rogue AP are statistically distinguishable from those of the legal AP. If the attacker manages to successfully emulate the metric values and perfectly conceal the malicious traffic, then the chances of successful detection are very low. However, it is quite difficult and impractical for an attacker to actually emulate all the different characteristics, especially when injecting data frames which require emulation of additional metrics in the higher layers of the IP stack. Furthermore, such a perfectly concealed malicious behaviour would be practically undetectable by any other means. Depending on the type of attack, the injected frames might be management or data frames. We conclude that some attacks are more appropriately detected by analysing just the management frames and other attacks require more information and should be analysed by looking at the data fames. As for future work, we are in the process of finding ways to automatically select appropriate metric combinations and avoid relying on using all of the metrics simultaneously. Ideally, the algorithm should rely on using only metrics that give high confidence no matter what the belief is. This would help in avoiding scenarios where the detection of malicious
TABLE I R ESULTS FOR AUTOMATIC M ETHOD [B EST R ESULTS ]
Metrics NAV RSSI, NAV NAV, Seq NAV,TTL RSSI,NAV,TTL RSSI,Rate,NAV,TTL RSSI,Rate,NAV,Seq,TTL
DR(%) 100 100 99.800 100 100 100 99.840
frames fails because the attacker has managed to emulate the majority of the metrics based on the values of the legal frames. A PPENDIX A Dempster-Shafer, as a theory of evidence method, is a discipline of mathematics that combines evidence of information from multiple and heterogeneous events in order to calculate the probability of occurrence of another event. The D-S theory starts by assuming a Universe of Discourse Θ = {θ1 , θ2 , . . . , θn }, also called a Frame of Discernment, which is a finite set of all possible mutually exclusive propositions and hypotheses about some problem domain. With regards to this work, the frame of discernment is comprised of A = “Attack” and N = “N ormal”. Assuming Θ has two outcomes {A, N }, the total number of subsets of Θ, defined by the number of hypotheses that it composes, is 2Θ = {A, N, {A|N }, ∅} Each proposition (subset) from Θ is assigned a probability, or a confidence interval within [0, 1], by an observer from the mass probability function m (known as “basic probability assignment”):
m : 2Θ → [0, 1]
m(∅) = 0 m(A) ≥ 0, ∀A ⊆ Θ if P A⊆Θ m(A) = 1
The function m(A) is defined as A’s basic probability number. It describes the measure of belief that is committed exactly to hypothesis A. In order to define the confidence interval that is given to a certain event, two functions must first be defined. These are the Belief function (Bel) and the Plausibility function (P l). The former is a belief measure of a hypothesis A, and it sums the mass value of all the non-empty subsets of A. X Bel(A) = m(B) ∀A ⊆ Θ B⊆A
The doubt function (Dou) is given by X Dou(A) = Bel(¬A) = 1 − B
T
m(B)
A=∅
which accounts for all evidence that rule out the given proposition represented by A.
FN rate (%) 0 0 0.199 0 0 0 0.159
FP rate (%) 0 0 0 0 0.025 0.025 0.051
Similarly, the P l function takes into account all the evidence that does not rule out the given proposition. In other words, it expresses how much we should believe in A if all currently unknown facts were to support A. P l(A) = 1 − Dou(A) Thus, the true belief in hypothesis A will be along the interval [Bel(A), P l(A)]. However, in practice, the values of the interval could be identical and therefore the interval becomes a unique value. The idea behind the D-S rule of combination is to fuse the belief from two different observers into one given hypothesis. Let m1 and m2 be the basic probability assignments from observer 1 and 2 respectively. Their orthogonal sum, m = m1 ⊕ m2 , is defined as P m(A) =
X
1−
Y =A m1 (X) ∗ m2 (Y ) T X Y =∅ m1 (X) ∗ m2 (Y
T
P
)
when
A 6= ∅
(1) If the denominator of eq. (1) is equal to zero, K = 0, then m1 ⊕ m2 does not exist and m1 and m2 are said to be totally or flatly contradictory. � A PPENDIX B In previous work we have proposed three distinct methodologies for automatically assigning beliefs to each hypothesis, based on a baseline profile of normal utilisation and without intervention from the IDS administrator. One method generates the belief in Attack, and a second method generates the belief in Normal. Both work concurrently. Then, based on the belief in Normal and Attack, a third method calculates a readjusted belief for Uncertainty. Two conditions must be met. Firstly, the number of legal frames should be larger than malicious frames. Generally, normal data is more predominant than malicious data in real network traffic [18]. Secondly, the difference between the metrics of legal and malicious frames must be statistically differentiable and quantifiable. 1) Method to Assign Belief in Attack: The system first calculates the reference of the n elements in the dataset and the number of times the most repeated value (i.e. mode) appears in the dataset, hereafter referred as Frequency F. Then, the
system calculates the angle α generated by the frequency and the value with the largest distance (Dmax ) from the reference (see Fig. 5(b)). This angle α is used as a reference for the maximum belief in Attack, which is set to 50%. This belief for each of the hypotheses is calculated by dividing 100% by the number of elements in the frame of discernment (in our case 2). The angle α is given by: a = cos−1 2 F 2 1 . (Dmax +F ) 2
For each new incoming frame, the system calculates the angle β generated by F and the distance (D) of this value from the reference. The angle β would be bounded by 0 and α, 0 ≤ β ≤ α, where β = cos−1 2 F 2 1 . Using a simple (D +F ) 2
linear function, the system assigns the belief in Attack for the angle β generated by the current metric’s value.
F
β α
Metrics Value Reference Frame Value
Current Frame Value
Max Frame Value
Dmax D
Fig. 5.
Automatic BPA method for belief in Attack.
2) Method to Assign Belief in Normal: The methodology proposed for assigning beliefs in Normal, is based on the degree of dispersion of the values in the dataset. The system makes use of quartiles, similar to the “box and whisker” method [19], to create classes within the dataset and assigns a fixed belief to each class. The metrics of each new incoming frame are allocated whithin one of the classes. Depending on the class that the current frame is allocated to, the system assigns the belief in Normal. If the value of the current frame coincides with the median (Me), the belief is 50%. If the value is allocated between the Q1 and Me, or Q3 and Me, the belief is 40%. Values between Min and Q1 , or Q3 and Max will acquire a belief of 30%. The rest of the values will acquire a belief of 15%. 3) Method to Assign Belief in Uncertainty: A provisional value is assigned to Uncertainty using a linear correlation between the belief in Normal and Attack. As mentioned above, the maximum possible belief corresponds to 0.5. So, for calculating the belief in Uncertainty, the larger of both beliefs, Normal and Attack, is adjusted to 50%. For instance, if the belief in Normal and Attack are 0.4 and 0.497, respectively, the value for Uncertainty would be: BeliefU nc. = 0.5 ∗ 0.4/0.497 = 0.402. In this example, the summation of all the beliefs is higher than P 1. This breaks one of the conditions of D-S theory: H⊆Θ m(H) = 1. Therefore, an adjustment value µ is
calculated as follows: µ = X−1 3 , where X is the summation of the three beliefs. Continuing with the previous example, X = 0.4+0.497+0.402 = 1.22. Then, the adjustment value is µ = (1.229 − 1)/3 = 0.099. Therefore, the beliefs in Normal, Attack and Uncertainty are readjusted to 0.3, 0.397 and 0.303, respectively. � R EFERENCES [1] Raheem Beyah and Aravind Venkataraman. Rogue-access-point detection: Challenges, solutions, and future directions. Security & Privacy, IEEE, 9(5):56–61, 2011. [2] J. Milliken, V. Selis, K. M. Yap, and A. Marshall. Development of device identity using wifi Layer 2 management frames for combating rogue APs. In 10th Intl. Conf. on Security and Cryptography, Reykjavik, Iceland, July 2013. Accepted for publication. [3] F.J. Aparicio-Navarro, K.G. Kyriakopoulos, and D.J. Parish. A multilayer data fusion system for wi-fi attack detection using automatic belief assignment. In The World Congress on Internet Security (WorldCIS 2012), pages 45–50, Guelph, Ontario, Canada, 10-12 June 2012. IEEE. [4] K.G. Kyriakopoulos, F.J. Aparicio-Navarro, and D.J. Parish. Fusing multi-layer metrics for detecting security attacks in 802.11 networks. In Wireless Telecommunications Symposium (WTS), 2011, pages 1–6. IEEE, 2011. [5] M. Raya, J.P. Hubaux, and I. Aad. Domino: a system to detect greedy behavior in ieee 802.11 hotspots. In Proceedings of the 2nd international conference on Mobile systems, applications, and services, pages 84–97. ACM, 2004. [6] KG Kyriakopoulos, F.J. Aparicio-Navarro, and DJ Parish. Manual and automatic assigned thresholds for multi-layer data fusion ids in 802.11 attacks. IET Information Security, To be published 2013. [7] C. Siaterlis and B. Maglaris. Towards multisensor data fusion for dos detection. In Proceedings of the 2004 ACM symposium on Applied computing, pages 439–446. ACM, 2004. [8] Q. Chen and U. Aickelin. Anomaly detection using the dempster-shafer method. In Proceedings of the 2006 International Conference on Data Mining, DMIN 2006, pages pp. 232–240, 2006. [9] V. Chatzigiannakis, G. Androulidakis, K. Pelechrinis, S. Papavassiliou, and V. Maglaris. Data fusion algorithms for network anomaly detection: classification and evaluation. In Third International Conference on Networking and Services, page 50. IEEE, ICNS, 2008. [10] A.G. Fragkiadakis, V.A. Siris, and A.P. Traganitis. Effective and robust detection of jamming attacks. In Future Network and MobileSummit 2010. IIMC International Information Management Corporation, 2010. [11] D. Yu and D. Frincke. Alert confidence fusion in intrusion detection systems with extended dempster-shafer theory. In Proceedings of the 43rd annual Southeast regional conference-Volume 2, pages 142–147. ACM, 2005. [12] F.J. Aparicio-Navarro, K Kyriakopoulos, and D.J. Parish. An automatic and self-adaptive multi-layer data fusion system for wifi attack detection. In International Journal of Internet Technology and Secured Transactions (IJITST). Inderscience, 2013. To be published. [13] Jack TIMOFTE. Wireless intrusion prevention systems. Revista Informatica Economic˘a nr, 3(47):129, 2008. [14] Athira M Nambiar, Asha Vijayan, and Aishwarya Nandakumar. Wireless intrusion detection based on different clustering approaches. In Proceedings of the 1st Amrita ACM-W Celebration on Women in Computing in India, page 42. ACM, 2010. [15] Wireshark Foundation. Wireshark website. http://www.wireshark.org. [16] Tcpdump and libpcap website. http://www.tcpdump.org. [17] HostAPd website. http://hostap.epitest.fi/hostapd/. Site last visited 26 April 2013. [18] C. Thomas and N. Balakrishnan. Improvement in minority attack detection with skewness in network traffic. In Proceedings of SPIE, the International Society for Optical Engineering, pages 69730N–1. Society of Photo-Optical Instrumentation Engineers, 2008. [19] C.C. Tuan, Y.C. Wu, W.S. Chang, and W.T. Huang. Fault tolerance by quartile method in wireless sensor and actor networks. In Complex, Intelligent and Software Intensive Systems (CISIS), 2010 International Conference on, pages 758–763. IEEE, 2010.