Detecting On-Body Devices Through Creeping Wave Propagation Wei Wang† , Yingjie Chen‡ , Lin Yang‡ , Qian Zhang‡ , Jin Zhang∗ †
School of Electronic Information and Communications, Huazhong University of Science and Technology ‡ Department of Computer Science and Engineering Hong Kong University of Science and Technology ∗ South University of Science and Technology of China Email:
[email protected], {ychenax, lyangab, qianzh}@ust.hk,
[email protected]
Abstract—The ability to detect which wearables and smartphones are on the same body has the potential to support a wealth of applications, including user authentication, automatic data synchronization, and personalized profile loading. This paper brings this feature to commercial off-the-shelf (COTS) wearables and smartphones, by creating a virtual “on-body detection sensor” based on devices’ inherent wireless capabilities. We investigate using the peculiar propagation characteristics of creeping waves to discern on-body wearables. To this end, we decompose signals into multiple independent components to exploit the variation features of creeping waves. We implement our system on COTS wearables and a smartphone. Extensive experiments are conducted in a lab, apartments, malls, and outdoor areas, involving 12 volunteer subjects of different age groups, to demonstrate the robustness of our system. Results show that our system can identify on-body devices at 92.3% average true positive rate and 5% average false positive rate. Index Terms—Creeping waves, wearables, on-body detection
I. I NTRODUCTION Smart wearable devices are drawing extensive attention as they provide continuous services with frictionless user interactions. A key feature desired by wearables is to provide unobtrusive experience to users. Today’s wearables have successfully realized the functions of automatically and continuously monitoring users’ physical activities and vital signs, without interrupting the users. Recent advances in wearable computing have transformed traditionally expensive and labor-intensive tasks such as physical analytics [1] and pedestrian assistance [2], into easy processes with unobtrusive interactions. Existing efforts in developing unobtrusive wearables have focused on the computing dimension, while the communication dimension, e.g., association and authentication, still incurs some manual configurations. This becomes burdensome when people use multiple wearables and share them with other persons in a household. We argue that an essential step towards unobtrusive communications is the ability that a wearable/smartphone can automatically recognize which devices are on the same body wearing it. Such an ability enables automatic on-body authentication, data synchronization among wearables and smartphones, and personalized profile loading for household-shared devices. In our vision, a user simply picks up a smart device, such as a heart rate monitor, blood-pressure cuff, or game control, and the device
Wearables Facial recognition [6]
Our approach
Google
Mio Thalmic Gait recognition [24]
Jawbone Fitbit Samsung
Bioimpedance recognition [7]
Capacitive communicatio n [29]
Sensors
Fig. 1. Motivation of using wireless signals for on-body detection. Most COTS wearables are equipped with wireless chips.
would discover which smartphone/smartwatch is on the same body and automatically synchronize the measured data to the wearer’s personal record systems (e.g., HealthKit in iOS and Google Fit in Android), or load a personalized profile (e.g., the profile for gaming or temperature preference for a thermal control). In addition, when a user is unintentionally wearing an unverified device (e.g., another person’s fitness sensor or even a malicious device) or leaves a device unattended (e.g., a special disease sensor needs to be worn all day long), the user’s smartphone/smartwatch or the unattended device would discover the anomaly and alert the user. We believe that it is essential for the on-body device detection solution to fully support versatile wearables equipped with different sensors to maximize the chance of its widespread acceptance. However, recent advances in automatic pairing and user recognition [3]–[5] adopt special sensors, such as accelerometers and light sensors, or some dedicated hardware. They can only support a limited portion of today’s wearables as the devices are equipped with a variety of sensors. One easy solution to apply these ideas to general devices is adding a dedicated sensor to each device, which, however, would be expensive: it requires wearable device manufacturers to undertake major hardware investments and also increases the hardware cost of the devices. Moreover, accelerometer-based approaches [4], [5] only work when wearers walk, and thus are unsuitable for many healthcare monitors, e.g., blood-pressure
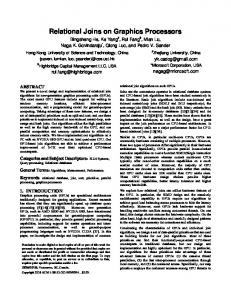
cuffs and smart waist bands, as well as scenarios where a user is sitting or sleeping. We believe that it is essential for the on-body device detection solution to fully support versatile wearables equipped with different sensors to maximize the chance of its widespread acceptance. Despite the diversity of wearables, most of them are capable of wireless connectivity, as illustrated in Fig. 1. These devices are normally connected to wearers’ smartphones for data synchronization via low-energy wireless technology such as Bluetooth. Hence, we argue that instead of relying on special sensors, a better way to bring on-body detection to universal wearables is to turn the general wireless chips into “on-body detection sensors”. To this end, this paper presents AutoTag, which exploits radio propagation features obtainable in commercial wearables to automatically recognize on-body devices. Our key insight is that on-body propagation is dominated by creeping waves diffracted from human tissue and trapped along the body’s surface [6]–[8], while the radio waves of general off-body links are mainly composed of direct line-of-sight (LOS) and multi-path propagations, as illustrated in Fig. 2. The channel variations of creeping waves differ from off-body links in that they are less sensitive to environmental dynamics (multi-path and shadowing fading) and transmitterreceiver (Tx-Rx) distance changes (LOS path loss) [6], [9], but are more sensitive body motions. Thus, we can leverage the distinct features of creeping waves to identify on-body devices. To realize the above idea, we entail the following challenges. 1) How to exploit radio propagation features without any hardware changes to low-end wearables? Most wearables adopt Bluetooth for communication, making it inapplicable for them to use existing Wi-Fi-based techniques that extract signal propagation features based on fine-grained channel information [10] or even a large antenna array [11]. To overcome this predicament, we leverage creeping waves’ peculiar time-domain features that lie in Bluetooth-obtainable received signal strength (RSS). In particular, we extract variations caused by different factors by decomposing RSS traces into multiple independent components, and then exploit the distinct variation features of creeping waves to identify an on-body link. 2) How to accurately extract the desired features when signal propagation is largely affected by body motion? Onbody motion severely affects creeping paths and shadowing fading, which may overwhelm the variations caused by other factors. AutoTag therefore takes a two-step approach to obtain the desired features. First, AutoTag makes an early stop to extract the direct path loss variations based on temporal and spectral properties. Then, AutoTag exploits variation patterns to find signal fluctuation periods that are likely caused by body motion, and eliminate these periods to obtain residual variations caused by environmental dynamics. Summary of results. We implement AutoTag on a wearable system consisting of a Samsung Galaxy S4 smartphone and multiple COTS wearables, including two smart wristbands
Multi-path propagation Creeping wave Body penetration
body On-body rable rab le wearable
Off-body wearable
Fig. 2. Illustration of on- and off-body radio propagation. On-body propagation is dominated by creeping waves.
(Fitbit Force and LifeSense Mambo) and a smart waistband (Lumo Back). On the whole, AutoTag achieves an average true positive (TP) rate of 92.3% and false positive (FP) rate of 5% for 12 volunteer subjects in different indoor and outdoor environments. AutoTag can detect on-body wearables that are placed at the neck, wrist, and waist with TP rate of 90.5% ± 2.5% and FP rate of 3.5% ± 1.5%. Contributions. The main contributions of this work are summarized as follows. • We show that the RSS traces from COTS wearables can be utilized to recognize wearers. Compared to previous special-sensor based approaches, its major advantage is that it can be applied to different types of wearables without any hardware changes. • We develop AutoTag, an on-body detection framework that can run on wearable systems consisting of COTS smartphones and wearables. The framework exploits distinct creeping wave propagation features to discern onbody devices. • We test our system on 12 volunteer subjects with over 76hour traces collected, and conduct extensive experiments in a variety of environments, including a lab, apartments, malls, and outdoor areas. The results show the effectiveness of our system over different subjects, wearing positions, and environments. The rest of the paper is organized as follows. Section II investigates the propagation characteristics of on-body devices, followed by the system design overview in Section III. Section IV and V elaborate the technical details. Section VI and VII present experiment results, followed by literature review in Section VIII. Section IX conclude the paper. II. C HARACTERIZING O N -B ODY R ADIO P ROPAGATION A. Comparison of On- and Off-body Radio Propagation Radio propagation is affected by direct path loss, multi-path, and shadowing fading. For off-body links, i.e., Tx and Rx are placed on different bodies with free space between them, the RSS values are governed by the Tx-Rx distance (direct path
100
200 100 0 −20
−10
0
10
50
0 −20
20
−10
0
10
0 −20
−10
0
10
20
RSS Variation subracted by mean(dB) (a) RSS distributions when wearers are static.
−10
0
10
20
RSS Variation subracted by mean(dB) 100
off−body 50
0 −20
−10
0
10
20
RSS Variation subracted by mean(dB)
Bin Counts
Bin Counts
50
50
0 −20
20
100
100 off−body
on−body
RSS Variation subracted by mean(dB)
RSS Variation subracted by mean(dB) Bin Counts
100 on−body
Bin Counts
on−body
Bin Counts
Bin Counts
300
off−body 50
0 −20
−10
0
10
20
RSS Variation subracted by mean(dB)
(b) RSS distributions when wearers move hands (c) RSS distributions when wearers move freely. and arms.
Fig. 3. Histograms of RSS amplitude of on-body and off-body devices. The RSS traces are collected in a lab, where two persons keep a constant distance of 4m. (a) and (b) are controlled experiments, while wearers in (c) move intermittently at their will.
loss gain) and dynamics of the environments (multi-path and shadowing fading). For on-body links, i.e., Tx and Rx are placed on the same body, the radio propagation exhibits different patterns: the RSS variations have low correlations with the Tx-Rx distance and dynamics of the environments, but are highly sensitive to body motion [9]. This is because radio waves can propagate around the body via (i) penetration path that passes through the body, and (ii) creeping path that diffracts around the body, as illustrated in Fig. 2. According to previous study [6], creeping wave plays a dominant role in on-body propagation, which indicates that on-body radio propagation is easily affected by body shape changes caused by body motion while other offbody factors such as multi-path fading have less influence. Based on the above observations, we can exploit distinct radio propagation features to discern on-body devices. Fig. 3 shows results of a motivational experiment where each of the two users wears a COTS wristband while only one user carries a smartphone in a pocket. The RSS histograms are counted based on five-minute traces collected in a lab, where two persons keep a constant distance of 4m. When both users are static (Fig. 3(a)), the RSS amplitude of the on-body device is more stable. This is because on-body propagation is dominated by the creeping path, while off-body propagation is easily affected by environmental dynamics. When users move (Fig. 3(b)), the RSS of on-body links has larger variance as the creeping path is more sensitive to changes in body shape. B. Motivation of Decomposition It is, however, non-trivial to directly detect on-body devices from the RSS variations. The above examples are controlled experiments where users’ movements are preset, while in real cases (Fig. 3(c)) the users’ motion states and the environmental dynamics are very complex and unpredictable. This makes it difficult to directly extract features from RSS variations. Recall that the instantaneous RSS is comprised of multiple components that are caused by multiple independent factors,
including Tx-Rx distance, body motion, and environmental dynamics. These factors reveal distinct patterns in on- and offbody propagations. We observe that these factors contribute to different scales of variations. Specifically, Tx-Rx distance changes are gated by the speed of human movements, and thus lead to relatively slow RSS variations (large-scale variations), while body motion such as hand gestures and environmental dynamics result in fast RSS fluctuations (small-scale variations). Therefore, we can extract desired features by decomposing the RSS time series into multiple components. III. AUTOTAG D ESIGN AutoTag leverages the characteristics of creeping waves to enable on-body detection on general COTS wearables with wireless capability. The crux of AutoTag is to decompose RSS traces into different levels of variations for propagation feature extraction. Fig. 4 illustrates the framework of AutoTag. It takes the RSS time series as input, which is collected by a wearer’s carry-on smartphone. Note that many COTS wearables (e.g., Samsung Gear Fit, Fitbit, Mio Alpha) synchronize sensor readings with connected smartphones when the corresponding smartphone applications are active. The synchronization periods of these devices are around 0.5-1.5s. AutoTag takes advantage of RSS traces from existing traffic across wearable-smartphone links. If existing traffic, which is device-dependent, is insufficient, the smartphone periodically measures RSS by sending poll packets to wearables. When there are no active sensor readings, AutoTag switches to sleep mode to save energy. The core of AutoTag is composed of two steps, Signal Decomposition and Propagation Pattern Matching. 1) Signal Decomposition. AutoTag first partitions the traces into multiple basic segments. Then, AutoTag decomposes each segment into multiple independent components, and clusters them into large- and smallscale variations. The small-scale variations are fast RSS fluctuations caused by multi-path fading. The large-scale
RSS segment
RSS Time Series
Small-scale variation
Variation Decomposition
Pattern Matching
V
Signal Decomposition
Fig. 4.
Propagation Pattern Matching
IV. S IGNAL D ECOMPOSITION The first step of AutoTag is to decompose RSS measurements into multiple components. AutoTag first divides RSS time series into segments, and then performs signal decomposition to derive multi-scale variations. A. Signal Segmentation A segment is the basic unit for pattern matching, and its interval should be carefully selected. If the segment interval is too long, one segment may contain both on-body and off-body states, which may mislead pattern matching. If the segment interval is too short, RSS samples in one segment may not be sufficient enough to extract variation features. AutoTag selects the shortest interval that provides satisfactory performance. An interval of T = 20s is found to be able to distinguish over 90% on- and off-body wearables. B. Multi-Scale Variation Decomposition 1) Variation Component Characteristics: As discussed in Section II, the composition of the RSS time series is complex, in that signal variations are contributed by many factors. This
Diagonal Averaging
s2
Yn
Diagonal Averaging
sn
Clustering
Large-scale variation Independent components
System flow of AutoTag.
variations are slow RSS fluctuations caused by obstacles and changes in Tx-Rx distances. 2) Propagation Pattern Matching. After decomposing RSS traces into different scales of variations, AutoTag eliminates the impact of body motion to derive residual variations caused by environmental dynamics, and then matches the variation features of each segment to on/offbody radio propagation patterns. The algorithms of AutoTag run on smartphones only, which collect RSS traces of associated wearables and surrounding discoverable wearables. When a smartphone identifies a taking-off event (from on-body to off-body state), it dissociates with the corresponding wearable so that the wearable can broadcast beacons to become discoverable to other smartphones. When a smartphone detects that the beacon RSS traces of a free wearable fit the on-body propagation pattern, it tags the wearable as an on-body device, and associates with the device.
Y2
FastICA
Large-scale Variation
s1
...
Embedding Motion-induced Fluctuation Removal
Diagonal Averaging
...
r
...
Segmentation
Y1
Small-scale Variation
Fig. 5.
Signal processing procedure of multi-scale variation decomposition.
makes it difficult to directly extract features from RSS variations. To overcome this predicament, AutoTag decomposes the RSS time series into multiple components. Recall that the instantaneous RSS (in dB) is comprised of multiple components that are caused by multiple independent factors, including Tx-Rx distance, body motion, and environmental dynamics. These factors reveal distinct patterns in on- and off-body propagations. We observe that these factors contribute to different scales of variations. Specifically, Tx-Rx distance changes are gated by the speed of human movements, and thus lead to relatively slow RSS variations, while body motion such as hand gestures and environmental dynamics result in fast RSS fluctuations. Based on this observation, AutoTag aims to extract the signal variations contributed by each of these factors by decomposing the RSS time series into variations of different scales. As illustrated in Fig. 5, the signal processing procedure of multi-scale variation decomposition first separates the RSS segment to multiple independent components (Section IV-B2), and then groups them into largeand small-scale variations (Section IV-B3). The next two subsections describe the two steps, respectively. 2) Independent Component Decomposition: A direct method to derive variations of different scales is to decompose RSS traces into multiple spectral components using filters. However, it is difficult to identify the cut-off frequencies for partitioning, as the spectral property of RSS variations varies across different environments and contexts. To address this issue, AutoTag employs single channel independent component analysis (SCICA) [12], which is widely used in biometric signal processing. The major advantages of SCICA are two-folds. First, it separates a multivariate signal into independent non-gaussian components. This fits our target of deriving multiple independent variations. Second, it requires no prior knowledge about spectral properties of components, which removes the need to set cut-off frequencies. Generally, SCICA works by transforming a time series such that the statistical dependences between the output components
are minimized. It includes three steps: embedding, separation, and recovery. In the embedding step, an RSS segment r = [r(1), r(2), ..., r(T )]⊤ is mapped into an L × K matrix V, which is expressed as r(1) r(2) ··· r(K) r(2) r(3) · · · r(K + 1) V= . (1) , . .. .. .. .. . . r(L)
r(L + 1)
···
r(T )
where L = T − K + 1 is the embedding dimension and K the number of consecutive delayed segments. The practical minimum size for L is fs /fl [13], where fs denotes the sampling frequency and fl the lowest frequency of interest in RSS signals. AutoTag sets fl = 0.5 Hz and adopts a larger L = ⌈1.5 × fs /fl ⌉ to capture substantial information from noisy and heavily correlated RSS traces. The separation step searches for a transformation matrix W that decomposes V into multiple independent components V=
n X
⊤ a1 u ⊤ 1 + ... + aL uL ,
(2)
i=1
where W = [a1 , ..., aL ]−1 and {ui : ∀i} are the independent components to be extracted. Note that we use the column vector as the default format. In our implementation, we adopt the FastICA algorithm [14] to derive W. FastICA has the merits of fast and stable convergence, which is suitable to run on resource-limited smartphones. FastICA treats it as an optimization problem, and iteratively estimates W by searching the direction that maximizes the non-Gaussianity of the projection U = [u1 , ..., uL ] = WV. After deriving the transformation matrix W, the recovery step maps U back to the measurement space using Y i = ai u ⊤ i ,
(3)
where ui is the ith column of U. The delay matrix Yi is projected to a time series component si by applying the diagonal averaging [13], which is an inverse procedure of the embedding step. 3) Multi-Scale Variation Clustering: The raw RSS signals are collected in an apartment where one user walks with a smart wristband (as the on-body wearable) and a smartphone in her pocket, while another user walks with a wristband (as the off-body wearable). We observe that {si : ∀i} can be quite a few (around ten components) and multiple components may associate with a single factor. Recall that we are interested in identifying variations caused by direct path loss, environmental dynamics, and body motion. Direct path loss exhibits lower frequencies of variations than the other two factors, and can thus be easily extracted from derived components. Though possessing different variations, features of environmental dynamics and body motion are harder to distinguish as both result in shadowing fading. Hence, AutoTag first extracts direct path loss variations by grouping the components into
two main clusters, i.e., large-scale and small-scale variations, where large-scale variations are contributed by direct path loss. To derive large- and small-scale variations, AutoTag groups variations based on agglomerative hierarchical clustering [15], which treats each component as a singleton cluster at the beginning and then successively merges pairs of clusters until all clusters have been merged into a single cluster. The advantage of hierarchical clustering is that it stores intermediate results in the clustering procedure. For distance measure in clustering, AutoTag employs Dynamic Time Warping (DTW), a popular technique that computes an optimal match between two time series with non-linear variations [16]. The hierarchical clustering procedure successively merges clusters or components with the smallest DTW distance. V. P ROPAGATION PATTERN M ATCHING After applying signal decomposition, AutoTag first exploits signal fluctuations that are likely caused by body motion, and removes them to derive residual small-scale variations. Then, AutoTag matches the variations of an RSS segment to on/offbody propagation pattern. A. Motion-Induced Fluctuation Removal Recall that signal fluctuations incurred by body motion overwhelm other on-body variations (Fig. 3). As we have no knowledge about the users’ motion states, the motion-induced signal fluctuations can be misleading in pattern matching. To eliminate the impact of body motion, AutoTag sanitizes smallscale variations by removing the periods that contain motioninduced signal fluctuation with high probability. From existing measurements [6], [17]–[19] and our empirical study, we observe that • Body movements induce significant fluctuations of path gain and fading. Measurement results from many studies [6], [17], [18] have shown that signal fluctuations incurred by body motion are several times larger than those when wearers are static. From RSS traces of an on-body device collected from the carry-on smartphone, we observe that the signal variations in the hand movement period is 2-3 times larger than those in the static period. • The frequencies of body movements fall into a low frequency range. Most frequencies of hand gestures fall into [0.3, 4.5] Hz [19], and the frequencies of other body movements are even lower. We observe that most large variations during body motion fall between 0.5 Hz and 2 Hz. AutoTag minimizes the impact of body motion by applying a low pass filter with cut-off frequency of 0.5 Hz to the largescale variation component, and treats the residual components as variations incurred by environmental dynamics. B. Multi-Scale Variation Pattern Matching So far we have obtained residual large-scale variations and small-scale variations. We then exploit the features in these two scales of variations to match the RSS segment to the on/off- body propagation pattern. Due to the fact that the
main on-body propagation form, i.e., the creeping wave, is insensitive to environmental dynamics, we can discriminate among the propagation patterns by examining the variations caused by these two factors. Specifically, we define a utility function that is a weighted sum of the significance of these variations: u = ασl + βσs ,
Sub1's walking activity
Sub2's walking activity
(4)
where α, β are the weights for the standard deviations σl , σs of large- and small-scale variations, respectively. To determine α, β, we adopt a heuristic approach by measuring the standard deviations in on- and off-body traces. The traces are collected over a short period of time (e.g., 15 min) in different scenarios, including malls, apartments and outdoor areas. We first compute the average standard deviations {¯ σlon , σ ¯son } in on-body traces and {¯ σloff , σ ¯soff } in offbody traces. We allocate proportionally more weights to the coefficient of which the standard deviations in the two traces have a larger difference, that is, ¯loff σ ¯ on − σ α . = lon β σ ¯s − σ ¯soff
Sub1 Sub2
(5)
To match the RSS segment to on/off-body propagation pattern, we compare u with a threshold as follows ( ¯loff )/2 + β(¯ σson + σ ¯soff )/2 ⇒ off-body u ≥ α(¯ σlon + σ . u < α(¯ σlon + σ ¯loff )/2 + β(¯ σson + σ ¯soff )/2 ⇒ on-body (6) VI. M ICRO -B ENCHMARK E XPERIMENTS The target of micro-benchmark experiments is to evaluate our system performance in different basic scenarios. Specifically, we evaluate our system when wearers are in 9 different motion states. A. Experimental Setup 1) Implementation and Setup: We implement AutoTag as an Android background service on a Samsung Galaxy S4 smartphone. The smartphone runs Android 4.4 firmware and is equipped with a Bluetooth 4.0 chipset to communicate with wearables at 2.4 GHz. The AutoTag service implemented on the smartphone sends poll packets to connected wearables using Android API, and log RSS measurements for analysis. We use Fitbit Force, LifeSense Mambo, and Lumo Back as wearables. AutoTag only runs a background service in smartphones, and does not require any modifications to COTS wearables. Since AutoTag relies merely on standard Bluetooth API in COTS devices, it can also be readily implemented on other platforms such as iOS and Windows Phone. We have conducted a series of experiments to evaluate the performance of AutoTag in both controlled and uncontrolled scenarios. The controlled experiments are conducted in a lab and users are asked to walk or keep stationary. Challenging scenarios such as walking side by side and sitting side by side are evaluated. The uncontrolled experiments involve the daily activities of 12 volunteer subjects, and are conducted in apartments, malls, and outdoor areas.
Fig. 6.
Floor plan of the lab environment for benchmark experiments.
Metrics. We use the following metrics to evaluate the performance of our system. • True positive (TP) rate. TP rate is defined to be the ratio of the number of segments in which the on-body wearable is correctly detected to the total number of segments. • False positive (FP) rate. FP rate is the ratio of the number of segments in which the off-body wearable is falsely recognized as being on-body to the total number of segments. 2) Lab Environments: The micro-benchmark experiments are conducted in a lab, whose layout is depicted in Fig. 6. We present the extensive evaluations of our system in real environments in Section VII. The lab consists of 36 cubics. There were 4 and 36 students in Lab1 and Lab2, respectively, and most of them sat in front of their desks, while only a few students were walking during experiments. We conduct experiments on different days during work hours. 3) Wearer Motion States: The benchmark experiments involve two volunteers Sub1 and Sub2, and each of them wear a smart wrist band (i.e., Fitbit Force and LifeSense Mambo). Sub1 puts the smartphone in her pocket when she is off her seat. Sub1 may hold the phone, put it in pocket, or place it on her desk when she is sitting. We consider 9 motion state scenarios as described in Fig. 7, where each wear have the following three motion states. • Static. In static state, the wearer sits in front of her desk and makes no body motion like gestures and hand/arm movements. In this state, the wearer can be asleep or watching video. • Body Motion. In body motion state, the wearer sits in front of her desk and makes body motion. These body motion includes cleaning desk, tapping keyboard, and other occasional hand/arm movements. • Walking. In walking state, the wear walks along the aisles in the lab as shown in Fig. 6. We collect total 4.5-hour RSS traces for analysis, with 0.5 hour for each state combination.
TABLE I BASIC INFORMATION OF VOLUNTEER SUBJECTS .
Sub2
Sub1 Static
Body Motion
Static
0.89
0.79
Walking 0.93
Body Motion
0.85
0.83
0.93
Walking
0.87
0.82
0.90
Sub. Sex Age
1 F 21
2 F 26
3 F 50
4 F 59
5 F 81
6 M 17
7 M 22
8 M 25
9 M 26
10 M 53
11 M 54
12 M 61
(a) TP rate under various wear motion states. 1
0.5
0.8
0.4
Body Motion
Walking
0.25
0.17
0.03
Body Motion
0.29
0.14
0
Walking
0
0
0
0.6 0.4
Residential Mall Outdoor
0.2
(b) FP rate under various wear motion states. Fig. 7.
TP and FP rates under various wear motion states.
0
FP Rate
Static Static
TP Rate
Sub2
Sub1
Residential Mall Outdoor
0.3 0.2 0.1
100
200 300 400 500 Sample Period(ms)
0
100
(a) TP rate.
B. Results Fig. 7 shows the TP and FP rates of our system under various wearer motion states. For all cases demonstrated in Fig. 7(a), on-body devices are correctly recognized with ratios over 79%. The average TP rates of different on-body states have the following relation: Walking > Static > Body Motion. The reason is that in the Walking state, the hand and leg movements are oscillatory, which makes it easy for AutoTag to remove body motion with high precision. In the Static state, the placements of the smartphone are versatile: it may be placed on desk, held in the hand, or put in a pocket. These different placements increase the uncertainty of the creeping wave propagation, thereby slightly dragging down the TP rate. However, AutoTag still achieves over 85% TP rate in spite of different smartphone placements. The TP rate in the Sub1 Body Motion state is lower than the others due to the imperfect removal of motion-induced fluctuation. In Fig. 7(b), the FP rate is lower than 17% in most cases except the two cases of Sub1 being static. In the five Walking cases, AutoTag achieves very low FP rates of 0-3%, as we can exploit both large and small-scale variations to recognize the off-body wearable. The worst cases are the states where Sub1 is static while Sub2 is sitting (Body Motion and Static states). In these two cases, the small-scale variations for Sub2’s device are small, and thus are easily recognized as on-body propagation. In real cases, the chance is rare for a person to continuously remain static, and thus AutoTag can still achieve a high detection accuracy. In the following section, we conduct extensive experiments to validate AutoTag in real environments. VII. E VALUATION IN R EAL E NVIRONMENTS In this section, we evaluate AutoTag in real environments with uncontrolled body motion. The experiments involve 12 volunteer subjects, and are conducted in apartments, malls, and outdoor areas. A. Experimental Setup 1) Enrolled Participants: We invite 12 volunteers, whose basic information is listed in Table I, to participate in the
200 300 400 500 Sample Period(ms)
(b) FP rate.
Fig. 8. FP and TP rates under various RSS sample periods in different environments.
experiments. The subjects include a teenager, five college students, five middle-aged people, and an elderly person. We specifically select subjects to cover different age groups and both genders. These subjects normally have different body motion patterns. The elderly moves more slowly while younger people move faster and are more active. The subjects also vary in height and weight, ranging from 5 ft to 6 ft and 100 lbs to 190 lbs, respectively. The creeping wave propagations might show different patterns on people of different shapes. We intend to see whether body motion and shape affect the experimental results. 2) Methodology: To validate AutoTag in real cases, we do not control wearers’ movements as in controlled experiments. We only ask volunteers to wear the devices, and then the wearers continue their daily activities in different environments. For example, in apartments, wearers may do housework, rest, and dine as usual; while in malls, wearers walk and pick up goods for shopping. Wearers are free to talk and make gestures during the experiments. Unless otherwise stated, volunteers wear the Fitbit Force or LifeSense Mambo on their wrists as the wearables, and place the smartphone in a pocket or hold it. B. Evaluation in Different Scenarios People wear devices in many different indoor and outdoor areas. Indoor propagations significantly differ from outdoor propagations, in terms of multi-path fading, shadowing, and direct path loss. Moreover, the propagation patterns in different indoor environments (e.g., different layouts and user densities) are also versatile. It is thus important to evaluate the robustness of AutoTag in various environments. We study the following three representative scenarios. In each environment, two subjects have wearables on and one of them carries a smartphone. • Residential environment. We test our system in three different-sized (i.e., 1000 ft, 1300 ft, and 1600 ft2 ) apartments. 2-6 other people including family members
1
0.5 0.4
0.6 0.4 0.2 0
Residential Mall Outdoor 10 15 20 25 30 35 40 Segment Interval(s)
(a) TP rate.
FP Rate
TP Rate
0.8
Residential Mall Outdoor
0.3 0.2 0.1 0
10 15 20 25 30 35 40 Segment Interval(s)
(b) FP rate.
Fig. 9. TP and FP rates under various segment intervals in different environments.
•
•
30 s. This is because the off-body pattern is more complex than the on-body pattern, which increases the difficulty to precisely decompose longer off-body RSS time series. Besides, the optimal segment interval that offers the lowest FP rate in the figure is 20 s, as the RSS samples in the segments with intervals less than 20 s are insufficient to perform pattern matching.
and visitors are co-located in the apartment. Wearers rest on couch, watch TV, walk, cook, and clean floors during our tests. Mall environment. This environment includes a smallsize supermarket (about 30 ft × 50 ft) and a large shopping mall. The mall environments are very dynamic, with people frequently passing by. The wearers go shopping together, with a series of activities like walking, browsing, and picking up the goods involved. Outdoor environment. The outdoor environment includes a plaza and a walkway. In the plaza, the two wearers wander randomly, while in the walkway, the two wearers walk side-by-side along the road. In both cases, the wearers may chat with each other while making occasional gestures.
We conduct the experiments over 14 different days, and collect RSS traces of 25.01 hours, with 10 hours in the residential environment, 6.26 hours in the mall environment, and 8.75 hours in the outdoor environment. 1) Results: We evaluate the robustness of AutoTag in different environments in Fig. 8 and Fig. 9. The results show that the TP and FP rates are similar over different environments when the RSS sample period ranges from 100 ms to 300 ms, and the segment interval is no larger than 30s. Fig. 8 plots the FP and TP rates of AutoTag under various RSS sample periods, where the segment interval is fixed to 20 s. Higher sample rates can provide finer-grained propagation information. AutoTag achieves similar performance in the three environments. We observe that for the sample rate of 100-200 ms, the TP rate is higher than 85%, and the FP rate is as low as below 8%. Wearables are likely to be classified as off-body devices (low TP and FP rates) when the sample period is larger than 400 ms, as the small-scale variations are mistakenly recognized as large-scale variations with high probability due to low RSS granularity. The results indicate that AutoTag performs well with a reasonable sample period of less than 300 ms. Then, we evaluate the performance of AutoTag under various segment intervals in Fig. 9, where the sample period is set to 200 ms. The TP rate is insensitive to variations in segment intervals, and remains as high as over 91%; while the FP rate increases quickly when the segment interval goes over
VIII. R ELATED W ORK Sensor-based user recognition. The prevalence of smart devices has spurred growing attempts and extensive efforts in developing user recognition systems for new applications and human-device interactions. Specific sensors are widely used to discern users. A smart watch like device [3] is developed to recognize its wearer based on users’ bioimpedance fingerprints. A special ring is developed to distinguish multiple users that simultaneously interact with a capacitive screen [21]. Chen et al. [22] use motion and light sensors to enhance facial recognition on smartphones. Srinivasan et. al [23] deploy ultrasonic distance sensors above doorways in a home to build a biometric identification system for multiresident home scenarios. Similarly, Hayashi et al. [24] develop a user verification system based on body lengths and waving gestures. The application scenario is limited to a population size of a household. Ren et al. [4] exploit unique gait patterns from smartphone’s accelerometers to build a user verification scheme for mobile healthcare systems. These systems capture individual differences using different sensors, and build the basis for user verification. Different from these systems, AutoTag aims to bring user recognition ability to general COTS wearables using their built-in wireless chipsets. Indeed, AutoTag can be built on top of these systems to biometrically identify wearers for general wearables. For example, a smartphone use facial or gait recognition to uniquely identify its wearer, while general wearables discern their wearers’ identifies by recognizing on-body smartphones. Motion tracking using wireless signals. Another body of related work is motion tracking using wireless signals. These studies exploit body radio reflection patterns for body motion tracking or gesture recognition [11], [25], [26], activity discrimination [10], and speech recognition [27]. These systems require Wi-Fi monitors [10], [26], [27] or even multi-antenna systems [11], [25] to acquire fine-grained channel information (e.g., CSI). However, They cannot be applied to wearable devices as most COTS wearables adopt Bluetooth for energyefficient communications. In wearable systems, only low rate (¡10pkt/s) RSS traces are available. Though the coarse-grained RSS traces provide lowgranularity propagation information, they are widely available for low-end mobile devices. Several recent studies have proposed using RSS traces of a single Tx-Rx pair for respiration rate monitoring [28] and human queue tracking [29]. AutoTag is fundamentally different from these proposals in that AutoTag leverages the creeping waves related features embedded in RSS traces to recognize on/off-body propagations.
Body-area network (BAN) channel characterization. Many existing measurements have studied the propagation model for on-body channels [6], [9], [17], [18], [30], [31]. These studies suggest that there exists substantial differences in on-body and off-body propagations. Their measurement results indicate that it is feasible to use radio propagations to distinguish between on-body and off-body devices. IX. C ONCLUDING R EMARKS This paper presents AutoTag, a low hardware cost approach for user recognition by extracting the distinct creeping wave propagation features of on-body devices. AutoTag can be applied to general wearables equipped with low-end wireless connectivity such as Bluetooth. It only requires users to carry smartphones or other dedicated devices with them, and automatically recognizes wearers from RSS traces with sample period of 100-300ms. The insight is that on-body radio waves propagate mainly in the form of creeping waves, which have unique characteristics reflected in RSS variations. AutoTag exploits the RSS variations by decomposing them into multiscale variations, and extract the variation patterns to discern wearers. We demonstrate the generality of AutoTag by evaluating it using different COTS wearables. The experiments are conducted on 12 subjects of different age groups, and the environments cover lab, office, apartment, mall, coffee shop, plaza, walk way, and so on. The results show AutoTag achieves an average TP rate of 92.3% and FP rate of 5%, and it is robust for devices wearing at different positions, including neck, wrist, and waist. ACKNOWLEDGMENT The research was supported in part by grants from China NSFC under Grant 61502114, 61173156, 973 project 2013CB329006, RGC under the contracts CERG M-HKUST609/13, 622613, 16212714, and 16203215, ITS/143/14FP-A, JCYJ20160331115457945, JCYJ20160531190935987, as well as the grant from Huawei-HKUST joint lab, IoT WiFi key technologies. R EFERENCES [1] S. Rallapalli, A. Ganesan, K. Chintalapudi, V. N. Padmanabhan, and L. Qiu, “Enabling physical analytics in retail stores using smart glasses,” in Proc. ACM MobiCom, 2014, pp. 115–126. [2] S. Jain, C. Borgiattino, Y. Ren, M. Gruteser, Y. Chen, and C. F. Chiasserini, “Lookup: Enabling pedestrian safety services via shoe sensing,” in Proc. ACM MobiSys, 2015, pp. 257–271. [3] C. Cornelius, R. Peterson, J. Skinner, R. Halter, and D. Kotz, “A wearable system that knows who wears it,” in Proc. ACM MobiSys, 2014, pp. 55–67. [4] Y. Ren, Y. Chen, M. C. Chuah, and J. Yang, “Smartphone based user verification leveraging gait recognition for mobile healthcare systems,” in Proc. IEEE SECON, 2013, pp. 149–157. [5] A. Srivastava, J. Gummeson, M. Baker, and K.-H. Kim, “Step-bystep detection of personally collocated mobile devices,” in Proc. ACM HotMobile, 2015, pp. 93–98.
[6] J. Ryckaert, P. De Doncker, R. Meys, A. de Le Hoye, and S. Donnay, “Channel model for wireless communication around human body,” IET Electronics letters, vol. 40, no. 9, pp. 543–544, 2004. [7] D. McNamara, C. Pistorius, and J. Malherbe, “The uniform geometrical theory of diffraction,” Artech House, London, 1990. [8] R. Pethig, “Dielectric properties of body tissues,” Clinical Physics and Physiological Measurement, vol. 8, no. 4A, p. 5, 1987. [9] F. Di Franco, C. Tachtatzis, B. Graham, D. Tracey, N. F. Timmons, and J. Morrison, “On-body to on-body channel characterization,” in Proc. IEEE Sensors, 2011, pp. 908–911. [10] Y. Wang, J. Liu, Y. Chen, M. Gruteser, J. Yang, and H. Liu, “E-eyes: device-free location-oriented activity identification using fine-grained wifi signatures,” in Proc. ACM MobiCom, 2014, pp. 617–628. [11] F. Adib, Z. Kabelac, D. Katabi, and R. C. Miller, “3d tracking via body radio reflections,” in Usenix NSDI, 2014, pp. 317–329. [12] M. E. Davies and C. J. James, “Source separation using single channel ica,” Elsevier Signal Processing, vol. 87, no. 8, pp. 1819–1832, 2007. [13] N. Golyandina, V. Nekrutkin, and A. A. Zhigljavsky, Analysis of time series structure: SSA and related techniques. CRC press, 2001. [14] A. Hyv¨arinen, J. Karhunen, and E. Oja, Independent component analysis. John Wiley & Sons, 2004, vol. 46. [15] L. Kaufman and P. J. Rousseeuw, Finding groups in data: an introduction to cluster analysis. John Wiley & Sons, 2009, vol. 344. [16] H. Ding, G. Trajcevski, P. Scheuermann, X. Wang, and E. Keogh, “Querying and mining of time series data: experimental comparison of representations and distance measures,” VLDB, vol. 1, no. 2, pp. 1542– 1552, 2008. [17] Z. H. Hu, Y. I. Nechayev, P. S. Hall, C. C. Constantinou, and Y. Hao, “Measurements and statistical analysis of on-body channel fading at 2.45 ghz,” IEEE Antennas Wireless Propag. Lett, vol. 6, pp. 612–615, 2007. [18] M. Kim and J.-I. Takada, “Statistical model for 4.5-ghz narrowband on-body propagation channel with specific actions,” IEEE Antennas Wireless Propag. Lett, vol. 8, pp. 1250–1254, 2009. [19] Y. Xiong and F. Quek, “Hand motion gesture frequency properties and multimodal discourse analysis,” Springer International Journal of Computer Vision, vol. 69, no. 3, pp. 353–371, 2006. [20] “Lumo Back, http://www.lumobodytech.com/lumoback.” [21] T. Vu, A. Baid, S. Gao, M. Gruteser, R. Howard, J. Lindqvist, P. Spasojevic, and J. Walling, “Distinguishing users with capacitive touch communication,” in Proc. ACM MobiCom, 2012, pp. 197–208. [22] S. Chen, A. Pande, and P. Mohapatra, “Sensor-assisted facial recognition: an enhanced biometric authentication system for smartphones,” in Proc. ACM MobiSys, 2014, pp. 109–122. [23] V. Srinivasan, J. Stankovic, and K. Whitehouse, “Using height sensors for biometric identification in multi-resident homes,” in Springer Pervasive Computing, 2010, pp. 337–354. [24] E. Hayashi, M. Maas, and J. I. Hong, “Wave to me: user identification using body lengths and natural gestures,” in Proc. ACM CHI, 2014, pp. 3453–3462. [25] F. Adib and D. Katabi, “See through walls with wifi!” in Proc. ACM SIGCOMM, 2013, pp. 75–86. [26] Q. Pu, S. Gupta, S. Gollakota, and S. Patel, “Whole-home gesture recognition using wireless signals,” in Proc. ACM MobiCom, 2013, pp. 27–38. [27] G. Wang, Y. Zou, Z. Zhou, K. Wu, and L. M. Ni, “We can hear you with wi-fi!” in Proc. ACM MobiCom, 2014, pp. 593–604. [28] O. J. Kaltiokallio, H. Yigitler, R. J¨antti, and N. Patwari, “Non-invasive respiration rate monitoring using a single cots tx-rx pair,” in Proc. ACM IPSN, 2014, pp. 59–70. [29] Y. Wang, J. Yang, Y. Chen, H. Liu, M. Gruteser, and R. P. Martin, “Tracking human queues using single-point signal monitoring,” in Proc. ACM MobiSys, 2014, pp. 42–54. [30] T. Alves, B. Poussot, and J.-M. Laheurte, “Analytical propagation modeling of ban channels based on the creeping-wave theory,” IEEE Trans. Antennas Propag, vol. 59, no. 4, pp. 1269–1274, 2011. [31] L. Shi, M. Li, S. Yu, and J. Yuan, “Bana: body area network authentication exploiting channel characteristics,” IEEE Journal on Selected Areas in Communications, vol. 31, no. 9, pp. 1803–1816, 2013.