pages 193â202, May 28â30 2001. [16] K. G. Nguyen and D. Saupe. Rapid high quality compres- sion of volume data for visualization. Computer Graphics.
Volume Visualization on Mobile Devices Hong Zhou Huamin Qu Yingcai Wu Ming-Yuen Chan Department of Computer Science and Engineering Hong Kong University of Science and Technology {zhouhong,huamin,wuyc,pazuchan}@cse.ust.hk Abstract With the advent of high-bandwidth wireless networks and pervasive computing, the space and platform barriers for visualization are being broken. Mobile visualization, or ubiquitous visualization, allows users to visualize data anywhere, anytime, on various mobile devices connected by wireless networks. In this paper, we investigate how to achieve volume visualization on mobile devices. We present a client-oblivious data model for various visualization tasks on mobile devices ranging from powerful workstations to PDAs and cell phones. Our model integrates volumes and some pre-computed features, such as iso-surfaces, into one hierarchical structure, which can be compressed and progressively transmitted over networks. Two novel algorithms are introduced. One is for mesh reconstruction from point-based models and the other is for volume reconstruction from surfacebased models. The construction, compression, and transmission of our data model are presented.
1. Introduction Visualization provides a way of seeing the unseen for scientists, physicians, and engineers, and thus has a wide range of important applications. The data to be visualized are usually so large that powerful computers with 3D graphics hardware are required. This limits the application of visualization. Wireless networks and pervasive computing provide new opportunities for visualization. The performance of various mobile devices such as PDAs and cell phones has improved rapidly. Some new models of cell phones are equipped with 3D dedicated graphics chips and have 352 x 416 resolution color display screens. In addition, some 3D graphics APIs for mobile devices such as OpenGL ES have been developed and they are supported by many prevalent mobile phones. These developments have made mobile devices the largest potential platforms for 3D graphics and visualization.
We use the term “mobile visualization” to refer to visualizing data stored in a server using mobile devices in a pervasive computing environment. Mobile visualization will make visualization more accessible, more useful, and thus benefit more people. Mobile visualization is a challenging research problem. It is different from remote visualization or network visualization. There are two major challenges for mobile visualization. The first is the great diversity of mobile devices, wireless networks, and visualization tasks. Clients in a pervasive computing environment can range from very powerful mobile workstations with advanced graphics hardware to PDAs and cell phones with very limited computing and graphics capacity. The wireless networks may also have different bandwidths and traffic loads. The visualization tasks can range from previewing to accurate diagnosis. The second is the limited CPU and GPU resources for low-end mobile devices such as mobile phones. Many mobile devices only have primitive graphics capacity. Therefore, traditional visualization methods may no longer be suitable. In addition, the display screens of many mobile devices are relatively small. Even though the resolutions of the display screens of mobile devices are increased steadily, their physical sizes are almost the same and still relatively small for visualization purposes. In this paper, we address these two issues for mobile visualization and investigate how to achieve volume visualization on mobile devices, especially PDAs and cell phones that have limited resources and are usually not considered appropriate platforms for visualization. To address the diversity issue of mobile visualization, we introduce a new client-oblivious data model. Our client-oblivious data model is a highly adaptive hierarchical structure integrating points, meshes, and volumes into one uniform representation. The server does not need to know the configuration of clients and simply transmits our model to any client. The client side can reconstruct a point-based representation, a surface-based representation, or a volume representation from our model and render it using different methods based on its CPU and GPU capacities. We change the encoding scheme of volumes so that the most important information
will be encoded and transmitted first. The model will be transmitted from simple representation (i.e., point) to complex representation (i.e., volume) and from low resolution to high resolution. Therefore, meaningful results can be achieved for various mobile devices after receiving the first few packets from the servers. The primary contributions of this paper are: • We investigate how to achieve volume visualization on mobile devices in a pervasive computing environment, which we term mobile visualization. We discuss the special challenges, potential applications, and different strategies for mobile visualization. • We propose a client oblivious framework for mobile visualization. Our framework is tailored for mobile devices which may have a great diversity of CPU and GPU capacities. Optimal visualization can be achieved using our framework without the knowledge of the configurations of the mobile devices. • We develop a point-based scheme to encode isosurfaces. The iso-surfaces are encoded using occupancy images, which allows the efficient construction and rendering of point-based iso-surfaces on lowend mobile devices. The occupancy images are followed by a little more information about connectivity so mesh-based iso-surfaces can be accurately constructed for high quality rendering. • We develop an importance-based scheme to encode volumes based on sign images for iso-surfaces. We first encode the most salient iso-surface in a volume using a binary sign image. Then, the rest of the sign images will gradually refine this iso-surface and shrink the possible density range for each voxel until the original volume can be accurately reconstructed for direct volume rendering. This paper is organized as follows. After introducing previous work in Section 2, we present our client-oblivious framework for mobile visualization in Section 3. The data model is introduced along with the reconstruction and compression methods in Section 4. We present our experimental results in Section 5. Finally, we conclude and suggest some future directions in Section 6.
2. Previous Work Visualization over Network Based on how visualization tasks are distributed between the client side and the server side, visualization over network can be classified into thin client mode, fat client mode, and balanced mode. An excellent survey on this topic can be found in [13]. One simple solution for remote visualization is to use a high-end graphics server finishing all the complex com-
putations. A low-end graphics client then just needs to display the rendered image received from the server [7, 10, 14]. This approach is usually called thin-client mode because of the light workload on the client side. However, those systems cannot effectively use the graphics hardware in local clients, which will be more powerful and cheaper in the future. Furthermore, unlike images, 3D graphics models are usually examined from different angles. Therefore, many frames have to be transmitted in real time for a visualization process. Many simultaneous requests from multiple clients may easily overwhelm the network bandwidth and computing capacity of the server. The balanced mode distributes the visualization pipeline between server and client. For example, the server calculates the geometry from the original data set and the client renders the result [5]. Luke and Hansen [13] presented a flexible remote visualization framework which distributes the visualization tasks between server and client based on the network bandwidth, latency, and computational power of client and server. The balanced mode exploits the computing and graphics capacities of both client side and server side and thus is an ideal choice for mobile visualization. In the fat client mode [17], most visualization tasks are performed on the client side. For example, a low-end graphics server just filters the data and leaves the geometry calculation and rendering to the client. This approach can take full advantage of the local graphics hardware of clients. With the rapid improvement of the performance of mobile devices, this mode is also a candidate for mobile visualization. The major challenge for the fat client mode is how to efficiently transmit large graphical models over networks. Compression of Iso-surfaces and Volumes No matter which strategy is used, network bandwidth is usually a major bottleneck. Therefore, data compression is very important. For mobile visualization, we are more interested in how to compress and transmit iso-surfaces and volumes. Marching Cubes [12] is the widely used iso-surfacing method. Efficient compression methods [20, 22] for meshes from Marching Cubes have been developed. A progressive encoding method [11] has also been presented for meshes extracted using SurfaceNets. Mroz and Hauser [15] proposed a method to encode the boundaries in a volume slice by slice, but they did not exploit the coherence between boundaries contained in different slices like arithmetic coding methods [11, 22]. A special iso-surface extraction technique [6] has been proposed for web-based volume visualization. Wavelet transformations [9, 16, 21] have been demonstrated to be an effective way to compress volumetric and time-varying volumetric data sets. Point-Based Models Compared with meshes, point-based models are compact because all connectivity information, which may be irrelevant if only rendering is concerned, is discarded. Using points to represent surfaces has a long
Point-Based Model Iso-Surface Encoding
Occupancy Image
Extra Information
Packing Eight Extended Sign Images
Server
Client-Oblivious Model
Connectivity
Mesh Reconstruction
Contents
Volume Reconstruction
Decompression
Volume Encoding
Salient Sign Image
Compression
Volume Data
Client
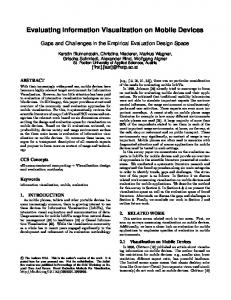
Figure 1. Our framework. history and has been well studied [1, 19]. Some researchers have integrated the point and surface representations [2, 3]. Botsch et al. [1] introduced a compact point-based geometry. Qu and Kaufman [18] proposed the O-buffer presentation as a uniform framework for point-based rendering. Duguet and Drettakis [4] proposed flexible point-based rendering on mobile devices.
3. Client-Oblivious Framework Mobile visualization can be used in many environments. We will use a clinical application as an example and our target application. In such an application, patient data, such as CT and MRI, are stored in a central server in the hospital and physicians can access these data using any device. Typically, a physician can download the patient data into his or her mobile device for a quick preview. Then, the physician can start to explore the patient data using a desktop PC in his or her office and make some initial diagnosis. During this process, the physician may need to walk into another office and discuss the case with his or her colleagues using a pocket PC or laptop. The initial diagnosis can be confirmed or improved in a powerful workstation with volume rendering. Finally, the physician may walk into the patient’s room and pull out his or her PDA or cell phone and explain the diagnosis and treatment plan to the patient. To handle these different visualization tasks on different mobile devices, we propose a client oblivious framework. Our framework has three major features. The first feature is hybrid representation and smooth transition. For different devices and tasks, the optimal rendering method may be different. Point-based rendering may be suitable for mobile devices while surface-based rendering may be suitable for low-end notebooks and volume rendering may be suitable for high-end mobile workstations. Our method can integrate these models into one uniform representation which has little redundancy and provides smooth transition
among different representations. The second feature is hierarchical structure and progressive transmission. Our model will be transmitted from low to high resolution. Therefore, if users are not interested in the data or the client is overwhelmed by the size of the model, the transmission can be simply stopped. The third feature is importance-based encoding and effective visualization in the shortest time. We carefully change the encoding scheme to make sure that the most salient iso-surface is transmitted first. Based on these three features, we can achieve client oblivious representation and transmission on the server side. We can simply transmit this representation to any client without knowing its configuration and leave the task of choosing suitable representations to the client. Figure 1 shows our framework.
4. Iso-Surface and Volume Encoding Because of the limited resources in some clients, transmitting the whole volume and visualizing it using direct volume rendering is not efficient. Thus, we believe that precomputing some iso-surfaces on the server side as a preprocessing is a practical solution for mobile visualization. In this section, we start from our point-based representation for iso-surfaces and we then introduce how to reconstruct the surface-based representation from our point-based representation and how to recover the original volume from our surface-based representation. The compression methods for our model are also discussed.
4.1. Occupancy Image Iso-surfaces are important features in scientific data. Typically, iso-surfaces can be extracted using either Marching Cubes [12] or SurfaceNets [8]. Both methods start from computing the sign image, which represents whether the intensity of each voxel is larger or smaller than an iso-value.
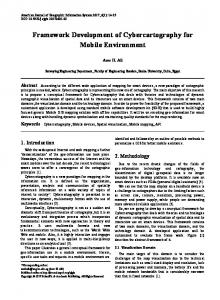
Sign bit stream: 0110
Scanline order
(a)
(b)
(c)
Figure 2. Different ways to encode geometry of an iso-surface: (a) Sign Image; (b) Occupancy Image; (c) The sign bit stream. The sign image can be computed from the occupancy image and the sign bit stream. The sign image can represent the inside/outside information for each voxel and an iso-mesh can be easily extracted from the sign image. Therefore, previous work on iso-surface compression usually uses sign images. Figure 2a shows a sign image. For low-end mobile devices, the iso-meshes may not be rendered efficiently. In this case, point-based rendering is a better choice because point-based models are more compact and can be rendered more efficiently using pure software. If point-based rendering is used, then occupancy images which represent whether an iso-surface passes through a cell or not will be more efficient. We can immediately generate a point in a cell and render it once a bit from the occupancy image is received. Figure 2b shows an occupancy image. Computing the occupancy image from the sign image is straightforward. For each cell, we collect the eight voxels of this cell. If these voxels have different signs, then this cell is occupied by the iso-surface and there will be an iso-point in this cell. However, directly computing the occupancy image from the sign image on mobile devices with limited resources may be inefficient because of the small cache size. The eight voxels are not adjacent along the scanline and thus have to be brought into cache first. Therefore, our method will store and transmit occupancy images instead of sign images, which allows efficient construction of point-based models for low-end mobile devices. One disadvantage of the occupancy image is that it cannot uniquely decide the geometry or connectivity information. If a geometry representation is needed for higher quality rendering on mobile devices with graphics chips, we may still need the sign image. Some methods store and transmit both the sign image and the occupancy image, which result in redundancy. We design an algorithm which can extract the sign image from the occupancy image with a little bit extra connectivity information for special voxels (See Section 4.2). By this way, we can reduce the redundancy and save memory, space, and bandwidth. To summarize, our iso-surface representation consists of
an occupancy image which represents iso-points and some extra information which represents connectivity for isomeshes. This is the major difference between our method and some previous methods. Our approach has the following advantages: • Our hybrid model works well no matter whether a mobile device has a graphics card or not. For low-end clients, a point-based model can be immediately constructed and rendered after the occupancy image is received. For high-end clients, this point-based model will be refined to a mesh-based model after a little bit extra connectivity information is received. • Compared with the sign image, the occupancy image is more sparse and provides more flexibility for compression. For example, the occupancy image can be compressed by chain coding, arithmetic coding, and PNG (or JPEG), which will be discussed later. Please notice that the occupancy image we used is different from [22]. The occupancy image in [22] is actually the sign image in our paper. We believe that the occupancy image is a more appropriate term to describe whether a cell in the image is occupied by an iso-point.
4.2. Sign Image Reconstruction from Occupancy Image After we store the occupancy image, the sign image can be recovered with additional information. Our method is based on the following observations. If a cell is not occupied, then all eight voxels associated to this cell in the occupancy image have the same sign. Thus there will be no sign changes along all six edges in this cell. For each edge in the sign image, there are typically four cells sharing this edge. If any of these four cells are not occupied, then there will be no sign change along this edge and we can guarantee that this edge is not pierced by the iso-surface. If an edge is not pierced, then two voxels sharing this edge will have the same sign. We will compute the sign for each voxel along the scanline order. Suppose all the signs for previous voxels along the scanline have already been computed. Then, for the current voxel, we check the three edges connecting this voxel to its three neighboring voxels with known signs. From the occupancy image, we can decide whether any one of the three edges is unpierced by checking if any cell sharing these three edges is not occupied. If we find one unpierced edge then the sign for the current voxel can be decided immediately. It is simply the same sign value of the neighboring voxel sharing this unpierced edge. Unless all these three edges are pierced, we cannot immediately decide the sign for this voxel. In this case, we just simply store the sign for this voxel. Based on our experiment with some typical datasets, the number of these special voxels
is only a small percentage of the total number of voxels Please notice that we do not need to store the location of the special voxels. Because the encoding and decoding use the same scanline order, we only need to store all the sign values for the special voxels along the scanline order into a bit stream. Figure 2c shows our method of reconstructing the sign image from the corresponding occupancy image. The pseudo-code of our method is shown in Algorithm Reconstruct Sign Image. Algorithm Reconstruct Sign Image Input: An occupancy image and a sign bit stream for special voxels Output: A corresponding sign image 1. Get the sign for the first voxel of the scanline from the sign bit stream 2. for The next voxel along the scanline 3. do Check the edges shared by this voxel and its neighboring voxels with known sign values 4. if Any edge is unpierced 5. then Set the sign value for this voxel to be the sign value of its neighboring voxel sharing this edge 6. else Get the sign value for this voxel from the sign bit stream 7. Repeat this process until all signs are computed and all meshes are reconstructed This method is very efficient because it uses a procedure similar to the Marching Cubes algorithm. The only extra effort is to get the sign value for special voxels from a stored bit stream. The occupancy image and the connectivity bit stream are stored, compressed, and transmitted separately. By this way, we can avoid transmitting both sign images and occupancy images. Thus, redundancy is reduced and a smooth transition from point-based iso-surfaces and meshbased iso-surfaces can be achieved.
4.3. Volume Reconstruction from Sign Images In the last section, we introduced how to recover the sign image from the occupancy image with a little extra information to construct a mesh-based iso-surface. One sign image can only represent one iso-surface. If multiple iso-surfaces are needed, then multiple sign images have to be transmitted. In addition, for some visualization tasks to be achieved on high-end mobile devices, direct volume rendering is required so the whole volume has to be available. If we directly transmit the whole volume bit plane by bit plane, then the most salient iso-surface may not be constructed without receiving the whole volume. Therefore, visualization cannot start immediately. If we first transmit sign images
for salient iso-surfaces followed by the whole volume, there will be redundancy and extra information is transmitted. To solve this problem, we propose a new encoding scheme for volumes. We first compute the sign image for the most salient iso-surface. This sign image is called the base sign image and will be the first bit plane to be transmitted. Then the rest of the bit planes will refine this base sign image and gradually shrink the possible density range for each voxel. Without loss of generality, in the rest of this paper, we assume that the scalar value of the input volume ranges from 0 to 255. Our method is based on the following observation. Suppose the base sign image represents an iso-surface with density value f 0 . Then this sign image encodes a possible density range for each voxel. For example, if the sign value for a voxel is 1, then the density value of this voxel will be in the range 0 to f 0 . Otherwise, it will be from f 0 to 255. To refine this iso-surface and to finally reconstruct the original volume, the rest of the bit planes just needs to gradually shrink this possible range for each voxel until an exact density value can be obtained. To do so, we just keep computing the sign value for the median density of the possible density range. Then after each bit plane, the possible density range will be halved. For example, if the sign value is 1 which means the density is in the range 0 to f 0 , then for the next bit plane, we just compute the sign value for f 0 /2. Depending on the result, the next density range will be either in 0 to f 0 /2 or f 0 /2 to f 0 . This is a binary search problem and the number of totally bit planes needed will be no more than 9. For example, if the original density value for a voxel is 110 and the most salient iso-value is 50, then this density value can be encoded as 10110110. The pseudo-code for this process is shown in Algorithm Reconstruct Volume. The construction of this series of bit planes and reconstruction of the original volumes from these bit planes are easy to implement and can be computed efficiently. Compared with traditional bit plane representations for volumes, our encoding scheme has the following desirable features: 1. Our encoding scheme can deliver the most salient iso-surface after transmitting the first bit plane. Therefore, meaningful visualization can be achieved in the shortest time. This iso-surface can be more efficiently refined (i.e., more precise vertex positions and normals) by our bit planes than by traditional bit planes while the whole volume is being reconstructed. Our representation has little redundancy and the size of total bit planes transmitted in our method is similar to the size of the original volume. The traditional bit plane representation for volumes is only a special case of our scheme when the iso-value is 128. 2. Three salient iso-surfaces can be encoded using only two bit planes based on our method. For example, if the iso-surfaces for iso-value 30, 50, and 120 are requested,
we can first compute the base sign image for the median iso-value 50. For all voxels with the sign value 1 in the base sign image, we only need to encode the sign for iso-value 30 in the second bit plane because the sign for 120 will still be 1. Similarly, for all voxels with sign value 0, we only need to encode their signs for 120 in the second bit plane. Therefore, the sign images for three iso-values, and thus three iso-surfaces, can be encoded using two bit planes. Algorithm Reconstruct Volume Input: One base sign image and eight extended sign images Output: The corresponding volume data 1. According to the base sign image and the iso-value f 0 , initialize the density interval for each voxel to be either [0, f0 ) or [ f 0 , 255). Lower and U pper denote the lower and upper boundaries of the interval respectively. Set Median of the interval to be (Lower + U pper + 1)/2. 2. for Each extended sign image 3. do for Each voxel 4. do Read the corresponding sign bit from the extended sign image 5. if It is 1 which means the original scalar value is less than the Median of the current interval 6. then Set U pper equal to Median 7. else Set Lower equal to Median 8. Update Median 9. for Each voxel 10. do Set Median to be (Lower + U pper)/2 11. Output Median to be the scalar value of this voxel
4.4. Normal Normals are important for rendering iso-surfaces. Computing normals directly from sign images and reconstructed volumes is a burden for low-end clients. It is also not practical to pre-compute normals for all points and transmit them to the client from the server because the size of normals are usually large. We propose a heuristic method to compute normals for iso-points on low-end clients. There are only 256 possible cases for a binary cell. We can pre-compute a look-up table for normals for all these possible binary cells just like Marching Cubes. Because it is a binary cell and we assume that the iso-points are all in the center of cells, the normal for an iso-point in a cell can be uniquely determined by this cell. This normal table will be transmitted and stored into a client only once during configuration time. During rendering time, we can retrieve the normal for each iso-point by looking it up in the table. Then, for each point, we average the normal with the normals of neighboring cells and
use the averaged normal to render this point. Based on our experiment, the results are acceptable on mobile phones.
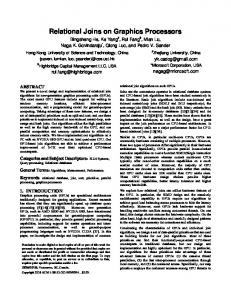
4.5. Compression We propose two compression methods for the occupancy image: by using arithmetic coding and by using PNG or JPEG (see Figure 3). The occupancy image is a bi-level image. The JBIG2 is the state-of-the-art standard to compress bi-level images. We first introduce how to compress occupancy images using JBIG2. Our approach is very similar to some former methods [11, 22]. Compared with 2D bi-level images, the occupancy images show strong coherence between neighboring slices. Thus, we use the adaptive context-based arithmetic coding method in JBIG2 to encode occupancy images. We adopt the 7-bit context introduced in [22] which is shown in Figure 3(a).
(a)
(b)
Figure 3. Compression of the occupancy image: (a) Arithmetic coding with the 7-bit context. (b) PNG or JPEG compression for six depth images (two of them are shown in the figure). One major problem of iso-surface compression using JBIG2 is to design the context to take advantage of the sliceto-slice coherence. The compression ratio highly depends on the chosen context. However, the context usually depends on application and it takes many trial-and-errors to find a good one. To solve this problem, we propose another method by projecting the slice-to-slice coherence into six gray-scale depth images. Our method then uses these six depth images to represent the iso-surface. Figure 3(b) shows our method. For each volume, we project the depth of the first occupied cells onto each of the six bounding surfaces. Then we get six gray-scale depth images, which can be compressed using standard gray-scale image compression methods such as PNG and JPEG. Based on our experiment results, the performance of PNG is consistently better than that of JPEG for lossless compression. However, the lossy modes of JPEG may be useful for some applications. This method has some major advantages. The approach is general and the slice-to-slice coherence is naturally repre-
Table 1. Compression ratios for different datasets using different compression methods. AC represents 7-bit context arithmetic coding. “Iso.” represents iso-value. “Connectivity” refers to the sign bit stream. The lossless JPEG and PNG compressions are used. The numbers in the first column of “Connectivity” are the size of the bit stream without compression. The numbers in the parentheses represent the compression ratios. The experiment is conducted on an IBM T42 notebook.
Name CT Head Tomato Aorta Aneuyrism
Data Resolution 256 × 256 × 225 256 × 256 × 64 512 × 512 × 174 512 × 512 × 512
Iso. 50 30 150 40
Sign Image AC 39k (2.2%) 67k (12.9%) 114k (2.0%) 80k (0.5%)
AC 60k (3.3%) 68k (13%) 135k (2.4%) 120k (0.7%)
Occupancy Image JPEG PNG 93k (5.2%) 56k (2.6%) 42k (8.0%) 31k (6%) 254k (4.5%) 104k (1.8%) 537k (3.2%) 203k (1.2%)
Connectivity AC 6.4k 3.6k 23k 21k 41k 28k 8k 5k
Table 2. Time performance. “# Primitive” refers to the number of generated primitives. Algorithm Nokia N90 IBM T42 Computational time # Primitive Computational time Sign Image Reconstruction 1.05 s / 0.08 s Marching Cubes 12.53 s 48806 triangles 0.78 s SurfaceNets 11.85 s 74543 triangles 0.74 s Point-Based Rendering 1.80 s 33555 points 0.26 s sented in the six depth images. The JPEG and PNG codecs are widely available and can be accelerated using hardware. The disadvantage of this method is that some voxels on the iso-surfaces may not be visible in all six depth images. For those few voxels we can either discard them or compress them separately using JBIG-2.
5. Experimental Results We built a system consisting of a server and multiple mobile devices as clients to test the effectiveness of our method. On the server side we used a Pentium(R) 3.2GHz PC with 1GB RAM and the display card on the PC was an Nvidia Geforce 6800 Ultra with 256MB RAM. The highend client in our experiment was an IBM T42 laptop with a 1.7GHz Pentium CPU, 512MB of RAM. To test our model on low-end clients, we used two smart phones, a Nokia 6680 with ARM5, 10M flash and 128M MMC, and a Nokia N90 with ARM5, 26M flash and 128M MMC. Some experiments for the mobile phones were conducted on a Nokia series 60 emulator with Symbian OS 8.1a. The data was transmitted from the server to the high-end client via a highbandwidth wireless network, and to the low-end client via bluetooth. Our first experiment tested the effectiveness of our reconstruction algorithm for sign images from occupancy images and our compression algorithms. Table 1 shows the results for four datasets using different compression methods. From the table, we can see that the size of the connectivity information represented by the sign bit stream is
relatively small compared with that of the sign image or occupancy image. Therefore, it is an effective way to divide the geometry of an iso-surface into an occupancy image part and a sign bit stream part. The sign image can usually be compressed more than the occupancy image using the 7-bit context. But the difference is small. We believe that this is due to the context we chose. PNG can usually attain a better compression rate than JPEG and arithmetic coding. Table 2 shows the time performance for different operations. To compare the time performance on both the lowend client and the high-end client, we use the same dataset to do the experiments. A down-sampled CT head data (64 × 64 × 115) is tested on the Nokia N90 smart phone and the high resolution data (128 × 128 × 231) is for the IBM notebook. All the rendering algorithms tested in this experiment use a heuristic method (See Section 4.4) to compute normals. From the table we can see that point-based rendering runs much faster than surface-based rendering. On the notebook, the computational time of point-based rendering is about 3 times faster than that of surface-based rendering, while on the smart phone it is about 7 times faster. The different performance may be caused by the limited cache size on the smart phone. Point-based models are more compact than surface-based ones. Thus, on the smart phone most computational time for surface-based rendering is spent on the data swapping. Our next experiment tested the effectiveness of our volume encoding scheme based on sign images. We encoded the most salient iso-surface, the foot face in our case, as the base sign image and it was transmitted first. Figure 4 com-
methods on different mobile devices. Figure 5a shows a point-based iso-surface extracted from the occupancy image and rendered on a Nokia 6680. Figure 5b shows a meshbased iso-surface extracted from the occupancy image plus the extra sign bit stream and rendered on the IBM T42. Our method is highly adaptive and can generate optimal visualization results on different mobile devices. Even for lowend clients, our model can also deliver quick preview and useful information at the very beginning. Figure 6 shows the whole visualization process on the IBM T42. The progressively refined point-based model is transmitted first. Figure 6(a) is a primitive point-based rendering result after receiving 5% of the whole clientoblivious data model. The final refined point-based model is shown in Figure 6(b). A bit extra information follows the point-based model so that users can reconstruct the surfacebased model for the iso-surface (See Figure 6(c)). Finally, the original volume can be recovered after receiving other sign images. An image by direct volume rendering is shown in Figure 6(d).
Figure 4. Comparison of two volume encoding methods for salient iso-surface extraction after receiving each bit plane. The left column shows the results by our method and the right column shows the results of the traditional method. pares our sign-image-based volume representation and the traditional volume representation. Each row of the left column of Figure 4 shows an iso-surface reconstructed by our method after receiving one more sign image represented as an occupancy image plus some extra connectivity information. Each row of the right column shows the result after receiving one more bit plane from a traditional volume. From the figure, we can clearly see that meaningful visualization can be achieved much faster using our method. The most salient iso-surface can be visualized after receiving the first bit plane. For the traditional method, to achieve the same result, at least four bit planes had to be transmitted. This feature of our method is especially useful for low-end clients and low-bandwidth networks. Figure 5 demonstrates the hybrid feature of our method. Different representations can be extracted from our clientoblivious model and can then be rendered using different
(a)
(b)
Figure 5. Different Iso-surface representations extracted from our model: (a) pointbased iso-surface on a mobile phone; (b) mesh-based iso-surface on a notebook.
6. Conclusions and Future Work In this paper, we investigated how to achieve volume visualization on mobile devices. We proposed a clientoblivious framework which is hybrid, progressive, and adaptive. We focused on providing a data model which can be rendered on different mobile devices ranging from powerful workstations to mobile phones. Meaningful results can be achieved after receiving the first few packages. We introduced two novel techniques which can reconstruct sign images from occupancy images and volumes from sign images. The transmission order of our sign images is tailored for mobile visualization and some salient iso-surfaces can be reconstructed from the first few sign images. In the future, we plan to investigate the impact of network bandwidth and error of transmission on mobile devices. Selective visualization which allows users to view only a subregion of a volume is also worth further study.
(a)
(b)
(c)
(d)
Figure 6. The whole visualization process: (a) The iso-surface after receiving 5% of the point-based model; (b) The iso-surface after receiving the whole point-based model; (c) The iso-surface after reconstructing the surface-based model; (d) The direct volume rendering result after recovering the original volume.
Acknowledgments We wish to thank our anonymous reviewers for their thoughtful recommendations. This work is supported by RGC grant CERG 618705 and HKUST grant DAG 04/05 EG02.
[11]
References
[13]
[1] M. Botsch, A. Wiratanaya, and L. Kobbelt. Efficient high quality rendering of point sampled geometry. Proceedings of Eurographics Rendering Workshop, pages 53–64, 2002. [2] B. Chen and M. X. Nguyen. POP: a hybrid point and polygon rendering system for large data. Proceedings of IEEE Visualization, pages 45–52, 2001. [3] J. D. Cohen, D. G. Aliaga, and W. Zhang. Hybrid simplification: combining multi-resolution polygon and point rendering. Proceedings of IEEE Visualization, pages 37–44, 2001. [4] F. Duguet and G. Drettakis. Flexible point-based rendering on mobile devices. IEEE Computer Graphics and Applications, 24(4):57–63, July/Aug. 2004. [5] K. Engel, T. Ertl, P. Hastreiter, B. Tomandl, and K. Eberhardt. Combining local and remote visualization techniques for interactive volume rendering in medical applications. Proceedings of IEEE Visualization 2000, pages 449–452, Oct. 2000. [6] K. Engel, R. Westermann, and T. Ertl. Isosurface extraction techniques for web-based volume visualization. Proceedings of IEEE Visualization ’99, pages 139–146, 1999. [7] J. A. Friesen and T. D. Tarman. Remote high-performance visualization and collaboration. IEEE Computer Graphics and Application, 20(4):45–49, 2000. [8] S. Gibson. Using distance maps for accurate surface representation in sampled volumes. Proceedings of IEEE/SIGGRAPH Symposium on Volume Visualization and Graphics, pages 23–30, 1998. [9] S. Guthe, M. Wand, J. Gonser, and W. Strasser. Interactive rendering of large volume data sets. Proceedings of IEEE Visualization 2002, pages 53–60, 2002. [10] N. T. Karonis, M. E. Papka, J. Binns, J. Bresnahan, J. A. Insley, D. Jones, and J. M. Link. High-resolution remote
[14]
[12]
[15]
[16]
[17]
[18]
[19]
[20]
[21]
[22]
rendering of large datasets in a collaborative environment. Future Gener. Comput. Syst., 19(6):909–917, 2003. H. Lee, M. Desbrun, and P. Schroder. Progressive encoding of complex isosurfaces. ACM Transactions on Graphics, 22(3):471–476, 2003. W. E. Lorensen and H. E. Cline. Marching cubes: a high resolution 3D surface construction algorithm. Proceedings of SIGGRAPH, pages 163–170, 1987. E. Luke and C. Hansen. Semotus visum: A flexible remote visualization framework. Proceedings of the IEEE Visualization 2002, pages 61–68, 2002. K.-L. Ma and D. M. Camp. High performance visualization of time-varying volume data over a wide-area network status. Proceedings of the 2000 ACM/IEEE conference on Supercomputing, page 29, 2000. L. Mroz and H. Hauser. Space-Efficient boundary representation of volumetric objects. Proceedings of the Joint Eurographics - IEEE TCVG Symposium on Visualizatation, pages 193–202, May 28–30 2001. K. G. Nguyen and D. Saupe. Rapid high quality compression of volume data for visualization. Computer Graphics Forum, 20(3), 2001. S. Prohaska, A. Hutanu, R. Kahler, and H.-C. Hege. Interactive exploration of large remote micro-ct scans. Proceedings of IEEE Visualization 2004, pages 345–352, 2004. H. Qu and A. Kaufman. O-buffer: A framework for samplebased graphics. IEEE Transactions on Visualization and Computer Graphics, 10(4):410–421, 2004. S. Rusinkiewicz and M. Levoy. Streaming QSplat: A viewer for networked visualization of large, dense models. Proceedings of I3D, pages 63–68, 2001. D. Saupe and J. Kuska. Compression of isosurfaces. Proceedings of the Vision Modeling and Visualization Conference, pages 333–340, 2001. B. Sohn, C. Bajaj, and V. Siddavanahalli. Feature based volumetric video compression for interactive playback. Proceedings of IEEE symposium on Volume visualization and graphics, pages 89–96, 2002. G. Taubin. BLIC: Bi-level isosurface compression. Proceedings of IEEE Visualization 2002, pages 451–458, Oct. 27– Nov. 1 2002.