Volume 5, Issue 2, Summer2006 Detecting the Cotton Trash Particle Size Distribution in M ill Laydown using HVI ™ Trashmeter Software 1
Jonn A. Foulk1* , David McAlister1 , and K.B. Kulasekera2 Cotton Quality Research Station, P.O. Box 792, USDA-ARS, Clemson, SC 29633, USA 2 Department of Mathematical Sciences, Clemson University, Clemson, SC 29634, USA Corresponding author. Tel.: + 1-864-656-2488, fax: + 1-864-656-1311. E-mail address:
[email protected] ABSTRACT
Cotton trash is known to affect textile -processing efficiency. Removal of cotton trash is a means to improve textile spinning. To combat trash and efficiency problems, textile mills frequently specify that cotton bales, which they acquire, should be no higher than a 3 leaf for processing on Murata Airjet Spinner (MJS) or Murata Vortex Spinner (MVS) equipment. This leaf grade cut-off point is based on past spinning experiences, which point toward processing problems during weaving and excessive loom stops. This research evaluates how High Volume Instrument (HVI™) Trashmeter software analyzes cotton trash and its particle size distribution in a 40-bale textile mill laydown. This study compared the distribution of particles within all bales and how similar these bales were to one another and HVI™ properties throughout the bales. Bales of known and constant leaf grade appear to have different trash particle size distributions. Further work is needed to determine if trash particle distributions provide sufficient information for the measurement of cotton trash in high-speed textile spinning. Keywords: Cotton, trash, bales, quality, High Volume Instrument, textile industry, fiber testing
ease of trash removal. Textile processing is influenced by trash components and according to Deussen (1993), trash is a measured property that can indirectly influence the strength and structure of yarn while directly influencing non-uniformity, imperfections, and yarn breaks.
Introduction One cotton bale contains approximately 60 billion fibers (Steadman, 1997) and unidentified levels of trash and dust particles. Since cotton is produced in the field rather than at a manufacturing facility, it is difficult to control all trash generated in harvesting. Cotton is one of the most important natural fibers with trash analysis typically performed prior to processing. Cottons and their trash components are diverse in nature and respond differently to textile cleaning and further processing. The type and amount of trash, fiber-to-trash adhesion, and how well its behavior mimics a fiber determines the Article Designation: Refereed
Trash particles originate from the cotton plant including different parts of the leaf, stem, bark, seed, and hull or from the local environment including grass, sand, dust and other contamination. Cotton contamination including large trash and small pepper trash is commonly referred to as visible foreign matter. Cotton contains trash with conflicting issues such as leaf vs. 1
JTATM Volume 5, Issue 2,Summer 2006
seed coat, size vs. type, and size vs. distribution. These issues are confounded because trash particles can be difficult to locate, measure, and describe since trash arises from many components and can be irregularly sized, erratically positioned, partly covered by cotton fibers, or light colored in nature. Individuals commonly refer to pepper trash as having a size from 254-1016 µm (0.01 to 0.04 in) (Baker et al., 1992). Mean particle size of trash in normal stock-in process is 240 µm (0.009 in) (Williams, 1988). The International Textile Manufacturers Federation (ITMF) further define dust and trash so that respirable dust falls between 0-15 µm (0-0.0006 in), microdust 15-50 µm (0.0006-0.002 in), dust 0.02 in) (Furter and Schneiter, 1993). The size and size distribution of trash particles are of obvious interest to their impact on spinning.
The HVI™ provides a rapid trash measurement at a low cost using a video camera at one set of conditions. Recent HVI™ software developments are able to rapidly quantify cotton trash and provide a particle frequency distribution (Ghorashi, 2000). As processing speeds increase, continued improvements in measuring cotton are desirable. Improvements are required given that trash levels are the 4th most important property for rotor spinning (behind strength, fineness, and length) and the 2nd most important property (following length) for air jet spinning (Deussen, 1993). New techniques or instruments are necessary to provide rapid, consistent, quantitative, and additional fiber property results with confirmed reliability. The goal is to understand and determine the extent of fiber contamination. Materials and Methods
Standardized testing was developed for cotton trash measurement because trash affects further processing and utilization. Historically, cotton fiber measurements were first performed by humans specially trained to differentiate fibers based on their length, strength, fineness, color, and trash (Shofner and Shofner, 2000). Today, the United States Department of Agriculture (USDA) Agricultural Marketing Service (AMS) classes and grades cotton for a small fee (Agricultural Marketing Service, 1993). These cotton fiber measurements have progressed from a subjective human classer to the objective High Volume Instrument (HVI™). The cotton trash measurement (percentage of surface area) of non-lint materials is obtained using a scanning video camera mounted within the HVI™. This percentage of non-lint surface area is correlated to the classer’s leaf grade (1 through 7 and a ‘below grade’), which is a visual estimate of cotton plant leaf particles in cotton.
Article Designation: Refereed
Cotton Sample bales in this 40 bale laydown were all harvested, ginned, and baled by commercial methods and selected by a local textile mill because of their narrow range of leaf grade officially determined by USDA AMS. To combat trash and efficiency problems, textile mills often specify cotton bales that they purchase should be no higher than a 3 leaf for processing on a Murata Airjet Spinner (MJS) or Murata Vortex Spinner (MVS) (Murata Machinery USA, Inc., Charlotte, NC). This is based on past efforts where textile mills often experience processing problems during weaving with excessive loom stops. Fiber properties (see Table 1 for official classification) used for selection of all cotton bales were determined by HVI™. The HVI™ allows cotton fibers to be tested for length, strength, fineness, color and trash according to established standards (ASTM, 1993).
2
JTATM Volume 5, Issue 2,Summer 2006
Table 1. Official cotton bale classification data* Bale Mic Strength Reflectance Yellowness
1 2 3 4 5 6 7 8 9 10 11 12 13 14 15 16 17 18 19 20 21 22 23 24 25 26 27 28 29 30 31 32 33 34 35 36 37 38 39 40
4.0 4.6 4.6 3.9 4.4 4.0 4.1 4.6 4.3 4.4 4.0 4.2 4.5 4.9 4.6 4.0 4.2 4.6 4.9 3.8 4.0 4.1 4.6 4.1 4.3 4.0 4.2 4.5 4.8 3.8 3.8 4.6 4.6 4.2 4.4 3.8 4.1 4.4 4.7 3.7
(g/tex) 29.7 34.5 34.6 29.1 30.2 31.2 29.9 34.8 31.0 30.8 31.1 29.9 30.3 30.0 34.7 29.8 30.5 32.0 30.2 30.0 31.0 30.6 34.8 29.8 30.3 29.9 30.0 31.8 30.9 31.5 29.6 35.0 34.8 29.9 30.0 32.5 30.7 31.0 29.5 30.3
(Rd)
Trash
(+b) 76 77 74 74 76 76 77 76 76 75 76 77 76 78 75 76 76 77 77 75 76 75 76 76 74 75 75 74 77 75 77 76 76 76 75 75 77 76 77 75
(%) 0.3 0.4 0.3 0.4 0.2 0.3 0.4 0.4 0.3 0.4 0.3 0.3 0.2 0.3 0.5 0.4 0.4 0.3 0.2 0.4 0.3 0.3 0.4 0.2 0.4 0.5 0.5 0.2 0.2 0.3 0.3 0.4 0.5 0.3 0.3 0.3 0.3 0.2 0.3 0.4
8.5 7.1 8.2 8.2 8.6 6.5 8.9 7.4 8.6 8.3 8.9 7.6 6.8 7.6 7.4 8.0 8.7 7.8 7.7 8.6 6.1 8.7 7.6 8.6 8.1 8.1 9.2 8.0 7.7 6.3 8.5 7.3 7.4 8.9 8.6 6.2 8.6 8.2 6.4 8.0
UHM (in) 1.12 1.14 1.14 1.12 1.12 1.18 1.13 1.14 1.13 1.12 1.12 1.15 1.12 1.12 1.15 1.13 1.15 1.13 1.13 1.14 1.15 1.14 1.14 1.12 1.13 1.13 1.14 1.13 1.12 1.14 1.14 1.15 1.14 1.12 1.12 1.17 1.13 1.12 1.16 1.13
UF (%) 82 83 82 82 83 81 83 83 83 83 82 83 82 81 83 82 82 81 81 84 82 83 83 82 84 82 83 83 82 82 83 83 83 83 82 83 83 83 82 82
Leaf
Grade color
Quad color
3 3 3 3 3 3 3 3 3 3 3 3 3 3 3 3 3 3 3 3 3 3 3 3 3 3 3 3 3 3 3 3 3 3 3 3 3 3 3 3
31 41 41 41 31 41 31 41 31 41 31 41 41 31 41 41 31 31 31 31 41 31 41 31 41 41 31 41 31 41 31 41 41 31 31 41 31 31 41 41
2 1 1 1 2 2 1 1 2 1 3 1 1 2 1 1 2 2 2 4 2 4 1 2 1 1 3 1 2 2 1 1 1 3 4 2 1 2 1 1
* USDA, ARS, AMS, Memphis, TN.
of the HVI™ is 58 cm2 (9 in2 ) with 6.45 cm2 (1 in2 ) approximately equal to 14,363 pixels. The HVI™ Trashmeter camera has a sensing array of 510 by 480 pixels with a resolution of 484 by 464 pixels with every other line used. The Trashmeter ignores trash particles less than 2 pixels in area for noise reduction with the software calculating
Cotton testing To evaluate the new and improved HVI™ Trashmeter, cotton quality trash measurements were performed on a HVI™ 900A (Uster Technologies, Knoxville, TN) by the Testing Laboratory at Cotton Quality Research Station (CQRS). The viewing area Article Designation: Refereed
3
JTATM Volume 5, Issue 2,Summer 2006
the total trash, percent of viewed area, and trash particle distribution. The smallest viewable trash accepted by this software is 0.033 cm (0.013 in). The Trashmeter allows cotton to be evaluated for the number of trash particles per various trash size categories, distribution of trash particles, average particle size, and sum of trash particles. Fiber properties (see Tables 2 - 4
for USDA, ARS, CQRS HVI™ results) for all cotton bales were determined by HVI™. It should be noted that official classification was made by the classer while CQRS HVI™ leaf grade was performed using a proprietary Uster Technologies algorithm. Trash particle size distributions were obtained for all cotton samples.
Table 2. HVI™ cotton bale classification data at time zero* Bale Mic Strength Reflectance Yellowness (g/tex) (Rd) 1 3.92 26.4 75.8 2 4.52 32.8 75.2 3 4.65 32.7 76.1 4 4.59 31.8 76.6 5 4.41 28.5 75.0 6 3.90 32.6 74.5 7 4.17 28.8 75.3 8 4.58 32.7 73.5 9 4.31 29.5 74.7 10 4.51 32.4 74.3 11 4.65 28.5 75.5 12 4.82 30.2 76.6 13 4.34 26.2 74.5 14 4.57 34.9 74.1 15 3.97 27.8 74.0 16 3.77 28.6 72.7 17 4.19 29.8 74.6 18 4.22 30.9 74.8 19 4.01 32.0 75.3 20 4.48 28.7 74.4 21 4.11 28.3 75.3 22 4.52 33.4 74.0 23 4.49 28.8 75.0 24 4.14 28.9 75.4 25 3.98 28.0 73.4 26 4.27 29.0 74.9 27 4.76 33.0 76.1 28 4.86 30.5 75.5 29 3.92 31.1 75.2 30 4.53 34.2 74.8 31 3.99 28.3 76.8 32 4.52 33.1 74.0 33 4.58 33.0 73.6 34 4.26 28.3 74.4 35 4.45 29.0 74.7 36 3.85 33.4 74.5 37 4.01 29.5 75.6 38 4.44 28.6 76.2 39 4.63 27.2 77.0 40 3.66 28.9 73.0 * USDA, ARS, CQRS, Clemson, SC. Article Designation: Refereed
(+b) 8.9 8.0 8.7 7.7 8.9 6.6 8.9 8.0 8.4 7.8 9.1 8.3 6.8 7.4 8.4 8.6 8.9 9.1 6.2 9.0 8.7 8.0 8.2 8.9 8.5 9.4 7.6 8.3 6.8 7.6 8.9 8.0 8.1 9.4 8.9 6.2 8.6 8.5 6.8 8.4 4
Trash
UHM
UF
(%) 0.49 0.25 0.55 0.34 0.34 0.37 0.31 0.49 0.57 0.46 0.31 0.25 0.21 0.52 0.33 0.34 0.34 0.50 0.37 0.28 0.30 0.46 0.37 0.33 0.56 0.31 0.23 0.33 0.37 0.62 0.34 0.51 0.46 0.33 0.43 0.38 0.38 0.20 0.47 0.37
(in) 1.119 1.139 1.142 1.139 1.098 1.178 1.130 1.130 1.145 1.140 1.106 1.130 1.082 1.144 1.116 1.131 1.134 1.130 1.159 1.142 1.108 1.144 1.135 1.115 1.125 1.133 1.124 1.120 1.158 1.146 1.134 1.156 1.145 1.109 1.143 1.197 1.140 1.094 1.133 1.136
(%) 82.2 82.9 82.5 82.1 83.2 83.0 82.8 82.4 83.3 83.3 84.1 81.4 81.8 84.0 82.0 81.1 83.5 83.6 81.8 83.2 82.2 83.9 83.9 82.7 81.6 83.1 81.8 81.4 82.8 83.3 83.3 83.8 83.3 82.9 84.4 83.5 84.3 82.5 82.7 82.5
Leaf
3 2 3 3 3 3 3 3 3 3 3 2 2 3 3 3 3 3 3 3 3 3 3 3 3 3 3 3 3 3 3 3 3 3 3 3 3 2 3 3
Grade color
Quad color
31 41 31 41 31 41 31 41 41 41 31 31 41 41 41 41 31 31 41 31 31 41 41 31 41 31 41 31 41 41 31 41 41 32 31 41 31 31 41 41
JTATM Volume 5, Issue 2,Summer 2006
3 1 2 1 4 2 4 1 1 1 3 2 2 2 1 3 4 4 2 4 4 1 1 4 3 3 1 2 2 1 1 1 1 2 4 2 2 2 1 3
Table 3. HVI™ cotton bale classification data after 2 h* Bale Mic Strength Reflectance Yellowness (g/tex) (Rd) 1 3.96 25.8 74.9 2 4.58 33.4 74.0 3 4.51 29.5 75.7 4 3.74 28.4 72.7 5 4.43 28.3 74.5 6 3.95 31.1 74.5 7 4.18 28.3 75.2 8 4.57 30.6 73.2 9 4.27 29.6 75.6 10 4.61 28.2 76.1 11 4.04 29.3 74.4 12 3.84 29.2 76.6 13 4.37 27.3 74.4 14 4.84 30.9 76.5 15 4.68 33.6 74.1 16 3.93 28.1 74.0 17 4.22 30.7 75.0 18 4.64 27.8 76.6 19 4.89 31.5 75.4 20 3.94 33.3 73.6 21 3.98 33.7 74.7 22 4.16 28.2 74.9 23 4.74 31.4 73.8 24 4.06 28.3 75.3 25 4.35 28.5 75.0 26 3.91 26.9 73.8 27 4.31 26.5 74.8 28 4.43 26.4 74.8 29 4.79 31.4 76.1 30 3.83 30.5 74.9 31 3.80 28.7 76.1 32 4.53 32.9 74.8 33 4.62 33.2 73.9 34 4.28 28.8 74.5 35 4.49 30.5 73.7 36 4.03 34.5 74.4 37 4.09 28.7 75.7 38 4.38 28.4 75.4 39 4.67 27.8 77.3 40 3.75 28.2 73.1 * USDA, ARS, CQRS, Clemson, SC.
Article Designation: Refereed
(+b) 8.7 8.0 9.1 8.8 8.8 6.7 8.8 8.0 8.7 9.3 8.9 8.4 7.2 8.2 7.7 8.8 9.1 7.9 8.4 9.3 6.5 9.1 7.9 9.2 8.4 8.3 9.3 8.4 7.8 6.5 9.2 8.1 8.3 9.2 9.1 6.5 8.8 8.8 7.0 8.7
5
Trash (%) 0.56 0.46 0.56 0.46 0.36 0.51 0.31 0.62 0.43 0.23 0.37 0.36 0.40 0.31 0.56 0.34 0.33 0.21 0.31 0.40 0.41 0.36 0.46 0.25 0.40 0.37 0.28 0.31 0.28 0.44 0.31 0.49 0.55 0.31 0.33 0.46 0.23 0.27 0.33 0.56
UHM (in) 1.109 1.166 1.163 1.137 1.111 1.163 1.145 1.155 1.133 1.115 1.118 1.143 1.111 1.124 1.153 1.139 1.142 1.124 1.132 1.144 1.139 1.130 1.134 1.133 1.134 1.061 1.075 1.104 1.124 1.156 1.136 1.148 1.144 1.104 1.122 1.161 1.141 1.108 1.125 1.141
UF (%) 81.6 82.9 83.1 81.9 82.8 83.0 82.6 83.0 83.1 83.3 82.4 82.2 82.5 81.6 83.9 81.9 83.4 82.6 82.8 81.4 82.6 82.8 83.2 82.9 84.1 81.7 81.8 81.3 82.7 81.8 83.3 82.8 83.5 82.9 82.3 82.5 83.1 81.5 82.0 81.6
Leaf
3 3 3 3 3 3 3 3 3 2 3 2 2 3 3 3 3 2 3 3 3 3 3 3 3 3 3 3 3 3 3 3 3 3 3 3 2 3 2 3
Grade color
Quad color 31 41 31 41 31 41 31 41 31 31 41 31 41 31 41 41 31 31 41 32 41 31 41 31 41 41 31 41 41 41 31 41 41 31 31 51 31 31 41 41
JTATM Volume 5, Issue 2,Summer 2006
4 1 3 3 4 2 4 2 2 3 3 2 2 2 2 3 4 2 1 2 2 4 1 4 1 1 3 1 1 2 3 1 1 4 4 1 3 4 1 3
Table 4. HVI™ cotton bale classification data after 4 h* Bale Mic Strength Reflectance Yellowness (g/tex) (Rd) 1 4.0 26.6 77 2 4.6 36.0 76 3 4.6 33.2 81 4 3.7 29.5 75 5 4.4 29.2 77 6 3.9 33.0 77 7 4.2 29.3 78 8 4.6 33.8 76 9 4.3 31.6 75 10 4.7 28.7 79 11 4.0 29.9 80 12 4.0 29.9 80 13 4.5 27.4 75 14 4.9 30.9 79 15 4.7 35.4 75 16 3.8 29.7 78 17 4.3 31.1 79 18 4.7 34.7 77 19 4.9 31.5 79 20 3.9 30.4 77 21 4.0 33.0 76 22 4.0 30.2 76 23 4.6 34.0 74 24 4.1 29.3 76 25 4.4 31.7 75 26 4.3 29.5 76 27 4.2 29.4 77 28 4.4 26.6 77 29 4.9 32.9 81 30 3.8 33.3 77 31 3.8 29.9 79 32 4.6 34.5 79 33 4.7 35.0 77 34 4.3 28.9 75 35 4.5 29.3 78 36 3.9 33.3 77 37 3.9 30.4 76 38 4.5 28.4 78 39 4.8 28.5 78 40 3.7 28.1 74 * USDA, ARS, CQRS, Clemson, SC.
Article Designation: Refereed
Trash
(+b)
(%) 0.28 0.24 0.26 0.36 0.27 0.37 0.29 0.30 0.46 0.28 0.24 0.26 0.24 0.26 0.32 0.32 0.28 0.24 0.31 0.34 0.32 0.27 0.24 0.35 0.24 0.30 0.29 0.22 0.20 0.28 0.30 0.32 0.26 0.23 0.29 0.32 0.20 0.28 0.24 0.35
8.6 8.4 8.2 8.2 8.8 6.2 8.8 7.7 8.5 9.1 8.5 7.9 6.9 8.0 7.8 8.0 8.9 7.5 7.9 8.7 6.5 8.6 7.7 8.8 8.3 9.0 9.0 8.4 7.4 6.2 8.5 7.5 7.7 9.0 8.5 6.0 8.7 8.4 7.0 8.5
6
UHM (in) 1.15 1.16 1.15 1.13 1.12 1.21 1.14 1.13 1.15 1.13 1.12 1.15 1.12 1.14 1.16 1.14 1.16 1.15 1.15 1.16 1.19 1.13 1.14 1.13 1.15 1.14 1.15 1.10 1.15 1.18 1.14 1.15 1.14 1.10 1.15 1.19 1.16 1.11 1.14 1.13
UF (%) 82.8 84.6 83.5 82.3 83.6 83.7 83.8 84.0 84.5 83.3 84.2 84.3 82.7 82.9 84.7 82.8 84.8 82.4 82.9 84.1 84.1 84.0 84.5 83.8 84.6 84.4 83.7 81.1 82.5 83.5 84.0 83.5 83.8 84.0 84.9 84.8 84.5 82.8 84.1 82.8
Leaf
3 4 4 3 2 4 3 5 5 3 2 3 3 3 4 4 4 3 3 4 4 2 4 3 4 4 3 3 2 2 4 5 4 3 3 3 2 3 3 4
Grade color
Quad color
31 31 21 41 31 41 31 41 41 21 21 31 41 31 41 31 21 41 31 31 41 31 41 31 41 31 31 31 31 41 21 31 41 31 31 41 31 31 41 41
1 2 1 1 1 2 1 1 1 1 1 1 2 1 1 1 2 1 1 1 2 2 1 3 1 3 3 2 1 2 2 1 1 4 1 2 2 1 1 3
JTATM Volume 5, Issue 2,Summer 2006
Textile Processing The HVI™ classification properties and mean Trashmeter data were statistically analyzed with the MEANS procedure in SAS to compute descriptive statistics for variables across all observations (SAS Institute Inc., 1985).
A forty-bale laydown was analyzed from a local textile mill. This laydown contained cotton purchased according to their specifications (no greater than a 3 leaf grade). Initially, four samples were removed from the surface of all bales for HVI™ Trashmeter testing. Two hours later a 45 kg (100 lb) mat of cotton was removed from all bales with four samples per bale later removed from the mat’s interior. Lastly after two hours another four samples were removed from the surface of the 40bale laydown for HVI™ Trashmeter testing. A second set of official HVI™ fiber properties were determined on cotton samples removed after two h.
Results and Discussion Counting and sizing cotton trash by hand would be a very tedious, timeconsuming, and subjective process. Preliminary work with uniformly located trash shows that asymmetrical trash diverse in origin and color can be easily measured with the new Trashmeter software (Foulk et al., 2003). Results indicate that with new software the HVI™ 900A Trashmeter is able to estimate the size of each particle counted consequently creating a trash frequency distribution (Foulk et al., 2003). This preliminary work led to the use of this Trashmeter software with a known multibale laydown of narrow leaf grade.
Cotton from the 40-bale laydown was removed for processing using a Truetzschler BDT 019 Top Feeder (American Truetzschler Inc., Charlotte, NC). All cotton was processed through the following sequence: Truetzschler LVSA condenser fan (American Truetzschler Inc., Charlotte, NC), Truetzschler MPM10 (ten cell mixer) (American Truetzschler Inc., Charlotte, NC), Truetzschler Maxi-Flo (American Truetzschler Inc., Charlotte, NC), Truetzschler CVT1 (American Truetzschler Inc., Charlotte, NC), Truetzschler Dustek (American Truetzschler Inc., Charlotte, NC), Truetzschler condenser fan (American Truetzschler Inc., Charlotte, NC), Truetzschler MPM4 mixer (4 cell mixer) (American Truetzschler Inc., Charlotte, NC), Truetzschler MS reserve (American Truetzschler Inc., Charlotte, NC), Truetzschler 803 card (American Truetzschler Inc., Charlotte, NC). Cotton was processed through the card to produce a 60-grain sliver at 64 kg/h (140 lb/h). Discharge point on Truetzschler MPM10 where blending first occurs and cotton sliver were cotton collection points for additional HVI™ Trashmeter te sting.
Article Designation: Refereed
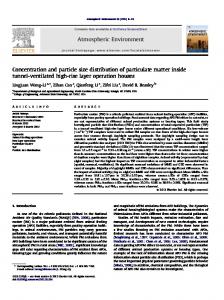
Trash classification was performed using the new HVI™ Trashmeter software and referred to as 1 (510100200300400500 pixels). Due to decreasing levels of trash, categories 21 and higher were sorted into 100 pixel bins rather than 5 pixel bins. Generated trash classification results were compiled for all bales during each sampling period. Data results demonstrated an exponential decay of trash particles with many small particles decreasing to a few large particles (see Figures 1-3). The visible exception for all 3 time periods occurs in category 21. This increase in total particles is present since it is the first enlarged particle category.
7
JTATM Volume 5, Issue 2,Summer 2006
350
Total particles
300 250 200 150 100 50 0 1
3
5
7
9
11
13
15
17
19
21
23
25
Trash category
Figure 1. Exponential decay for all 40 bales illustrated with total number of particles in each trash category at time zero. 350
Trash particles
300 250 200 150 100 50 0 1
3
5
7
9
11
13
15
17
19
21
23
25
Trash category
Figure 2. Exponential decay for all 40 bales illustrated with total number of particles in each trash category after 2h.
Article Designation: Refereed
8
JTATM Volume 5, Issue 2,Summer 2006
350
Trash particles
300 250 200 150 100 50 0 1
3
5
7
9
11
13
15
17
19
21
23
25
Trash categories
Figure 3. Exponential decay for all 40 bales illustrated with total number of particles in each trash category after 4h. Aware that trash particle size distributions were exponential, LIFEREG a standard SAS procedure for parametric survival analysis was used for bale assessment (SAS Institute Inc., 1985). To avoid increases in category 21, raw trash particle sizes, rather than trash classification results, within each bale in the laydown were compared using SAS LIFEREG. SAS LIFEREG is a procedure that fits parametric models to the trash particle size data and conducts a statistical test to determine whether the distributions are the same. Trash particle size distribution data were fitted to a Weibull model using Weibull regression. Cotton bales were the independent variable and trash particle size was the dependent variable. Analysis of raw trash histogram data (visibly the shape of survival data) involves two main functions that are interrelated: the hazard function and the survival function (Kleinbaum, 1997). The hazard function h(t) provides the instantaneous potential of an individual to undergo the event of interest given survival until time t (determines the shape of the distribution). The survival function S(t) gives the probability of survival for longer than time t (overall survival time). There exists a mathematical relationship between these two functions because a high probability of survival corresponds to a low probability of Article Designation: Refereed
undergoing the event of interest (Kleinbaum, 1997). Results generated from LIFEREG determine equation coefficients and p-values for each bale. The p-values indicate which bales are different than the remainder of the bales that form the equation’s baseline. Evaluating the laydown with the new Trashmeter software at time zero, demonstrated that bales 2, 6, 9, 10, 12, 14, 16, 24, 27, 30, 32, 36, and 38 were significantly different (P