made to Facebook's Graph API and Terms and Conditions, lowering barriers to ...... individual or grouped entities, and download datasets for use in third party.
Detecting Well-being in Digital Communities: An Interdisciplinary Engineering Approach for its Indicators
Zur Erlangung des akademischen Grades eines Doktors der Wirtschaftswissenschaften (Dr. rer. pol.) von der Fakultät für Wirtschaftswissenschaften am Karlsruher Institut für Technologie (KIT)
eingereichte
DISSERTATION
von Margeret Hall, MA
Tag der mündlichen Prüfung: Referent: Korreferent: Prüfer:
2015 Karlsruhe
Abstract Progressive institutions are those which include the strategic interests of their constituents along with their own. While the interest to expand and develop metrics in this area has been expressed, the application thereof is constrained. One reason for this is the lack of appropriate indicators. Well-being, or the experience of feeling good and functioning effectively, is wellpositioned to become this indicator. Highly granular traces of well-being can be extracted from digital footprints left in online social media. Given the predominance of the online self in the Internet age, such data is abundant and manifold. Before well-being can be applied several challenges need to be addressed. In particular, this includes the operationalizing of well-being measurements, the creation of a suitable implementation framework, the identification and refinement of suitable data, and the technical application of a platform for the implementation of such a system. In this thesis, the challenges of defining, refining, and applying well-being as a progressive management indicator are addressed. The thesis approaches these challenges from a service logic perspective, namely transformative service research. The first part defines well-being and shows the usefulness of integrating well-being into the service value chain. The second part of the thesis concentrates on case studies applying information-driven well-being assessments to online social media data. The thesis advocates an unobtrusive data extraction and evaluation model entitled the Social Observatory. With a Social Observatory, it becomes possible to view highly granular, very personalized data left in digital traces by online social media users. For highly frequent and low-cost assessments of well-being, text analytics and sentiment analysis are proposed and evaluated in this context. The thesis shows that sentiment analysis provides reliable well-being data with low research(er) bias that can be viewed from many granularity levels. A subsequent finding in this thesis is that is it possible to mitigate the bias introduced by individuals in their online profiles by isolating aspects of the users’ personality. The final part of this thesis holistically investigates a university’s online social media network for its digital traces of communal well-being. The corresponding case study established that communal well-being can be detected and isolated as an indicator. Well-being, whilst generally existing as a baseline, is observed having spikes and dips that are directly related to events and incidents impacting the campus community. In particular, the concept of communal belongingness is a representative proxy of communal well-being; its longitudinal observation can be implemented as a tool of progressive community management. This work’s implications and contributions are highly relevant for service research as it advances the integration of consumer well-being and the service value chain. It also provides a substantial contribution to policy and strategic management by integrating constituents’ values and experiences with recommendations for progressive community management. i
Table of Contents Abstract ..................................................................................................................................................... i List of abbreviations ............................................................................................................................... vi List of figures ......................................................................................................................................... vii List of tables ............................................................................................................................................ ix List of symbols ..........................................................................................................................................x Part I. Introduction ............................................................................................................................... xi Chapter I
Introduction ........................................................................................................................1
1.1
Motivation: Well-being in Institutional Management ..............................................................1
1.2
Research Challenges and Outline ..............................................................................................4
1.3
Thesis Structure .........................................................................................................................13
1.4
Research Development ..............................................................................................................15
Part II. Foundations and Conceptual Framework ...........................................................................17 Chapter II Foundations of Well-being ...............................................................................................19 2.1
Towards an Interdisciplinary Definition of Well-being .........................................................19
2.1.1
Economic Assessments of Well-being .....................................................................................20
2.1.2
Philosophical and Psychological Foundations of Well-being ................................................21
2.2
Discussion: An Interdisciplinary Definition of Well-being ....................................................27
Chapter III Related Work ....................................................................................................................31 3.1
Service Design for Consumer Well-being ................................................................................32
3.2
A Transformative Service Framework ....................................................................................33
3.2.1
The Outer Circle: Macro-level Influences on Well-being .......................................................34
3.2.2
Meso-level Analysis: The Role of the Self in the Community ..................................................35
3.2.3
Me, Myself and I: Micro Profiles and Well-being...................................................................41
3.3
Applications of TSR ..................................................................................................................54
Part III. Applied Well-being Measurement in Institutions ..............................................................56 Chapter IV BeWell: A Game of You on Facebook ............................................................................57 4.1
Application of Design Science to BeWell .................................................................................58
ii
4.1.1
On the Suitability of Design Science as a Method ..................................................................59
4.1.2
Identification of Incentive Factors ..........................................................................................60
4.1.3
Objectives of the Solution .......................................................................................................61
4.2
Well-being in Community Management .................................................................................63
4.2.1
On Survey Item Suitability ......................................................................................................67
4.2.2
Data Descriptives....................................................................................................................68
4.3
Evaluation Methods of Well-being and Baseline Personality Traits.....................................71
4.3.1
Assessment of Predictive Models for Well-being Prediction ..................................................73
4.3.2
Summary and Comparison ......................................................................................................76
4.4
BeWell: Prototyping a Game of You .......................................................................................77
4.4.1
Iterative Design in Gamified Well-being ................................................................................77
4.4.2
BeWell Architecture ................................................................................................................81
4.4.3
BeWell Pilot Study ..................................................................................................................83
4.5 4.5.1 4.6
Discussion and Limitations .......................................................................................................86 On Serious Games for Well-being Assessment .......................................................................88 Conclusion ..................................................................................................................................89
Chapter V Online Well-being: An Applied Social Observatory ......................................................91 5.1
Big Data Challenges in the Social Sciences .............................................................................92
5.2
Social Networks as a Proxy for Communal Well-being .........................................................95
5.2.1
Studies in Online Social Media ...............................................................................................96
5.2.2
Related Online Social Media Studies on German Politicians .................................................97
5.3 5.3.1
Implementation: a Facebook Social Observatory Adapter ...................................................97 Data Model ...........................................................................................................................101
5.4
Application of a Social Observatory: Political Sentiment in Germany ..............................103
5.5
Evaluating a Social Network at Multiple Resolutions ..........................................................107
5.5.1
Macro-level Assessment ........................................................................................................107
5.5.2
Meso-level Assessment ..........................................................................................................111
5.5.3
Micro-level Assessment .........................................................................................................115
5.6
Discussion .................................................................................................................................120
5.7
Limitations and Conclusion ....................................................................................................122
Chapter VI Detecting Self-Representation and Well-being on Facebook ......................................124 6.1
Conceptual Background .........................................................................................................125
6.1.1
Self-representation and Online Social Networks ..................................................................125
6.1.2
Emotional Disclosure and Well-being on Facebook.............................................................126
6.1.3
Detecting Personality and Well-being with Text Analytics ...................................................128
6.2
Methodology and Research Design ........................................................................................129
6.2.1
Statistical Modeling ..............................................................................................................132
6.2.2
On Reliability and Method Biases.........................................................................................133
6.3
Results ......................................................................................................................................134
6.3.1
Identifying Self-Representation .............................................................................................136
6.3.2
Personality as a Tool for Mitigating Self-representation .....................................................140
6.4
Discussion and Limitations .....................................................................................................142
6.5
Summary and Implications ....................................................................................................144
Chapter VII
Applied Institutional Well-being: A Case Study on KIT ........................................145
7.1
Study Design and Approach ...................................................................................................146
7.2
Macro, Meso, and Micro Granularities of BeWell@KIT ....................................................146
7.2.1
Macro Attributes of the KIT Facebook Network ...................................................................147
7.2.2
A Meso-assessment of KIT’s Discourse Baseline .................................................................151
7.2.3
Temporal Representations ....................................................................................................165
7.3 7.3.1 7.4
Discussion .................................................................................................................................174 Limitations and Future Work ................................................................................................176 Conclusion ................................................................................................................................179
Part IV. Finale .....................................................................................................................................180 Chapter VIII Conclusion ...................................................................................................................181 8.1
Contributions ...........................................................................................................................182
8.1.1
Defining Well-being for Transformative Service Research...................................................182
8.1.2
Refining the Data Characteristics of Digital Well-being ......................................................185
8.1.3
Applying Transformative Services ........................................................................................188
8.2 8.2.1
Research Outlook ....................................................................................................................190 Technical Considerations in Transformative Service Research ...........................................190
iv
8.2.2
Human Factors in Institutional Management .......................................................................191
Part V. Appendix .................................................................................................................................194 Appendix I Survey Items Considered in Part III..............................................................................195 Appendix II A Comparative Assessment of Machine Learning Algorithms for Well-being Assessment ............................................................................................................................................200 2.1
Kernel-Smoothing algorithms ...............................................................................................200
2.1.1
K-nearest neighbor ...............................................................................................................200
2.1.2
Non-parametric Regression ..................................................................................................201
2.1.3
LOESS ...................................................................................................................................202
2.1.4
Splines ...................................................................................................................................202
2.1.5
npreg .....................................................................................................................................203
2.2
Neural Network Algorithms ..................................................................................................210
2.2.1
Stuttgart Neural Network Simulator .....................................................................................210
2.2.2
Extreme Learning Machine ...................................................................................................211
2.3
Feature Selection Algorithms................................................................................................214
2.3.1
Lasso and Elastic Net Regression .........................................................................................214
2.3.2
Lazy Lasso Regression ..........................................................................................................215
Appendix III Results of a Paired Sample t-test Considering Posts and Comments of Germany’s Five Political Parties .............................................................................................................................221 Appendix IV Descriptive Aspects of the AMT Survey Population Considering Mean HFS ........225 Appendix V List of KIT Facebook Pages and their Organization into Subgroups .......................227 Appendix VI Results of the Nearest Neighbors Analysis for the KIT Facebook Network, k=5 ...234 References .............................................................................................................................................237
List of abbreviations AMT API
Amazon Mechanical Turk Application Programming Interface
CDU CSU
Christian Democratic Union Christian Social Union
CMB df
Common Method Bias Degrees of Freedom
DRM FDP
Daily Reconstruction Method Free Democratic Party
GDP GLM
Gross Domestic Product Generalized Linear Model
GSS HCI HF HFS HIT ISSP JSON KiB
General Social Survey Human-Computer Interaction Human Flourishing Human Flourishing Score Human Intelligence Task International Social Survey Programme JavaScript Object Notation Kibibyte
KIT KMO
Karlsruhe Institute of Technology Kaiser-Meyer-Olkin
LIWC MiB OECD PCA PWB RMSE RQ SD SDP SDT SQL SWB TSR
Linguistic Inquiry and Word Count Mebibyte Organisation for Economic Cooperation and Development Principal Component Analysis Psychological Well-being Root-mean-square-error Research Question SD Social Democratic Party Self-determination Theory Structured Query Language Subjective Well-being Transformative Service Research
vi
List of figures Figure 1.1 Figure 2.1 Figure 3.1: Figure 3.2: Figure 4.1: Figure 4.2:
Thesis structure 14 Frey and Stutzer’s proposed continuum of happiness measurement 24 An adaptation of (Anderson et al. 2013)’s TSR framework 33 The Davies J curve 35 Design Science research cycle of (Winter 2008) 59 (a) Age distribution of the survey respondents, (b) Histogram of Human Flourishing scores 64 Figure 4.3: Independent and dependent variables in a well-being prediction scenario (represented as a question mark) 66 Figure 4.4: HFS distribution 69 Figure 4.5: HFS density 70 Figure 4.6: Correlation matrix (absolute values) 71 Figure 4.7: Accuracy comparison between deployed algorithms for well-being baseline prediction 73 Figure 4.8: Predictor importance in GLM (t-statistic) 74 Figure 4.9: GLM Regression coefficients with standard error bars 75 Figure 4.10: BeWell: A Game of You on Facebook component design 78 Figure 4.11: A pictographic option of measuring happiness levels 79 Figure 4.12: The tab "Store" with optional display items 80 Figure 4.13: BeWell architecture 82 Figure 4.14: Example Human Flourishing score graphic 83 Figure 4.16: HFS histogram of BeWell POC 84 Figure 4.17: Human Flourishing comparison by gender 85 Figure 5.1: A General architecture for a Social Observatory 93 Figure 5.2: Workflow illustrating the steps to acquire, analyses, and interpret Facebook 99 Figure 5.3: The extracted social interaction graph with all (a) and weightiest edges (b) 105 Figure 5.4: Distributions of hourly posting behaviors, posts and comments 106 Figure 5.5: Weekday and weekend post and comment activity (logarithmic scale) 106 Figure 5.6: Total monthly posts and comments 107 Figure 5.7: Expressed well-being relationship matrix, estimated via Euclidean distance 110 Figure 5.8: Language tense patterns of party manifestos, posts, and comments 112 Figure 5.9: Social references in party manifestos, posts, and comments 113 Figure 5.10: Inclusion and Exclusion references in manifesto, posts, and comments 114 Figure 5.11: Percentage of words in a deceptive profile, per party across manifesto, posts and comments 115 Figure 5.12: Net Affect of German Political Discourse on Facebook 116 Figure 5.13: Average positive and negative sentiment per month, posts and comments 116 Figure 5.14: Sentiment by (a) Manifesto, (b) Politicians, (c) Constituents, and (d) Overview of all 118 Figure 6.1: Relationship model considering directionality of personality, well-being, and profile text 129 Figure 6.2: Workflow illustrating the steps to acquire, analyze, and interpret text data 131 Figure 6.3: Gendered usage of confident statements on Facebook profiles 139 Figure 7.1 Network graph of the KIT pages considering all interactions, depicting most important nodes and edges 149 Figure 7.2 Comparative view of inclusive and exclusive speech, posts and comments 152 Figure 7.3 Comparative view of social speech, posts and comments 153 Figure 7.4 Comparative view of communal belongingness, posts and comments 154 Figure 7.5 Comparative view of social status, posts and comments 155
Figure 7.6 Comparative view of the use of tense in speech, posts and comments sorted by the factor immediacy 157 Figure 7.7 Comparative view of professional speech, posts and comments 158 Figure 7.8 Results of a Mann-Whitney U test comparing usage of Positive and Negative Emotion 158 Figure 7.9 Net Affect, displaying skewedness and (a) Kurtosis and (b) Distribution 159 Figure 7.10 KIT’s well-being relationship graph 160 Figure 7.11 Results of a Mann-Whitney U test comparing usage of Assent and Negation 160 Figure 7.12 Results of a Mann-Whitney U test comparing cognitive complexity 161 Figure 7.13 Frequency analysis of deceptive-type comments and posts 165 Figure 7.14 Frequency of KIT posts and comments throughout the academic years 2011-2014 166 Figure 7.15 Frequency of KIT posts and comments throughout the academic years 2011-2014 167 Figure 7.16 Frequency of cognitively oriented discourse and social discourse throughout the academic calendar, 2011-2014 168 Figure 7.17 Affective changes in discourse relating to the KIT Elite loss. All measures show relative changes, not absolute LIWC scores. The colored bars in the middle reflect the crucial short-term results, while bars to the left (1 week before) and right (3 weeks after) improve interpretation by considering temporal deviations from the baseline and resilience of effects. 170 Figure 7.18 Emotive sentiment flow in discourse relating to the KIT Elite loss. 171 Figure 7.19 Net Affect changes during the World Cup to the aggregated (word count weighted) baseline of all scores before and after. All measures show relative changes, not absolute LIWC scores. 173 Figure 7.20 Communal Belongingness aspects during the World Cup to the aggregated (word count weighted) baseline of all scores before and after. All measures show relative changes, not absolute LIWC scores. 174
viii
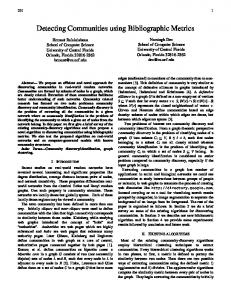
List of tables Table 2.1: A comparative assessment of psychological instruments of well-being assessment 28 Table 3.1: National and international well-being measurement instruments 40 Table 3.2: Comparison of existing dictionary-based sentiment analysis packages 48 Table 3.3: National and international well-being measurement instruments 49 Table 4.1: Dimension of incentivization in serious games 61 Table 4.2: Spearman’s rho of Human Flourishing with significance levels (***: p 0Y
(2.3)
Results of a structural equation model show that only positive emotion is a construct of hedonic well-being, the other nine measure eudemonic well-being (Huppert and So 2013). This emphasizes the importance to treat positive emotion as a single item whose absence prevents to classify an individual as being flourishing. (Huppert and So 2013) present a middle-ground approach by combining then validating an instrument that considers hedonistic and eudemonic elements of well-being with single-item measurements.
2.2 Discussion: An Interdisciplinary Definition of Wellbeing In summary, both hedonism and eudemonism have been proposed as the ground truth of wellbeing for millennia before being the object of study in the field positive psychology (Ryan and Deci 2001). Until now there is not a singular definition in place. Due to the complexity of defining well-being, there is no right answer on how to measure well-being (Samman 2007; Ahn et al. 2011; Veenhoven 2008). Currently discussed well-being measures either aim to measure participants’ instantaneous well-being (SWB) or dimensions amounting to wellness (PWB). Measurement matters: the employed scale dictates if the assessment can be used as a reflection of satisfaction (ex-post) or as a tool of design (ex-ante). SWB is temporally oriented, focusing on the individual feeling of happiness as calculated by the presence of positive emotion and absence of negative emotion (Diener 1984a; Kahneman and Krueger 2006; Kahneman et al. 2004b). PWB allows for an alternative view of well-being, namely that what feels good and what makes one happy doesn’t (always) lead to a meaningful expression of well-being or acting with integrity (Waterman 1993; Waterman 2007). However, in attempting to measure the conditions of well-being and not only the feeling, PWB becomes so hyper-dimensional as to become non-assessable. Specific instruments have been developed for assessing the main determinates of PWB, the most commonly applied thereof being SelfDetermination Theory. In measuring individual’s perceived self-determination, competence, and relationships with others rather than general subjective assessment, (Deci and Ryan 2008)
Foundations of Well-being
argue that individuals’ summed well-being is correctly estimated. Human Flourishing is introduced as a hybrid of hedonic and eudemonic well-being. The separate measurement systems have failed to take all aspects of well-being into account until now, which makes Human Flourishing especially attractive as a well-being indicator in progressive community management.
Waterman 1993, 2007
SWB
Kahneman 2002
PWB
Deci & Ryan 2008
This Work
HF
Huppert & So 2011
Momentary
Real-time
Data-Pulled
Data-Pushed
●
○
●
○
●
○
Sources
Time Series
○
Data
Multi-Item
Diener 1984, 1994
A comparative assessment of psychological instruments of well-being assessment
Single Item
Table 2.1:
Medium n directed questionnaires
◑
●
○
●
○
●
○
Medium n directed questionnaires
●
○
○
●
○
●
○
Medium n directed questionnaires
●
○
●
○
●
○
●
Small n directed questionnaires
●
○
◑
●
○
●
○
Ex-post national surveys
◑
●
◑
◑
●
◑
●
Small n directed questionnaire
○ not covered
◑ partially covered
● covered
Table 2.1 is a comparative view of the major psychological contributions to well-being. It assesses the item measurement (single or multi-item questions), the timespan with which the authors validated their instruments (longitudinal time series, momentary (cross-sectional) assessments, or real-time assessments), and if the data was solicited by the researcher (pulled), or if the data was volunteered by the participant (pushed). As HF provides a fil-rouge between hedonic as well as eudemonic well-being it reduces the risk of what Aristotle saw as the ‘slavish pursuit of desire’ (Ryan and Deci 2001) embedded in exclusively hedonic approaches. Moreover, the diversification of well-being across positive emotions, functioning, and characteristics reduces the impact of single item measures. Overstatement and misinformation, widely reported in SWB measures, are therefore less likely and less impactful when they do occur (Veenhoven 1984). 28
Research Development
Human Flourishing is taken as the operationalized definition of well-being for this thesis (RQ 1.1). HF is an elegant solution that simultaneously measures SWB and PWB, as well as highly granular components of well-being. Further, as mentioned above, the risk of inflated or overreporting are mitigated with Human Flourishing’s triangulated approach. This work builds on the principle that both single and multi-item measurements can provide a valid assessment of well-being. In order to follow the standards of best practice and calibrate participants’ baseline well-being, the single-item measurements of SWB and PWB are applied as survey items the form of the HF survey of (Huppert and So 2013). This work also applies multi-item measurement in the form of sentiment analysis, (see Chapter 3.2.3) in order to not only address historical or momentary well-being, but real-time well-being. Finally, whilst the survey items are pulled (solicited) data sources, the majority of the data analyzed is pushed (unsolicited) from participants for unobtrusive and less biased measurement and assessment (discussed in Chapter 3.2.3).
30
Chapter III
Related Work
“Value creation through service provision and service exchange relationships at the micro level must be understood in the context of value creation through service provision and service exchange relationships at the macro level. The elements are value, relationships, and networks; the driving force, and thus the nature of value, relationships, and networks, is mutual service provision for mutual wellbeing.” Toward a Transcending Conceptualization of Relationship: A Service-dominant Logic Perspective, (Vargo 2009)
S
ervice design is transformative when it has a measurable, even optimizing, positive effect on well-being. This is an exciting approach: irrespective of domain, TSR delivery guarantees well-being outcomes like enabled or increasing access, social justice, social capital, agency, and ecological stability (Rosenbaum et al. 2011).Well-being outcomes here refer to both well-being of the individual and the collective (Veenhoven 2013; Samman 2007). TSR’s multidimensionality is nicely highlighted in Ostrom et al.,’s 2010 article: “As such, it [TSR] examines aspects such as the social and ecological consequences and benefits of services offerings, increased access to valued services, the disparity in the quality of service to different groups, the design and co-creation of services with consumers that honors both the agency and the values of individuals and communities, the identification of and planning for the impact of services on well-being and the impact of consumers’ service experiences on well-being.” (Ostrom et al. 2010, 9) The conceptual domains of TSR are extensive and well-covered in the foundational conceptual works of (Ostrom et al. 2010b; Anderson et al. 2013; Rosenbaum et al. 2011), including healthcare, finances, and the workplace. However, such the TSR framework brings about the following, non-domain specific questions: Where is the intersection of personal and communal well-being; and, how granular does TSR need to be in order to establish a robust measure? The coming discussion is an extension of (Hall et al. 2014), where these aspects were discussed in order to ground the discussion of well-being measurement in service dominant logic.
31
Related Work
3.1
Service Design for Consumer Well-being
TSR was borne out of the recognition of the importance of services to both the global economy and individuals’ daily life; this interplay becomes especially important considering that by 2050 is it estimated that the world’s population will approach nine billion.4 This requires a service-level commitment to human development and quality of life standards from the state, and a convincing statement of managerial necessity and delivery from the private sector: a socalled triple bottom line approach of people, planet and profit (Norman and MacDonald 2004). Service design has a fundamental role in developing this approach by taking both provider commitments and consumer well-being outcomes into consideration (Rosenbaum et al. 2011), thus creating service design that enables well-being. Transformative service research (TSR), a recently-envisioned branch of service science, is about understanding connections between service offerings and well-being. It has at the core of its conceptualization the goal of improving the well-being of individuals. A founding statement characterizes TSR as: “the integration of consumer and service research that centers on creating uplifting changes and improvements in the well-being of consumer entities: individuals (consumers and employees), communities and the ecosystem” (Anderson et al. 2013). It is clear that in the modern economy, service touches innumerable aspects of daily life. It is then natural that the field of service science explores mitigation of negative and enhancement of positive service experiences beyond the value co-creation and consumer satisfaction paradigms. This is well summed up in the conversation between the switch from goods-dominant to service-dominant logic (Vargo and Lusch 2008; Vargo, Maglio, and Akaka 2008; Vargo and Akaka 2009). Currently the TSR agenda is lacking a measurement tool that considers the foundational structure of how well- and ill-being implant itself into service-oriented society. In order to use well-being as a societal indicator, that indicator must first be delineated. Mapping well-being, or its negatively correlated partner ill-being, is not such an imminently achievable task. Wellbeing is per definition highly subjective, multi-dimensional, dynamic, and at best fuzzily defined. As noted by White and Pettit it is important to recognize that the concept under discussion is normative – that well-being and its assessment are inevitably based on values and judgment. This well-being is attributed to states – ‘being’ in terms of material endowments, psychological attributes, and subjective assessments of the personal and environment one exists in (White and Pettit 2004). In order to move the TSR agenda forward, an extension to the existing framework of (Anderson et al. 2013) which captures the intersection between service and well-being of individuals, communities, and the ecosystem is necessary. A detailed framework proposal follows in the coming sections. 4
http://www.census.gov/popclock/. Last Accessed: 12 June 2014.
32
A Transformative Service Framework
3.2
A Transformative Service Framework
This framework extension utilizes a systems approach, meaning the entirety of the service environment is considered in order to assure success (Spohrer and Maglio 2010). In addition to Anderson et al.’s macro-level factors it adds meso- and micro-level environmental factors. These aspects (service influencers) are generally considered external to service design, where a service influencer is defined as a cycle of provision, perception, and impact, and well-being outcomes (Figure 3.1). This layered approach allows for analysis of the granularity of daily life; by extending the model with these dimensions, researchers are able to suitably analyze the often compounded aspects of ill-being.
Figure 3.1: An adaptation of (Anderson et al. 2013)’s TSR framework
A fundamental reference point for personal and collective assessment of well-being lies in the greater social system (Stiglitz et al. 2010; White and Pettit 2004). This then must include macro-level assessments like access to political freedoms, general peace and stability, equity and overall development (Anand and Sen 1994) and the meso-level of external frame of reference; i.e., how one perceives their place in society (White & Pettit 2004). Here one finds objective measurements like social hierarchy and minority status, as well as less standard measures like ‘life chances’ one has had, and the general prestige of their life circumstances (Veenhoven 1984; Veenhoven 2013). In this framework, the micro-level of consumer-service interaction is the psychological profile of the individual. It is well-established that one’s
Related Work
baseline psychological profile affects the way one subjectively understands their circumstances overall (Schwartz et al. 2002; Purvis et al. 2011; Hall et al. 2013). The affected domains referenced in Figure 3.1 have a strong correspondence with macro-, meso-, and micro- environmental factors. Things to consider in transformative service provision include access equity, integration, values, service entity, sector and overall inclusiveness (Anderson et al. 2013; Gebauer and Reynoso 2013). Perception of service provision is driven by a combination of individual and collective understanding of personality traits, family status, perceived control, personal relationships, previous experiences, convictions, and general “wants” balanced by the demands of reality (Veenhoven 1984). The optimal impact domains are those such as employment, SWB, activity level, health, education, and integration (Rosenbaum et al. 2011; Anderson et al. 2013). When TSR incorporates these aspects, the resulting effect should be an increased consumer well-being.
3.2.1
The Outer Circle: Macro-level Influences on Well-being
Within a secure, participatory democracy and a strong economy there are fewer chances for wide disparity levels between subgroups. This implies that each member of society has access, or a reasonable expectation to be able to participate, affording minorities and other subpopulations the chance of equal servicing. This is generally not true for opaque or authoritarian systems: such governments are less likely to be stable and more likely to provision services along partisan, ethnic or religious lines. Not only are groups unequally serviced, but quality of life overall drops with respect to expected welfare maintenance (Wu and You 2007; Lacey et al. 2008; Ballas 2013; Diener and Suh 1997). Changes in the overall well-being of the state are driven from the aggregate number of citizens in the state and their access to (civil) services, reflecting the view that progress is contingent to the impacts on and richness of the human life, rather than merely economic advances (Stiglitz et al. 2010; Buchanan 2001). This is tantamount to the economic, or ex-post, assessment of well-being. A useful model for the utilization of macro assessment of well-being as a decision making aid was proposed by sociologist James Davies in his 1962 article on social unrest (Davies 1962). He suggests that drops in expectations as compared to actual progress fuels relative deprivation, the idea that deprivation is only experienced when compared to others who are more fortunate (see Figure 3.2). In his model, a significant difference between actual and expected advancement reveals the overall well-being and vigor of the institution. In other words, social unrest is a subjective response to a sudden reversal in fortunes after a long period of growth (Davies 1962). The strength of relative deprivation is evaluated by charting and changing the expected change of actual well-being levels against expected well-being figures. For a given construct of well-being (cf. the discussion in Chapter 2), a lack of statistically significant differences between expected and actual well-being levels implies no discrepancy and no social unrest; significant differences implies the opposite. This is a key research 34
A Transformative Service Framework
concept: as the model suggests, if relative deprivation is not in effect, social turmoil does not occur regardless of the actual state of well-being. Given a satisfactory answer to Research Question 2.1, this model is employable in the evaluation of Research Question 3.
Figure 3.2: The Davies J curve
In his dissertation “Conditions of Happiness” noted Dutch psychologist Ruut Veenhoven wrote “The more healthy and active the citizens and the smoother their contacts, the greater the chance that society flourishes. Moreover, widespread dissatisfaction with life tends to act as a bomb under the social system (Veenhoven 1984, 404).” This is in agreement with the argument of Davies that significant issues of well-being manifest in (sub)groups of the population, and negative well-being will follow a Davies J-curve distribution (Davies 1962). This model indicates when social expectations have a large deviation from the actual outcomes of human well-being (relative deprivation), some form of social schism should be expected (Figure 3.2). A fitting and correct measurement of well-being can be leveraged to provide actual and expected trending of flourishing. With concurrent supervision, components that can cause agency loss (in this case, statistically significant drops in well-being data) can be proactively regulated as a form of adaptive community management. Applications for this sort of management tool are manifold: business, civil society, and public policy can benefit to name a few domains. Such a model has diagnostic value and can be exploited to have predictive worth. The predictive worth of the model is the potential to be used in charting future public participation- based unrest and movements. More concretely, given the community’s overarching well-being trends events causing communal spikes and dips in wellbeing can be pin-pointed and assessed.
3.2.2
Meso-level Analysis: The Role of the Self in the Community
As noted in (Ozanne and Anderson 2010), individuals, structural issues, and the socioeconomic context of a given area must be taken into consideration when completing
Related Work
impact assessments. Knowledge of the preexisting conditions and self-assessed roles of a given consumer group is necessary when designing and implementing services to increase communal well-being and/or decrease communal ill-being (Saatcioglu and Ozanne 2013). Well-being is not only access and psychological health, but the perception of one’s place within the greater environment. Individual well-being is intrinsically linked to the individual’s perception of belonging in a community, and their relative status within it. These singular assessments aggregate up to communal well-being. This is to say, in areas where high individual well-being exists, there tends to be high communal well-being. In areas of compounded disadvantage, well-being and its related outcomes tends to be low. This is confirmed in the Framingham Heart Study: high and low well-being networks tend to be clustered within three degrees of separation from one another (J. Fowler and Christakis 2008). This is especially relevant for mapping the contours of a community based on its sentiment (Research Question 3). The proposed meso-level environment for transformative services is closely aligned to George Vaillant’s finding on the antecedents of flourishing from the Harvard Grant Study, to date the longest running longitudinal sociological study. He writes that formative experiences are crucial to future health and happiness; the presence of positive relationships matter for happiness; the risks one takes with their lives (e.g. drug and alcohol consumption) have high prediction abilities on one’s ability to maintain family and social relationships (Vaillant 2008). Meso-level analysis is not foreign to the TSR agenda: quoting (Ostrom et al. 2010, 9), TSR considers “[…]the disparity in the quality of service offerings to different groups, the design and co-creation of services with consumers that honors both the agency and the cultural values of individuals and communities, […]”, which requires an understanding of the person and their understanding of belongingness in their community. Longitudinal surveys, panels, and various forms of network analysis can establish the indicators of the meso-level. Data gained from international databases and surveys are well utilized at this level. Considering this, and the other well-being oriented indicators from the largest public surveys, and how to parse the various important domains into a taxonomy is an important, ongoing challenge for TSR. Synopses of the largest international and national instruments are below, and a comparison table can be found in Table 3.1.
Kingdom of Bhutan The Kingdom of Bhutan provides a point of reference of how well-being can be used as a framework for wider stakeholder accountabilities (Thinley 2011; Bhutan 2012). In the late 1980’s, the kingdom conjoined externally imposed indicators such as Gross Domestic Product (GDP) per capita and the state of the environment as a measurement of the state of health with a focus on national well-being assessments as the central key performance indicator in its Five Year Plan of development. As stated in the national planning guidelines: “Apart from the obvious objectives of development: to increase GDP on a national level and incomes at the 36
A Transformative Service Framework
household level, development in Bhutan includes the achievement of less quantifiable objectives. These include ensuring the emotional well-being of the population, the preservation of Bhutan’s cultural heritage and its rich and varied natural resources (Bhutan 1991, 1:6).” This statement is clearly indicative of the full inclusion of macro, meso and micro indicators of TSR. This process has been furthered in two ways: time-lapsed surveys, and well-being framework integration. The surveys give status reports on the health and vigor of the nation, where framework integration serves to further the stated policies of governmental planning commissions. Frameworks of well-being and its conditions are being integrated into public programming and services, as well as national universities and the public bureaucracy (Bhutan 2012). Impressive results ensued: According to the United Nations Development Programme since the inception of its well-being focused Five Year Plans, Bhutan has made major strides (Kumar et al. 2007). Its GNI per capita of $1,005 (in 2005 dollars) was 40% higher than that of India, and over 70% higher than the average income of low income countries. The country’s human development index grew from 0.325 in 1984 to 0.583 in 2003, placing Bhutan in the category of medium human development countries (Kumar et al. 2007). In implementing an enhanced indicator series Bhutan has a more reactive, finer tuned, and richer set of data from which to base its policy decisions.
European Union There has been an upwelling of attention directed at understanding and measuring well-being as a conceptual and practical compliment to myriad macro and micro indicators and as policy and decision making tools. A prominent example is the Commission on the Measurement of Economic Performance and Social Progress, formed by Nicholas Sarkozy during his term as president of France (Stiglitz, Sen, and Fitoussi 2009). This working group and report are the most notable examples of reconfiguring “standard” measurements and related constructs as measures of national progress and well-being. This study concentrates mainly on the macro and meso indicators of the TSR framework. Due in part to its provocative findings, on-going efforts are in place across the European Union and worldwide. The United Kingdom’s Office of National Statistics is most comparable to the TSR framework in the European Union. It publishes overview data of national well-being twice a year, in addition to a European comparison report. The reports take care to highlight particular communities of interest; children, minorities and recent immigrant to name a few. This reporting series is notable as it, like Bhutan, integrates national, communal, and personal wellbeing indicators in its assessment. It is also the most fully integrated system of well-being assessments at the national level in the European Union. Not only policy makers but the public has access to review and comment on the drivers of well-being in the United Kingdom due to their open statistics API.
Related Work
In a similar effort, the German federal government conducted a national study called "Growth, prosperity, quality of life - Towards a sustainable economy and social progress in the social market economy" in 2013 (van Suntum 2012). They argued that GDP is no longer a complete picture of the quality of life in Germany, and the German people and the government need a more complete overview of the quality of life of the Germans. An "improvement of statistics is necessary [...]" (van Suntum 2012), and policy goals based on better assessment of what makes a happy, health community is a contemporary solution to this challenge (Ballas 2013). Thereby the German Parliament proposed ten new criteria to measure the country’s health and wealth. The most significant additions from the perspective of progressive policy making of the new criteria are the indicators material well-being, social affairs and societal inclusion (all meso indicators of TSR), as well as ecology (a macro indicator of TSR).
Eurobarometer The Eurobarometer survey5 is taken twice yearly at the behest of the European Commission’s Directorate-General for Communication and is aimed at gauging public opinion in (and largely about) the European Union. Its focus is not on happiness or well-being per se; rather, it aims to assess public attitudes (in all 27 members of the European Union) towards matters of public import in the EU. In the context of TSR, this is a complement to surveys such as the General Social Survey (GSS) that aim to measure well-being directly. The Eurobarometer series measures PWB of the individuals associated with, and affected by the EU. For the purpose of TSR, the EU exemplifies a service-providing institution and the Eurobarometer survey illustrates how one such institution measures its performance in the eyes of its clients. It is worth noting that the EU, as of the last available report,6 is in turmoil due to continuing effects of the major worldwide economic recession of 2008, including the continuing financial crises of Greece and other EU members, and the continuing struggles with other major policy decisions. For present purposes this makes the EU a highly interesting institution. How do the EU’s well-being assessments (broadly construed) reflect this turmoil? While the absolute levels of prevalence of various opinions are surely important, arguably, changes over time are at least as valuable for policy design and institutional assessment. Significantly, the Eurobarometer report emphasizes throughout the dynamics of the attitudes it reports. The attitudinal variation among the 27 EU members is often strikingly large. In the spring of 2012 the survey found that those giving their country and overall “good” assessments ranged from 83% in such countries as Sweden, Luxembourg, Germany, and Finland to 0% in such countries as Greece, Spain, Portugal, and Ireland. This range narrowed in the fall 2012 survey from 75% to 1%. This is hardly an improvement, although it is consistent with the 5
For more information see http://ec.europa.eu/public_opinion/index_en.htm. Last Accessed: 17 June 2013. 6 This is available at http://ec.europa.eu/public_opinion/archives/eb/eb78/eb78_en.htm. Last Accessed: 18 June 2013.
38
A Transformative Service Framework
finding announced in the report that attitudes have been roughly stable of late. Looking at the EU, member states constitute a natural categorization by which to measure attitudes. But there are other natural categorizations as well which need to be considered, for example, by age, gender, occupation, and income. Even more so, people are multi-dimensional, which means that they will fall into several categorizations at once. What are the particularly vulnerable profiles? The larger meaning for TSR and for measuring well-being in smaller-sized institutions is that attitudinal variation may be critically conditioned on categories that may or may not be identified. Recognizing these categories should be seen as a continuing challenge for TSR.
OECD Better Life Initiative The Organisation for Economic Cooperation and Development (OECD) collects statistics and survey data extensively. Most relevant to TSR is the OECD Better Life Index.7 The OECD’s Better Life Index8 is composed of 11 “topics” (measured either by a single indicator variable or by an index of a small number of indicators). These meso indicators are: housing, income, jobs, community, education, environment, civic engagement, health, life satisfaction, safety, and work-life balance. The data for the Better Life Index also supports a degree of online analysis, and is fully comparative. In addition, links are available to the very large number of other data collections created and maintained by the OECD. Many of these will also be of interest to TSR scholars for the breadth of aspects which are covered.
International Social Survey Program and the General Social Surveys The International Social Survey Programme (ISSP), at http://www.issp.org/, is the international umbrella organization coordinating the GSS management and archival of 48 countries. These countries are predominately developed countries, although some interesting statistics are available, such as those from China and Venezuela (two otherwise opaque countries). The ISSP and GSS have maintained the major of their questions since the inception of the survey in order to facilitate and longitudinal and replication of the information. The 1972-2012 GSS has 5,545 variables, time-trends for 2,072 variables, and 268 trends having 20+ data points.9 The GSS waves contain a standard 'core' of demographic, behavioral, and attitudinal questions, plus topics of special interest specific to a given wave. The GSS data are downloadable in various formats friendly for statistical processing. The website also makes available a basic online analytics capability for the data. The GSS specializes in trend data. Especially 7
http://www.oecd.org/statistics/datalab/bli.htm. Last Accessed: 7 March 2015. Accessible at http://www.oecdbetterlifeindex.org/about/better-life-initiative/; the data used to create the index may be found at http://stats.oecd.org/Index.aspx?DataSetCode=BLI. Last Accessed: 7 March 2015. 9 Available at: http://www.issp.org/page.php?pageId=4. Last Accessed: 12 June 2013. 8
Related Work
distinguishing in comparison with the other collections discussed, the GSS site lists about 300 published articles that use its data. The GSS is high quality, broadly scoped source of survey data pertinent to TSR. Of all the sources reviewed here, it is likely the one that has been used the most in scientific publications.
Data Sources
< Yearly
Yearly
> Yearly
Level
Integration
Institutional
Well-being
Economic
PWB
SWB
Table 3.1: National and international well-being measurement instruments
●
◑
●
●
○
●
○
Interviews & Questionnaires
France
◑
●
●
○
○
○
●
Ex-post Indicators
●
◑
●
○
○
○
●
Ex-post Indicators
United Kingdom
●
●
●
●
●
○
○
Questionnaires
Euro-
●
●
●
◑
●
○
○
Interviews
◑
●
●
◑
○
●
○
Questionnaires
●
●
◑
◑
○
●
○
Questionnaires
barometer Better Life Initiative General Social Survey
International
Germany
National
Bhutan
○ not covered
◑ partially covered
● covered
As seen in Table 3.1, the most complete well-being instrument is located in the United Kingdom; it is however limited to Britain, Scotland, and Northern Ireland. The Eurobarometer is much more expansive, though its institutional integration is limited at making suggestions for increasing well-being of European citizens. It has the further limitation of being interviewbased, indicating that only small proportions of the citizenship can be addressed at any point. Both France and Germany currently concentrate on ex-post macro indicators; while a laudable start, such indicators can no longer be understood as a proxy for well-being due to their macro nature, the time-lagged delay in data collection, and too-broad definition (as discussed in Chapter 1). It can be seen that while data is being collected at the national and international level, still be the implemented is a well-being indicator feeding into a TSR application that is near to real time, with low-cost and scalable data collection methods.
40
A Transformative Service Framework
3.2.3
Me, Myself and I: Micro Profiles and Well-being
As mentioned earlier, an important factor in well-being is the baseline psychological profile of the person. Considering psychological profile is of upmost importance when measuring service perception as shown in Figure 3.1, as it is well-established that different personality types report satisfaction and well-being with difference reference points. Confirmed in multiple studies, psychological factors like low(er) needs for circumstance maximization, psychological needs satisfaction, personal goal progress, high self-esteem, and a positive Big Five Inventory10 profile are prerequisites for high well-being (John et al. 1991; (B. Schwartz et al. 2002; Purvis, Howell, and Iyer 2011; Hall, Caton, and Weinhardt 2013; John, Donahue, and Kentle 1991; Sheldon and Hoon 2013). Maximization refers to one’s ability to be happy with a decision once it has been met. The more one “maximizes” a decision making scenario, the less happy one is in the long term, ‘the paradox of choice’ (B. Schwartz et al. 2002). Considering psychological needs satisfaction, (Sheldon and Hoon 2013) modeled optimal human well-being with a hierarchical regression analysis, finding that there are four tiers of personality which are predictors of well-being. Their work shows that social relations, self-narratives, goals and life intention, personality traits, and psychological needs are all necessary for high well-being. The Big Five personality factors is the most well-known and widest used personality traits model in psychology, human resources, and a plethora of other institutions (John, Donahue, and Kentle 1991). A well-being inducing or positive Big Five profile is considered to be low neuroticism, high extraversion, and a combination of optimism, agreeableness, conscientiousness in the terms of this thesis (Purvis, Howell, and Iyer 2011; Hall et al. 2013; Sheldon and Hoon 2013). This level presents the most problematic measurement area. Institutionally defined and managed well-being requires a high level of trust between participants and stakeholders; the design of transformative services requires substantial participant support and participation. Generally speaking, psychometrics are left for the domain of psychology and are strictly outside of service design and policy-making. This is because the type of data could be used to observe not only public but also private life domains. Whereas responsible designers use wellbeing to view the institution’s overall progress, satisfaction, and capacity, irresponsible management could use well-being data to pin-point those who do not “fit in” with institutional standards or desires, as well as the risk of identification of reportedly anonymous participants (Zimmer 2010). Other irresponsible uses of data can include harm by incidentally altering the well-being of (unwitting) participants as was seen in the study on emotional contagion by (Kramer, Guillory, and Hancock 2014). This is especially relevant in the case of participants with a high vulnerability level as assessed by the meso-level interaction (Markham and
10
The Big Five are Openness, Conscientiousness, Extraversion, Agreeableness, and Neuroticism.
Related Work
Buchanan 2012). Participants will need to place significant trust in stakeholders to ensure validity and reliability of the data (such as the example in the United Kingdom). With potential issues recognized, the prospective uses for psychological factors to TSR are still manifold. Research designs for establishing this level include ethnographies (e.g., (Saatcioglu and Ozanne 2013)) and psychometric surveys (Kahneman et al. 2004b; John, Donahue, and Kentle 1991). Both methods are considered expensive in terms of funds and time. Therefore, researchers are concentrating on less expensive mechanisms to measure psychometrics, especially considering the digitalization of daily life since the advent of the internet. The coming sections introduce state of the art mechanisms for the measurement of well-being.
On the Application of Social Media Platforms for Social Sentiment Analyses “Social Media is a group of Internet-based applications that build on the ideological and technological foundations of Web 2.0, and that allow the creation and exchange of user generated content” (Kaplan and Haenlein 2010, 61). Social media enables researchers to collect and analyze large scale, unobtrusively gathered, individual data. Researchers previously faced two common obstacles. Firstly, even if social data is gathered at a sufficient level, information is often spread over various agencies, precluding efficient analyzing processes. Secondly, it requires steady collection updates over time to register movements in social characteristics (Hackenberg 1970). The longer the time span between updates is, the less accurate the data and thus the analysis can be, as several other reasons might have occurred in the same time interval. In the late 1960s computational innovations resulted in a shift of challenges: The restricting parameter for work of social researchers was no longer the processing of data. Instead, information grew at a rate faster than researchers could analyze (Cioffi-Revilla 2010). Considering the decades since the beginning of globalization, quickly developing (digital) technology and fast moving economies, the developments in people’s daily lives become at once more transparent, yet more difficult to understand. This is due in part to the rise of networked, social data. Hand in hand with technological and digital evolution is the capability to collect and process information. Modern social data shares these attributes: 1) Large (easily) extractable amounts of data 2) Continuous data streams over time 3) Spatial and design independence for researchers
42
A Transformative Service Framework
Social media sites in particular have quickly ascended from a novelty of the early 2000’s to a fact of life, and daily necessity. Today, Facebook is accessed daily by ten times more people than the population of Germany.11 Users interact online by creating profiles and providing (semi)personal information in form of text, photos and other media (Röll, 2010). Röll summarized that while motives for using the Social Networking Sites range from staying in touch with fellow friends and dating services to establishing professional business networks, all pages share predefined rules how social connections are made. These rules are what determine the resulting social network. In most cases mutual acceptance is required to link two profiles (e.g. Facebook and LinkedIn). Exceptions exist: On Twitter and Google Plus (to some extent) any user can receive information from any profile of interest. These connections define how users can share and receive different kinds of user generated content. Due to the fact that social networking and media platforms are generally based on true identities or variants thereof (Lingel, Naaman, and boyd 2014), they are well suited to display online communities. Facebook is the largest platform and with its 864 million daily active users in the end of 2014 (1.35 billion monthly active users) is also the most active one, with one in every seven minutes worldwide (and for Americans, one in every five minutes) being spent on Facebook.12 Facebook requires mutual agreement for users to link as friends. User generated content can be shared via posts which appear on ‘timelines’ of users, pages and groups. Users may further share content by referring to an already existing post with a commenting function. Users control privacy by defining rules for individuals or groups, and private or targeted messages are allowed, assuming the recipients’ privacy settings allow for it. Facebook offers the feature of ‘Pages’ that differ from the standard user profiles. Unless specifically restricted in the page’s settings, the information on these pages are completely public.13 This important distinction from user profiles allows researchers to gather data of most publicly acting online communities without further requirements. In an exhaustive survey, (R. E. Wilson, Gosling, and Graham 2012) summarized and classified 412 articles written on Facebook for the period 2007-2012 leading to five supra-categories: descriptive analysis of users, motivations for using Facebook, identity presentation, the role of Facebook in social interactions, and privacy and information disclosure. The review addresses key articles across these five categories, and the methods employed by the various scholars. Recognizable is that the usage of Facebook’s API by non-Facebook staff or partners to support unobtrusive studies is low; when the referenced studies apply quantitative methods, the method of choice tends to be based in survey methods. Notable studies from Facebook Research look at public expressions of sentiment. (Kramer 2010) used status updates based in the United States to create a composite well-being index. 11
http://newsroom.fb.com/company-info/. Last Accessed: 12 March 2015. http://techcrunch.com/2014/07/23/facebook-usage-time/. Last Accessed: 12 March 2015. 13 https://www.facebook.com/help/387958507939236. Last Accessed: 7 May 2015. 12
Related Work
This has since been criticized in (Wang et al. 2014), who state that Facebook status messages are not appropriate for well-being assessment, but rather mood regulation. Another series of studies by Kramer and colleagues (Kramer 2012; Kramer, Guillory, and Hancock 2014) reviews emotional contagion on Facebook. These studies report that emotions are indeed contagious in a network. Their findings support that short informal text like Facebook status updates can be used to measure sentiment online. Further confirmation can be found in (H. A. Schwartz et al. 2013), who collected and analyzed 74,941 Facebook profiles with LIWC and were able to establish linguistic characteristics of personality, gender, and age. In depth discussions on the use of Facebook in sentiment analysis can be found in Chapters 5.1 and 6.1.
Gamification as an Incentive Mechanism In gamifying well-being, leaders take proactive steps towards smart community management. Acting as a thermometer by which to gauge institutional health, well-being data serves not only as a feedback mechanism between various actors and policy makers, but as a forwardlooking decision making tool (Ahn et al. 2011; Frey and Stutzer 2007). Thus there is widespread interest in tracking mechanisms with high popular acceptance. Until recently, attempts to collect well-being data as an institutional feedback mechanism have been scarce. More recently, a number of other platforms exist that bind some or all of the principles of online social networks, well-being, and gamification. Some of the most popular and notable examples include Superbetter,14 the Wellbeing Game,15 the Happiness Initiative,16 and Track Your Happiness,17 though this list is by no means a comprehensive list of all well-being and happiness measurements available online. Such platforms either attempt to increase personal well-being and happiness via tips and tricks (Superbetter, The Happiness Project, the Wellbeing Game), perform basic measurements and trends of happiness reporting (Track Your Happiness), or are a hybrid of both (the Happiness Initiative). Of particular interest are platforms which elicit well-being reports, as they functionally serve as a stated preference data collection method with respect to happiness and well-being. Emerging work from Vella and Johnson is especially valuable in clarifying the use of gamification in terms of Human Flourishing (Vella and Johnson 2012; Vella, Johnson, and Hides 2013). Their work matches each of the ten Human Flourishing items with up to date findings from the gaming literature. Focusing on studies which relate to well-being or mental health of gamers, this work neatly ties the two sometimes disparate worlds of happiness research, gaming, and collaborative computing. This work does not however propose the design or mechanisms for a well-being game. One idea is the use of social networks, as they can be extended by platform features if a gamified application is designed for use within a 14
https://www.superbetter.com. Last Accessed: 18 December 2013. www.thewellbeinggame.org.nz. Last Accessed: 18 December 2013. 16 http://www.happycounts.org. Last Accessed: 18 December 2013. 17 http://www.trackyourhappiness.org. Last Accessed: 18 December 2013. 15
44
A Transformative Service Framework
social network (Hall et al. 2012). Besides the social features “leaderboard” (social comparison) and “sweepstakes”, social sharing (“gifting”) gains importance. The incentives “bragging” (notification of one’s social network of achievements) and “inviting” (advertise usage within one’s social) extend the toolbox of gamification methods and serve at the same time as a spreading mechanism for the gamified application (Siegel 2012). Despite earlier use, the term “gamification” did not see widespread adoption before 2010 (Deterding et al. 2011). Since then different parties have used it with different scopes and connotations. An often-cited definition is that of Deterding. It tries to incorporate the different viewpoints and areas of applications by generically subsuming: “Gamification is the use of game design elements in non-game contexts” (Deterding 2011, 9). However, not all agree. Based on their background in service marketing, Huotari and Hamari, for example, state that it depends on the individual perception of a user if a service is gameful, making it impossible for a service designer to identify the non-game context central to Deterding’s definition (Huotari and Hamari 2012). They specify gamification as “a process of enhancing a service with affordances for gameful experiences in order to support user's overall value creation” (Huotari and Hamari 2012, 19) – prioritizing the of creating better experiences instead of achieving them. The current discussion also covers the transformational opportunities brought through gamification, namely the positive effects that gamification can foster in crowdsourcing or in collaboratively changing the world for the better (Stampfl 2012). The next discussion point becomes applying game design elements in an effective way. A commonly shared and expressed finding is the separation of human motivation into intrinsic and extrinsic components, with current gamification approaches largely (only) supporting the latter one. Siegel therefore suggests taking special care to create a plausible, linked, and in difficulty increasing system of leveling in gamified applications (Siegel 2012). “Leveling” refers to the progress a user makes in discovering the possibilities of an application. He states that ideally several pathways, tailored to varying personal interests, should guide the user in exploring more comprehensive features. Antin and Churchill argue that motivation and social engagement are not automatically supported by using badges: They posit a dependency from the activities that badges are to award and from context. They discern the five functions – goal setting, instruction, reputation, status/affirmation, and group identification – stating that “the fun and interest of goal seeking is often the primary reward itself” (Antin and Churchill 2011, 2) and that the (wrong) usage of badges could even reduce a user’s intrinsic motivation. The possible reduction of intrinsic motivation by deploying extrinsic motivators is also described by Deterding who hints on the dependence from social situation or context. He argues that supporting a leaderboard with cash incentives counters a user’s autonomy and thereby intrinsic motivation (Deterding 2011). Further context sensitivity is brought in by Dixon who presents several models for Player Types – each with differing core motivations for playing – and who states that gender and age are an influence to playing motivations and
Related Work
behavior (Dixon 2011). A possible solution besides “personalizing” the respective system through detection of a user’s personal type, Vassileva suggests letting the users choose their preferred goals within the gamified application according to prior intrinsic motivation. This can include showing different (or “exaggerated”) data according to the choice. The common separation of human motivation by intrinsic and extrinsic components is extended by a social one. Two elsewhere in literature not often seen incentives are illustrated: social comparison and community collaboration and quests as a form of challenge that can be resolved by cooperation amongst users, occasionally including time limits (Vassileva 2012). Gamification is a quite obtrusive method of eliciting data, in addition to the fact that any data obtained in this process is per definition stated preferences (estimates of behavior) rather than revealed preferences (actual behavior). Both aspects have a place in behavioral modelling. In order to address revealed behaviors, another method is required. This is discussed below.
Text and Sentiment Analysis Tools In terms of a revealed model, text and sentiment analysis is a promising mechanism. Text pulled from social media has the benefit that it is largely unspoiled by research design, and offers a highly granular view of the posting individual. Using short informal text as the foundation of public sentiment measurement differs from other text due to the shortness of the text and the different language used (Thelwall et al. 2010). Word count restrictions, the usage of abbreviations and emotional tokens is fostered, leading to informal text containing slang, abbreviations, and emoticons in various forms and styles as well as truncated sentences (Wang et al. 2014). While this type of short informal text challenges Natural Language Processing, the existence of items like emoticons can help to understand the intended sentiment. Emotive values can be established by human readers or automated text analytics programs. Humancentric approaches have a long history and are well applied in varied domains (Hsieh and Shannon 2005; Kassarjian 1977), but lack scalability. When dealing with the volume required by Big Data analyses, either crowdwork (e.g., (Hall and Caton 2014; Paolacci, Chandler, and Ipeirotis 2010)) or automated programs (Balahur and Hermida 2012; Kim et al. 2006) are generally required. Crowdwork for the analysis of items like status updates and tweets however posed both ethical issues (Markham and Buchanan 2012), and can run afoul of the platforms’ terms and conditions. Two mechanisms are widely used to support the automated recognition of written sentiment: corpus-based approaches and dictionary-based approaches (Turney and Pantel 2010). The corpus-based approach is based on the co-occurrence of words and relies on the latent relation hypothesis, stating that words with similar meaning or sentiment co-occur more often in a sentence or passage than words expressing differing sentiment (Turney and Pantel 2010). Given a core set of known and evaluated words, this methodology identifies words with similar orientation. This approach can be especially useful when trying to search for instances of sarcasm or ironicism which is otherwise lost in the
46
A Transformative Service Framework
dictionary-based approach (Liu 2010). However, it requires a huge corpus to cover most of the words within the respective language. Dictionary-based approaches use predefined word lists containing sentiment-loaded words. By scanning the considered text, sums of positive and negative affect can be derived, usually normalized regarding the length of the overall text. Kramer subtracts said sums to get a onedimensional measure of sentiment (Kramer et al. 2004; Kramer 2010), whereas Golder and Macy argue the independence of both dimensions by measuring them separately (Golder and Macy 2012). While Kramer has used the Text Analysis and Word Count program that was built upon the Linguistic Inquiry and Word Count (LIWC) 2007 dictionary, Golder and Macy directly used utilized the LIWC 2001 dictionary (Tausczik and Pennebaker 2010; Pennebaker et al. 2007). Other dictionaries e.g., SentiWordNet (Baccianella, Esuli, and Sebastiani 2010) or OpinionFinder (T. Wilson et al. 2005) are also available. Whereas SentiWordNet sums up possible positive and negative sentiment and the third term of “neutrality” (Baccianella, Esuli, and Sebastiani 2010), OpinionFinder has its focus on classification of subjectivity and objectivity within sentences (T. Wilson et al. 2005). To date, both lack linguistic localization, a feature making LIWC’s 13 available languages favorable. The dictionary-based approach, however, is unable to find domain specific orientations and context oriented sentiment (Thelwall et al. 2010). Included in (Dodds et al. 2011) sentiment analysis are tweets surrounding Osama bin Laden’s assassination and the end of the blockbuster show ‘Lost’. It marked May 2, 2011 one of the most negatively affected days within the Anglophone twittersphere due to words like “dead”, “killed” and “terrorist.” Lost’s finale also resulted in a distinctive drop in happiness on the day it was released, but it was not due to sadness over the show ending. The word ‘lost’ was tagged as a negative sentiment word in the utilized dictionary and therefore scored all mentions negatively. Table 3.2 gives a brief overview of the most widely used sentiment analysis packages.
Related Work
Automated
WordSmith
●
○
○
●
○
General Inquirer
○
●
○
○
○
Senti-Strength
○
●
○
◑
●
SentiWord-Net
○
○
●
○
●
LIWC
○
○
●
●
◑
○ not covered
◑ partially covered
Functioning
Localization
based
Dictionary-
Method
Mixed
based
Corpus-
Table 3.2: Comparison of existing dictionary-based sentiment analysis packages
● covered
In addition, each tool has positive and negative attributes making it more and less suitable for the use of sentiment analysis for Transformative Service Research. These attributes are summarized in Table 3.3.With this consideration set LIWC shows itself to be an especially interesting tool for application in online social media use cases.
48
A Transformative Service Framework
Table 3.3: National and international well-being measurement instruments Strengths
Criticisms
Context-sensitivity allows for higher accuracy in representing the meaning of
1) Corpus-establishment is a complex task and a bad corpus leads to poor results
General
the text Allows for sophisticated context
2) Unproven with Online Social Media data Complicated adaption processes for
Inquirer
analyses
different studies restricts number of
Senti-
1) Basic context consideration for
analyzed categories in practice Restricted to emotion valence only
Strength
booster words to scale emotion (e.g. ‘very’)
WordSmith
2) Specialized for short informal texts (e.g. internet expressions, abbreviations) SentiWord-
1) Robust results for emotional valence
Net
detection 2) Extended valence scale (includes
LIWC
‘objective’ as neutral) 1) Flexibility (editable dictionaries) 2) Applied to Online Social Media use cases
Restricted to emotion valence only
Missing context observance leads to misinterpretations
3) Easy analysis of broad language dimensions
Linguistic Inquiry and Word Count LIWC originally was not intended to be used on short informal text, but to analyze text of expressive and therapeutic writing sessions usually containing more content than the average tweet or Facebook update (Wang et al. 2014; Tausczik and Pennebaker 2010). However, its expansive psychometric dictionary offers a unique opportunity to reveal the latent emotional context of text-based data. LIWC has been shown to possess excellent precision and recall abilities with high but not overfitting correlations in the analysis of latent sentiment (SalasZárate et al. 2014; Mahmud 2014), though its performance in prediction tasks is often low compared to n-grams or machine learning approaches (Komisin and Guinn 2012; Balahur and Hermida 2012). The application of LIWC on documents returns the percentage of words across the categories social processes, affective processes, cognitive processes, perceptual processes, biological processes, work and achievement, as well as punctuation and structural details (Pennebaker et al. 2007; Tausczik and Pennebaker 2010). Per cent based information gives the researcher a mechanism by which to see the relative worth of categories in speech. This facilitates measuring change, looking for group-based patterns, monitoring individual spikes and dips, and identifying psycholinguistic profiles.
Related Work
LIWC’s development and validation was an iterative process of word collection, during which several rating scales, standard dictionaries, and experts were consulted. The resulting broad list was coded by three independent judges’ who first indicated if a word should or should not be included, then categorized words according to conceptual lists. Their work was then externally validated for psychometric validity in a process that took three years (Pennebaker et al. 2007). Two versions of the LIWC dictionary currently exist -2001 and 2007 – and it is available in 12 languages to date.18 Several studies have shown its proficiency with short, informal text (Lin and Qiu 2013; C. Chung and Pennebaker 2014). This is not a trivial statement. Social media sites drastically limit word counts of single authors compared to traditional sources (Kramer et al. 2004). Abbreviations (e.g. “howru” for “how are you”), purposely misspelled words (e.g. “helllooo”), special phrases (“lol”) and emoticons ( e.g. “:)” ), which are pervasive in short, informal online texts usually cannot be processed by sentiment analysis toolkits (Wang et al. 2014). The previous section discussed the importance of contextual settings to avoid misinterpretation of words and complete sentences. In addition, in science exists serious interest in automated content detection of documents, an important branch of text analytics (Lazer et al. 2009; Balahur and Hermida 2012). When people share (written) information, there is not only content but also the way they create their message and the linguistic style (C. Chung and Pennebaker 2007). They found that function words are well suited to build a systematic picture of this inconceivable dimension as latent indicators. They refer to pronouns, prepositions, articles, conjunctions, and auxiliary verbs and altogether can be imagined as “[…] the linguistic “glue” that hold content words together” (Groom and Pennebaker 2002). While LIWC focuses on function words it also includes content words. The functionality is based on dictionaries that assign over 4,500 words to 70 different categories, ranging from a simple stylistic (e.g. article, prepositions) to a complex psychological level (e.g. positive emotion, cognitive words). Due to their near constant usage and grammatical weight, use of function words is nearly impossible to manipulate and thus will uncover motives, personality and psychological processes more accurately than analysis of the content (Pennebaker 2013). Using computational tools in analyzing function words bears further advantages. Firstly, people’s poor awareness of function words is not restricted to their own language. The listener doesn’t focus on function word composition, and therefore is unable to rate usage. Hence, computational pattern matching can reveal findings not attainable by human judges. Secondly, less than 0.04% of an average persons’ vocabulary are function words (C. Chung and Pennebaker 2007). At the same time, they make up more than half of daily language. Consequently, function-word based analyses are well-situated to reveal latent individual states. All in all, the function word’s importance on psychological findings justifies the application of the simpler dictionary-based approaches wherever emphasis is set on personal traits.
18
Arabic, Chinese, Dutch, English, French, German, Italian, Portuguese, Russian, Serbian, Spanish, Turkish
50
A Transformative Service Framework
Given its flexibility, ease of use, and localization, LIWC has been applied as the sentiment analysis toolkit of choice in many social indicators (e.g. happiness, characterizing network relationships, and opinion mining) studies (Lin and Qiu 2013; Niederhoffer and Pennebaker 2002; Ott et al. 2011; Pennebaker, Mehl, and Niederhoffer 2003). As such, numerous social benchmarks have been established and validated in cross-cultural and linguistic arenas. A summary of the most robust findings are listed below. Happiness and Well-being LIWC studies have demonstrated its capability in capturing two different dimensions of the happiness construct understood in the terms of psychological well-being (see Chapter 2.1 for an overview). In terms of the construct positive emotion, the study by (J. T. Hancock, Landrigan, and Silver 2007) researched which language dimensions shift based on whether the writer experiences positive emotion and is in a happy mood, or is situated in a context evoking negative emotion (Hancock et al., 2007). Intuitively, positive affection was found to score higher in the positive situation, and negative affection for the negative situation, respectively. This study isolated the LIWC categories ‘positive feeling’ and ‘negative feeling.’ Furthermore, participants in negative emotion employed negations more frequently while communicating. LIWC results of positive and negative emotion words were found to correspond with human ratings of text samples, thus proving its suitability for automated valence detection of positive emotion (Alpers et al. 2005, 370) In accordance with its psychological origin, there has been much research on mental health assessment with LIWC dimensions. Whilst not as central to general community analysis, positive functioning and characteristics are important factors of well-being (Huppert and So 2013). Rude and colleagues revealed that people draw their attentional focus to themselves, when being in physical or emotional critical situations (Rude, Gortner, and Pennebaker 2004). They also use slightly more negatively valence words. Surprisingly an increase in first-person singular use was found to be a better marker for depression than emotion categories from the dictionary. Similarly, the usage of categories associated with higher cognitive complexity was significantly related to positive psychological functioning (Pennebaker, Mayne, and Francsis 1997). LIWC tracks these structures with numerable dimensions: ‘cognitive mechanism’, ‘cause’, ‘exclusion’, ‘negate’ and ‘prepositions’ are some examples showing increasing scores when complex processes accumulate. Communal Belongingness and Social Communication The existence of positive relationships and feeling of belongingness represents a further significant influence on well-being. (Baumeister and Leary 1995) describe the wish to belong as a basic human need, impacting well-being and health if not fulfilled. Belongingness describes the existence of interpersonal bonds providing the feeling of affective concern and
Related Work
stability. The need for belongingness is so critical, that total absence can be detected as a common driver in suicide attempts (Joiner Jr. 2005). Communal belongingness, as used in this work, refers to the ability of community members to feel being a valued part of and identifying themselves with the community (well in line with the micro-level of assessment of TSR). Communal belongingness is a valuable social indicator by which to describe communities. Among the several LIWC categories pointing to belongingness, frequency of first person plural pronouns is a powerful indicator. An investigation found that internet chat room data four weeks after Diana, former Princess of Wales tragically died in a car accident, registered sudden and significant increases of the category ‘we’ (Stone and Pennebaker 2002). This finding coincides with Joiner et al., stating that in times of national tragedies suicide rates drop due to an increasing sense of belongingness within the community (Joiner, Hollar, and Van Orden 2006, 182). Another suicide study comparing text samples of suicide attempters and completers detected that the LIWC category ‘inclusion’ (e.g. with, include) is an effective way to measure belongingness. This is especially effective when contrasting inclusive words with the category ‘exclusion.’ Finally, LIWC offers a supra-category named ‘social processes,’ comprised of a diverse set of word groups to characterize communal belongingness. Social communication also allows for determining status in terms of writers’ social hierarchy. Whilst high-status individuals refer frequently to other people (e.g. category ‘other’) low-status members tend to be self-focused and use tentative language (Tausczik and Pennebaker 2010). The authors also described the feature of linguistic immersion concerning emotion. They based this term on the results of a study dealing with women in abusive relationships (Holmes et al. 2007). There it was found that women used statistically significant more positive and negative emotion words when experienced pain was higher. It is intuitive to assume that, in general, adding emotion to communication depicts a deeper commitment to the subject, whereas formal and superficial descriptions lack emotive words. Linguistic Accommodation One basic requirement for LIWC being a usable tool is its ability to detect individual differences in language use. This potential was affirmed with the first study results (Pennebaker and King 1999). Yet, in mutual communication people frequently tend to converge their linguistic styles to promote social approval and communication efficiency (Niederhoffer and Pennebaker 2002, 339). This process is referred to as ‘Linguistic Accommodation’, ‘Linguistic Style Matching’ or ‘Linguistic Mimicry’ and is closely linked to the Communication Accommodation Theory (Giles, Coupland, and Coupland 1991). Several LIWC studies have elaborately researched this phenomenon and resulted that even in online chat rooms where stranger interact, mutual language adaption could be detected after several minutes and writing turns (Niederhoffer and Pennebaker 2002; Gonzales, Hancock, and Pennebaker 2010). Accommodation influenced word counts, emotive words, prevailing tense,
52
A Transformative Service Framework
complexity and many more. It was further revealed that intensity of adapting is not influenced by mutual liking, but rather by the degree of engagement to the conversation. That means a superficially friendly discussion will be more likely to depict individual differences than serious disputes. LIWC is considered well-suited for accommodation analysis, as linguistic mimicry represents a subconscious process, just as the function words LIWC focuses on (Gonzales, Hancock, and Pennebaker 2010). Obviously, subconscious partnership interest strongly increases degree of engagement, again supporting linguistic style matching. Deception People are considered to be the gold standard assessors of emotion and sentiment, and even people often have difficulties in detecting written deception (Ott et al. 2011). As a result automated lie detection is a fascinating research area as it goes beyond people’s natural capability, and has innumerable practical and research use cases. One mechanism that has been applied to detect false stories is occurrence of logical mistakes and inconsistencies, i.e. high complexity and topic information is required (J. Hancock 2007). Researchers have hypothesized that people who are actively engaged in deception additionally differ in the way they formulate the text. Whereas the lie constructor has some potential to control the story to pretend sincerity, subconscious language patterns (e.g. function words) may be affected when actively establishing an event instead of reciting it from memory (Newman et al. 2003). Newman executed a deception study with LIWC, instructing participants to write each an English text excerpt in support of and denial of abortion, presenting both views as if they were the own opinion. Across studies with different media input (elicited written statements, elicited typed statements, video-transcribed statements, email, micro-bogs) it was revealed that liars: 1) Used less first person singular pronouns, 2) Expressed more ‘negative emotion’, 3) Used less complex terms. The deceptive text samples reflected the missing personal relation to the story by their decreased use of first person singular references (‘I’). Previous literature on deception further detected the intention of liars to dissociate themselves from the lie, experiencing a bad conscience (Newman et al. 2003). Tension and guilt are the explanatory variables for the higher usage of negative emotion. Furthermore, the required cognitive resources to deceive somebody reduces comfort in adding structural complexity and results in a shift to simple, descriptive verbs. Hence the score for ‘exclusion’ dropped among liars and the category ‘motion’, consisting of simple verbs, showed an increasing frequency. With help of these findings LIWC was able to correctly uncover deceptive text samples with 67% accuracy. In contrast, human judges only classified 52% of the same data correctly,
Related Work
basically the performance of guessing (Newman et al. 2003). Obviously the critical difference in language between false and true stories does not only leak through the tellers’ subconscious without awareness, but is also hard to be captured by human judges, as they focus more on the content of stories than observing these hidden subtleties
5.3
Applications of TSR
TSR aims at measuring and improving well-being in connection with provision of services. Movement towards this goal requires, among many other things, 1) Identifying and understanding the variables that affect well-being in conjunction to the service experience, and 2) Obtaining said data. This chapter addresses that research gap by proposing an extended framework based on (Anderson et al. 2013) for the configuration and measurement of these variables, along with a comparison of existing data sources at the national and international levels, and possible methodologies to the collection of personalized data, namely gamification and text analytics (RQ 1.2). The foundational argument to this thesis is that currently missing are the tools and indicators needed for designing TSR for individuals in the service pyramid. An obvious and important use of currently existing data sources is to have them serve as benchmarks for the coming analyses. There are two such modes of use. The first is for validating new instruments to be developed by TSR scholars, as addressed in Section 3.2. Existing questionnaires and other instruments (see Chapter 2 for a review of well-being measurement instruments), as well as the data collected with them can be used in designing new instruments and in testing them, e.g., for application in serious games (RQ 2.1). A second valuable role of these data is to serve as comparison points for studies done at smaller institutions or regions, e.g., constituents of a given community (RQ 2.4). Very often, targets of TSR will be particular institutions (government agencies, commercial firms, NGOs, etc.) that are on a much smaller scale than the most widely-used, macro level surveys. Data targeted at a particular institution will be able to compare the effect of the institution against that of the larger society, or in the formalization of value co-creation between providers and consumers. In summary, this chapter addresses both of the listed requirements by surveying existing literature and exemplary application contexts (gamification and text analytics), and existing data collection efforts and archives that are relevant to TSR and that have high-quality data publicly available (e.g, the GSS and Better Life Initiative). A third contribution comes from the delineation of well-being terminology and applications in a way which moves towards a taxonomy of well-being measurement (RQ 2.1). Together, these sources of findings constitute 54
Applications of TSR
something of a map of (some) resources—both of a conceptual nature as well as hard data— available to the TSR community. Building on a wealth of existing knowledge and attending to new developments, TSR is poised to contribute enormously to fostering well-being.
On Defining Well-being for Progressive Community Management Chapters 2 and 3 address the first two research questions of this thesis. RQ 1.1 is addressed in detail theoretically, defining the attributes necessary for the use of well-being as an indicator. To do this, well-being was delineated and defined from three viewpoints: economics, philosophy, and psychology. A working definition of well-being for this thesis, introduced as Human Flourishing, was provided. Then the attributes of transformative service research are introduced as macro-, meso-, and micro- service interactions. Macro-interactions refer to the environment in which an individual exists; meso-interactions represent the self-perception of the individual’s place in that environment. Micro-interactions, by far the least addressed and most difficult area to measure, are the foundational psychological underpinnings which shade the view of the individual in a given situation. Each aspect is necessary to consider in TSR. In describing the necessary considerations of these three service interactions, RQ 1.2 is partially addressed. Data collection for well-being has until now been largely offline with representative populations via surveys and interviews. Unaddressed is the replication of such studies in online fora. Also unaddressed is the granularity of well-being studies, which is to say, what occurs when well-being is applied as an indicator for non-national scale assessment? In measuring the micro-interaction of TSR, online social media promises to provide abundant and varied data types from which to analyze personal well-being. The mechanisms and supporting technologies of serious gaming and text analytics and their respective methodologies are discussed as two particularly promising aspects of the digitalization of daily life from which to measure well-being (RQ 2.1). Gamification allows the elicitation of wellbeing in a stated preference scenario; text and sentiment analysis allow the reconstruction of revealed preference via actual behaviors and expressions. As such, this lays the groundwork for applied assessments of gamification and text and sentiment analyses based on online social media in the assessment of well-being for use in transformative service research.
Part III. Applied Well-being Measurement in Institutions
56
Chapter IV
BeWell: A Game of You on Facebook
“How to gain, how to keep, how to recover happiness is in fact for most men at all times the secret motive for all they do.” William James, Varieties of Religion Experience (1902)
R
esponsibly collected well-being data can drive proactive institutional management. Integrating the well-being data of individuals, and their history into a TSR application has practical implications that are directly applicable to institutional management: They can help managing complex communities or institutions beyond the less precise instruments employed today. The relationship between personal and communal wellbeing is the fundamental base for TSR. At the basest level, communities are made by personal (meso-level) interactions with other individuals, groups, institutions and events. (Micro-level) perceptions of these interactions drive personal perceptions of well-being, which among other indicators is a (macro-level) predictor of social cohesion (Thinley 2011), a necessary condition for progressive communities. Notably, it can be assumed that a significant drop in the projected long-term expectation of an individual’s or a community’s well-being is a clear indicator that calls a community manager to action – and provides a strategic advantage to those community managers that are in possession of a tool, in the best case online, that enables the evaluation of such measures (Davies 1962). The effectiveness of TSR depends on suitable data: It must reliably reveal the actual well-being level of individuals as a comparable measure and it must represent such levels timely distinct, yet granular enough to enable the construction of trends and their analysis. Together, this would allow for the precise tracking of well-being over time. For the purposes of this work, “institution” and “community” are used synonymously. Today’s institutional indicators, notably turnover rates, performance assessments, and absentee tracking are no longer adequate, as they do not possess the multidimensional aspects and conditional factors needed to manage institutions. The challenge facing the management of onand offline communities, as well as the overall success and health of institutions, is to identify fitting well-being indicators utilized in an appropriate method (Ahn et al. 2011; Anderson et al. 2013). Constituents, decision makers, stakeholders as well as human resource divisions lack adequate measures to determine the state of psychological or social health in their institution (Harter, Schmidt, and Keyes 2003; NEF 2009; Grant, Christianson, and Price 2007). This knowledge gap hinders decision and policy makers in implementing TSR. To circumvent 57
BeWell: A Game of You on Facebook
potentially significant gaps in knowledge, digital well-being measurement is needed as a “best practice” mechanism for tracking thriving on- and offline communities. The challenges in accordance with Research Question 1.2 are twofold: 1) A mechanism for well-being assessment has to be designed, and 2) A transparent yet secure data collector needs to be developed and tested. This work explores the possibilities of the use of gamification on social network platforms for individually elicited, real time well-being data in order to populate a TSR application. Firstly, a progressively larger series of surveys are implemented online as pilots; secondly, several machine learning algorithms are applied to data collected via surveys in order to provide insights regarding the dependencies between personal well-being (dependent variable) and personality as well as demographics (independent variables). Thirdly, gamification and its mechanisms are evaluated to address issues revolving around participation incentives using techniques in social network propagation. This gamification lead to the development and prototyping of BeWell: A Game of You on Facebook, a Facebook-based app for well-being measurement. This chapter is an exploration and extension of the collective works (Hall, Caton, and Weinhardt., 2013; Hall, Glanz, Caton, and Weinhardt, 2013; Hall et al., 2012) as well as the working paper (Wilckens and Hall 2015). It starts with a description of a pilot study, (Section 4.1) which reviews the validity of well-being survey items collected via online social media. Section 4.2 reviews two feasibility studies of the use of well-being for progressive community management and evaluates the statistical methods and machine learning algorithms used as the prediction engine of the eventual game. The prototype BeWell: A Game of You on Facebook is introduced (Section 4.3), then evaluated along with directions for future work in the measurement and assessment of personal well-being and online participation (Section 4.4).
4.1
Application of Design Science to BeWell
Context-dependency of the effectiveness of gamification methods is repeatedly expressed in scientific literature (see Section 3.2.3 for an overview of the literature). In this section, those incentive factors are introduced and discussed as they pertain to the iterations of this research. Further, four dimensions that served to analyze the incentive factors regarding their dependencies among each other and prerequisites will be presented. The original aims and requirements were to identify a subset of incentive factors whose effectiveness could be verified under laboratory conditions; it became apparent that a more sophisticated approach would be needed. To this extent, Design Science was employed.
58
Application of Design Science to BeWell
4.1.1
On the Suitability of Design Science as a Method
From a methodological perspective, the systematic process of design that is Design Science (Hevner et al. 2004; Peffers et al. 2007; Winter 2008) is well suited to address the research questions introduced at the beginning of this chapter. The usage of gamification elements to create an application to measure Human Flourishing is a novel approach to be addressed with an instantiation of an artifact. The application of two previously unused mechanisms together and the various interactions and context dependencies thereof need to be investigated in a manner that allows for rigorous evaluation. Prior knowledge on the interaction between Human Flourishing measurements and gamification is not available. Scientific literature emphasizes the context dependency for the efficient application of gamification elements in many respects (Antin and Churchill 2011; Deterding 2011; Siegel 2012; Vassileva 2012) therefore it is difficult to deduct findings from other gamified applications (see Seciton 3.2.3 for examples). The same is true for the purposeful, context-dependent inclusion of basic gamification elements from the knowledge base. Here, Design Science with its explicit expectation of creative contribution fits well. Finally, the Design Cycle advocated by this methodology is well suited to the research conducted by this thesis, as seen in Figure 4.1.
Figure 4.1: Design Science research cycle of (Winter 2008)
The ‘Construct-Model-Method-Instance’ cycle provides for the means necessary to iteratively create and improve such an artifact. This way, the lack of prior specification can be handled through constantly bringing in findings from related literature, combined with creative input from the researcher and continued evaluation, e.g. by test users. Design Science enables the iterative reflection and construction of an artifact to define, develop, demonstrate, and evaluate in a way that is tailored to the exploratory nature of the research at hand that is scientifically sound (Peffers et al. 2007). In case of this thesis, it means creating an artifact that investigates on the identified, relevant problem of measuring wellbeing as a serious game. Therefore, it must reliably collect truthful well-being data and incentivize its users to continuously provide this data. The artifact needs to be developed in a way that inherently allows for its evaluation, this way being suitable to provide a solid answer
BeWell: A Game of You on Facebook
to the research questions. It needs to be demonstrated that the artifact fulfills its purpose by setting it into a fitting application context. Design Science is distinct from general system building not only because it sets it emphasis on the creation of innovative artifacts, but it also inherently considers the evaluation of results. In accordance with the principles of Design Science, this thesis introduced four iterations of online and progressively gamified surveys. The iterations also had progressively more observations per participant. 1) An initial pilot study testing cross-sectional Human Flourishing reporting online (n=174), released on Facebook, 2) A longitudinal survey with four observation points evaluating Human Flourishing and personality in 2013 (n=85), announced on Facebook and email, 3) A larger scale instance of the second iteration (n=343) in 2014, announced on Facebook and email, 4) A fully gamified proof of concept (BeWell POC) iteration evaluating Human Flourishing and personality (n= 121), released on Facebook. All iterations were introduced and completed between July 2012 and March 2014. Iterations two and three were held consistently over the four Wednesdays that occur in February over two years to allow for consistency in reporting. Wednesdays were chosen to avoid spikes and dips in happiness due to the occurrence or ending of weekends. A test question “Take a look out of the window. How is the weather today?” was implemented at the start of each survey with a free-text box. This was used to both filter unserious respondents, and the mitigate the effect of the weather on mood (for a discussion of how to mitigate the impact of weather on subjective states, see (N. Schwartz and Clore 1983; Kahneman and Krueger 2006, 6)). The coming section discusses the design issues central to the application of gamification to wellbeing measurement.
4.1.2
Identification of Incentive Factors
Possible incentive factors that could be applied to the envisioned, final version of BeWell: A Game of You on Facebook were identified and clustered into different groups. The groups identified are “Inherent, nearly-exclusive incentives of BeWell” consisting of incentive factors that deal with the calculation, charting, and different forms of comparison of well-being data; “Further intrinsically motivated incentives” consisting of items that link to the helpfulness or demand for self-expression of the user; “Basic game mechanics” that describe an supportive application environment and point system; and “Social mechanics” that contain incentives designed to take advantage of the motivational effects of direct user-to-user interaction.
60
Application of Design Science to BeWell
Having identified a rather high number of factors in the literature (Section 3.2.3), each was examined regarding the four dimensions Implementability, Context, Testability, and Miscellaneous described in the below Table 4.1. Table 4.1: Dimension Implementability Context Testability
Miscellaneous
Dimension of incentivization in serious games
Description Are there serious constraints that could hinder the implementation of the proposed incentive factor? Is the functioning of an incentive likely to depend on a “real situation” that could not be simulated in a laboratory-like setting? Does it seem demanding to test an incentive factor because it would require a high amount of data or time, including the need of multiple sessions on different days (with the same test user(s))? Other possibly problematic points of interest, e.g., Does it seem likely that the usage of an incentive factor could interfere with the usage of another incentive factor? Does it seem likely that the usage of an incentive factor could interfere with the collection of unaffected (truthful) well-being data or with the basic protection of the users’ privacy?
In short, the context specificity of most incentive factors is indeed present, as well as interdependencies amongst the factors. Given the above considerations the creation of a proof of concept implementation that implements a plausible subset of the identified possible incentives was devised. That subset was chosen in a way to provide the necessary overall, interconnected context of well-being gamification. Additionally, testing should be done under realistic conditions, i.e. the proof of concept implementation should be released to Facebook.
4.1.3
Objectives of the Solution
The proof of concept implementation BeWell POC has a variety of objectives. That is caused by the fact that it bridges several areas of knowledge, namely bringing together gamification with well-being measuring as a web application while providing for built-in evaluation. The objectives are framed through an iterative process with multiple repetitions and refinements. It contains application of findings from literature review, the purposeful inclusion of success measures, building early proof of concept implementations, review by testers, comparison with other gamified applications, and the adaptation of best-practices. This way the objectives evolved from a rather small, mockup-based first vision to a more sophisticated, rather featurerich vision of BeWell POC. BeWell POC supports experimental setups and the collection and storage of an extended set of data. The data collected generally allows for being represented and analyzed in a variety of ways, including statistical methods (discussed in Section 4.3). BeWell POC focuses on the effectiveness of certain gamification incentives and the meaningfulness of the flourishingrelated data provided by its users. In the sense of Design Science, it is planned to be a step
BeWell: A Game of You on Facebook
within the overall iterative process to construct a gamified application for measuring wellbeing.
Primary deduction from gamification Besides motivating the decision to move on with the development of a proof of concept implementation following Design Science, the identification and examination of possible incentive factors also produced the following starting point for defining its objectives: BeWell POC needs to mimic a realistic environment for gamified well-being, including a basic “gaming platform” with the implementation of an adequately high number of additional, interconnected incentives. Additionally, BeWell POC should not use incentives that allow for the comparison of Human Flourishing scores as this form of comparison could have harmful influences on truthful reporting by some users (Ryff and Keyes 1995; Guven and Sørensen 2012). A constantly visible Human Flourishing of a specific social sub-network or of specific users could be (mis)interpreted to be a “reference score.” This could cause several reactions. It could be possible that a user with a non-average score experiences the (subconscious) urge to manipulate his reporting behavior to get closer to the reference score (Utz, Tanis, and Vermeulen 2012). While one can imagine that this is especially true for sub-scorers, depending on a user’s personality and/or social context also an adoption in the other direction could occur for high-scorers. Further, one could think of a behavior that aims at keeping a certain distance to the average or specific “benchmark” score (Dixon 2011). Just as well, users (overly) convinced of themselves could (subconsciously) regard it as necessary for their self-image to have scores over average or to “perform better” than specific users selected to benchmark against (Guven and Sørensen 2012). Further research can be undertaken regarding these suspicions, but the current iteration of BeWell POC will concentrate on the basic applicability of gamification to well-being measuring. The initial selection of this additional incentives was basically inspired by the list of possible incentives for “BeWell: A game of you on Facebook” (see left column of Table 8 in the first sub-chapter of the Appendix). Over the course of developing and extending BeWell POC to its release version, most of those incentives were implemented in some form. This is particularly the case for the groups “basic game mechanics” (14 - 25) and “social mechanics” (26 - 29). The incentives related to knowing one’s own well-being level and its evolution/history were the only ones from the group “inherent, nearly-exclusive benefits / incentives of BeWell” that were implemented by BeWell POC. This is due to the fact that incentives that allow for the comparison of Human Flourishing Scores were deliberately excluded. In an attempt to represent the group “further intrinsically motivated incentives”, badges were designed in the two distinct and leveled flavors “Scientific Advance” and “Better World”.
62
Well-being in Community Management
Iterative refinement and final scope Over the course of development, the primary objectives were refined and extended in the sense of Design Science. For building a foundation, a functional, error tolerant Facebook application is implemented and equipped with a configurable “Question Engine” that allows for reliable and varied data collection with support of different question types (slider-, pictogram-, and text-based). An algorithm to calculate the Human Flourishing Score of the user is designed and implemented based on the calculation of Human Flourishing found in Equation 2.3. Finally, a subset of additional gamification incentives is provided within the application to create a realistic environment for gamified well-being. From the necessity to measure the success of BeWell POC and due to the implications that the creation of a potentially far-spreading Facebook application has, additional or supportive objectives were deducted. Tracking capabilities that allow recognizing application errors, how the application is used by participants, and the use of incentive mechanisms by participants were implemented. Also, a built-in questionnaire function was implemented. All user-provided and tracking-related data was stored in a way that is privacy sensitive and allows for versatile analytics. Basic demographic data about the user, including gender, age, country of residence, and highest successfully completed level of education was collected in a way that allows for its change by the user to accommodate non-truthful reporting on Facebook’s About Me section. Further, recognizing the personal nature of the data collected basic protection of the user’s privacy is to be supported. Being a web application, counter measures against a basic set of well-known attacking methods in the web environment must be included. Finally, BeWell POC was localized in English and German, being the most prevalent languages within the expected user base. This was meant to lower entrance barriers and to reduce the risk of false reporting because of language-dependent misunderstandings.
4.2
Well-being in Community Management
To test well-being’s reliability when collected via online social media and the general willingness of participants to participate in TSR-like data collection exercises, a pilot study was conducted in July 2012. Using the definition of (Huppert and So 2013) the pilot looked at the ten basic items of Human Flourishing (see Section 2.1.4). The presence of positive emotion, competence (f1), meaning (f2), engagement (f3), positive relationships (f4), emotional stability (c1), self-esteem (c2), optimism (c3), resilience (c4), and vitality (c5), and demographic questions were asked in an online survey format (See Appendix I for survey details). The survey applied (Huppert and So 2013)’s Human Flourishing survey, as addressed and calculated in Section 2.1.4, Equation 2.3.
BeWell: A Game of You on Facebook
The responses showed high validity and a reasonable sampling of typical online social media consumer (For demographic information, review the work (Hampton et al. 2011)). This is a positive reflection on the ability of serious games to elicit data for the purposes of TSR. 174 respondents completed the survey. Of these, 22.4% answered in German and 77.6% answered in English. Respondents’ self-reported locations in North America (78), Europe (75), Asia (12) and Africa (1), with eight declinations to respond. 94 respondents self-reported their gender as ‘Female’, 74 as ‘Male’ and six respondents declined to report a gender. This gave a slightly higher response percentage from women (54%) than men (42.5%), a potential selection bias issue. Self-reported educational attainment shows 130 of the respondents hold at least a Bachelor’s degree. The age distribution shows that most respondents are between 20 and 40 years old (Figure 4.2(a)).
Figure 4.2: (a) Age distribution of the survey respondents, (b) Histogram of Human Flourishing scores
Based on the formula of Human Flourishing (Equation 2.3), a raw, human flourishing score (HFS) was calculated. The distribution of the HFS’s is shown in Figure 4.2(b) as a histogram, where the vertical line shows the cutoff value of 80% of the maximum achievable score, which was used by Huppert and So to distinguish between highly flourishing and the rest of the population in their initial study. Calculated at the .80 threshold, 13 participants (7%) would fit Huppert and So’s definition of being highly flourishing. This is considerably higher than the 7.3% reported in (Huppert and So 2013, 848), likely due to the differences in geographic regions sampled in the two populations (discussed further below). The mean value of HF is 0.49, with a standard deviation (SD) of 0.20. Non-parametric Mann-Whitney-U tests (Wilcoxon rank-sum tests) and Kruskal-Wallis tests revealed that there was no statistically significant difference between HF based on gender, age or education. However, a Wilcoxon test on the difference between HF reported from North America and Europe, (as well as a Kruskal-Wallis test between North America, Europe, and Asia) revealed statistically significant differences at the 1% level. That North 64
Well-being in Community Management
Americans self-report higher well-being levels than Europeans is well-established (Okuliczkozaryn 2011); it should be noted that self-reporting well-being and actual experience of well-being are not to be conflated. It would be incorrect to say that North Americans are happier than Europeans.
Positive
Vitality
Esteem
Self
Resilience
Optimism
Stability
Emotional
Meaning
Relationships
Positive
Engagement
Spearman’s rho of Human Flourishing with significance levels (***: p