I.J. Image, Graphics and Signal Processing, 2018, 2, 52-59 Published Online February 2018 in MECS (http://www.mecs-press.org/) DOI: 10.5815/ijigsp.2018.02.06
Detection and Classification of Signage’s from Random Mobile Videos Using Local Binary Patterns Shivanand S Gornale Professor, Department of Computer Science, Rani Channamma University, Belagavi, Karnataka. Email:
[email protected],
[email protected]
Ashvini K Babaleshwar Research Scholar, Department of Computer Science, Rani Channamma University, Belagavi, Karnataka. Email:
[email protected]
Pravin L Yannawar Assistant Professor, Vision and Intelligent System Lab, Department of Computer Science & IT, Dr. Babasaheb Ambedkar Marathwada University, Aurangabad, (MS) India. Email:
[email protected] Received: 12 September 2017; Accepted: 10 January 2018; Published: 08 February 2018 Abstract—The Traffic-Sign detection and recognition plays significant role in the design of autonomous driverless cars for navigation purpose as well as to assist a driver for alerting and educating him about the tracked signage on the road side. The main objective of this paper is to highlight an automatic process of detection of Region Of Interest (ROI) which marks or isolates signage’s from color video streams and performs classification of automatically detected signage’s based on support vector machine (SVM) classifiers trained over Local Binary Pattern (LBP) features. The training dataset was captured through 13 mega pixel mobile camera in different illumination and light conditions and due to randomness the data base complexity is very high. The robustness of the proposed system is measured on the bases its of capability of automatic detection and classification of ROI in a given video stream and backed with a comprehensive result analysis presented in this piece of work. Index Terms—Traffic Sign Detection, Local Binary Pattern (LBP), Video Tracking, Signage’s.
I. INTRODUCTION Traffic Road sign boards (signage’s) placed on road side plays an important role in guiding the driver to prohibit him from certain unusual actions and alert with road rules and regulations. These sign boards are predefined type of visual graphics that are created to display information to a audience. The objective of signage’s is to convey certain information, direction, and identification. In Indian road system, road signage’s mainly falls in three main categories as Mandatory signs /Regulatory Copyright © 2018 MECS
signs (for example one way sign, U-turn prohibited, speed limit etc.), Cautionary Signs/ warning/ precautionary (for example Right hand curve, narrow road ahead, pedestrian crossing etc.), and Informatory signs (for example Hospital, first-aid post, parking Lot cycle etc.). These signage’s are of designed using colors like red, blue, yellow, white and green in color with different geometrical shapes. The identification of signage’s can be seen/ done using two important criteria (i)color and (ii)shape[1][6]. These parameters provide significant data contents present in the tracked signage objects like red triangular/polygon/circle warning signage, blue information signage etc. In Machine learning, automated detection and classification of signage’s is a challenging as the data is in the form of video (time sampled image sequence) and has quite complex surrounding information. Further the surrounding information contained in video streams leads confusion to automated system and task of automatic isolation of region of interest (ROI) from video stream becomes more challenging and complex. Sometimes the changes in climate conditions may also contributes towards recording illuminations from object that gives disturbances in color information associated with object is observed and duly captured through acquisition device. In case of shadowed sign board, the complexities associated with identification of color, angle in which the video is captured and distance between data acquisition device and object are also contributing towards making automatic detection and classification complex and critical. Thus to overcome such problems different researchers adopted different methods and techniques, which includes improvising the autonomous vehicle assisting system and some systems were concentrated towards detection, recognition of signage’s. I.J. Image, Graphics and Signal Processing, 2018, 2, 52-59
Detection and Classification of Signage’s from Random Mobile Videos Using Local Binary Patterns
This piece of research work presents a method for detecting the red and blue signage object invariant to shapes and color. This research paper organized into V sections where Section I has provided scope of the work whereas Section II provides intensive review about related work in the domain, Section III provides detail about the methodology in designing the system, Section IV includes the experimental result and, finally, the Section V contains the conclusion.
II. RELATED WORK In light of the extensive literature review, the identification of traffic signage’s is widely categorized into two phases that is, detection and recognition. These two classes are primarily based on color and shape attributes. [1][2][5][6][8][9], provides mechanism of selection of method it was seen that the effective method is directly depend upon type of application. The most common method adopted in literature for ROI isolation that is for automatic detection of signboard is color histogram, and labeling were carried out using connected component method . Similarly, for recognition of the sign boards edge detection method and, pattern matching techniques were used. Karthiga.PL et al. [1] have proposed a system for detection of traffic sign board using RGB based color threshold and shape analysis, they have adopted HOG feature with KNN classifier and obtained 63% of accuracy. The authors concluded that the results are more competitive against non-uniform illumination, scale and rotation. Further it is mentioned that the response is not same for more than one red sign board. The system with three phases, like frame selection phase, Symbol detection phase, and Symbol Recognition phase is proposed by Vishal R. Deshmukh et al. [2]. Firstly the best possibly frame that consist of traffic signage is selected from overall frames, for detection of signage color image segmentation is being applied and finally the detected traffic signage has recognized using joint trance form correlation (JTC) technique. The experiment consists of 78 images with 43 traffic symbol signs. The results demonstrated that 40 traffic symbols were correctly classified. Authors presumed that the complexity increases for any low level languages. In [3] authors Md. Safaet Hossain et al. used Breadth First Search (BFS) for detection of ROI, and sobel method for detection of the edge. The experimental result yielded classification accuracy of 76.75% and 23.25% misclassification. The work is restricted only for red objects. Rabia Malik et al. [4] have proposed a system for detection and recognition of road signs using color segmentation and shape based detection techniques. In the work red objects and black regions are identified using color histogram and pictogram matching. The proposed system demonstrated accuracy rate of 86%. The
Copyright © 2018 MECS
53
authors stated that the shape detection phase fails for signs occluded enough with incomplete boundary of sign boards. In [5] authors Jack Greenhalgh et al. have worked on the automatic detection and recognition of traffic sign boards. The ROI extraction is done based on Maximally Stable Extremal Region (MSER). The authors have used synthetic template image database for the experimentation. The HOG features are computed and classified using SVM classifier, by obtaining the accuracy rate of 89.2%. Further it is proposed that the method is insensitive for different light conditions. Saturnino et al. [6] have developed a system for automatic road sign detection based on SVM classifier. The pixel based segmentation technique is used. Which is further classified using SVM classifier. The experimental outcome yielded 93.24% for small, 67.85% for medium and 44.90% large sized masks respectively. Authors presumed that the results are worst in the occlusion condition of images. In [7] authors R. Belaroussi et al have used three tested algorithms Contour Fitting, Radial Symmetry Transform, and pair-wise voting scheme for detection of road signage’s. These algorithms use color and edge information and are based on geometrical models of road signs. Their dataset consist of 847 images with 960 × 1080 of complex urban scenes with 251 road signs with different shapes like circular, rectangular, and triangular. Authors presumed that the results acquired by Contour Fitting, Single Pixel Voting are similar in term of maximum Correct Detection Rate with the associated False Positive Per Image (FPPI) are relatively similar for sizes ≥ 32, ≥ 48 and ≥ 64. In [8] authors Zhiyong Huang et al. have used three datasets GTSRB, BTSC and revised MASTIF for recognition of traffic siganag’s. The HOG features were computed and classified using Extreme Learning Machine (ELM) algorithm by obtaining the accuracy rate of 98% for their dataset. Authors stated that their results have little dependency for parameter tuning. It was seen from the above study that the different methods and techniques are available for detection and recognition of Traffic road signage’s over variety of different datasets there is strong need of robust mechanism for automatic detection and classification of signage’s. It was noticed that, two important characteristics were observed for detection and recognition of signage’s that are color and shape analysis. The color and shape analysis mechanism contribute heavily towards generating lots of information for identification and recognition of potential object from scene dataset. The results reported in literature are good, however still there is great need to deal with problem involved due to occlusions, color limitation, tuning of parameters, incomplete boundaries of sign boards etc. In this paper we use a basic method for identification of signage’s using RGB channel separation method and local binary pattern (LBP) for feature extraction of ROI’s.
I.J. Image, Graphics and Signal Processing, 2018, 2, 52-59
54
Detection and Classification of Signage’s from Random Mobile Videos Using Local Binary Patterns
III. METHODOLOGY The main objective of proposed system is to identify the ROI automatically from input video stream. The ROI considered in this piece of research work is mainly concentrated on the traffic signage’s presented in ‘RED’ and ‘BLUE’ color boards at alongside of road. The feature extraction was done for automatically detected signage’s ROI and classified ROI using KNN/SVM classifiers. The proposed system was trained on Local Binary Pattern (LBP) features of automatically detected ROI. The schematic diagram of proposed system is as shown in Fig 1.
captured video streams using color space conversion from RGB to GRAY. This color space conversion benefits towards minimizing complexity of object isolation. Further reduce noise median filter were applied due to its trusted wide use in noise reduction mechanism. Dataset: In order to meet the research requirement we create our own dataset of 30 video streams captured from a 13 mega pixel mobile camera collected in .mp4 format; each video stream is of 30 second duration of each video with sampling rate of 30fps, of frame size 320x240. Seven different classes were observed from all the videos collected samples, and tested the result with 140 observation and 59 predictors. The dataset of video streams is given in Table 1. Table 1. Dataset of signage’s Signage
Number Of samples
Left_turn(L)
20
Right_Turn(R)
20
Informative_sign(I)
20
Stop_sign(S)
20
T_sign(T)
20
Pedestrian_crossing(P)
20
Ghat_ahead(G)
20
B. Segmentation Fig.1. Schematic diagram of automatic signage detection & Classification.
A. Acquisition and Preprocessing This phase is sub-phase of preprocessing mechanism wherein video sample is acquired and recorded by using 13 mega pixel mobile camera mounted on bike’s head in a systematic manner using self-stick such that it starts capturing data without disturbing driver. This mechanism facilitates in acquiring real-time video stream of road signage’s so that the angle of capturing is equal to the driver driving the vehicle. The acquisition mechanism allows user to cope with real-time scenarios wherein there are variable change in backgrounds, angles and climate conditions. The authors have taken at most care in formation of dataset in real time which makes it challenging to the system to work upon. At the time of data acquisition the natural objects such as bike, buses, car, truck etc were also contained in the streams along with roadside signage’s. The volume of dataset collected are 30 videos captured out of which total 140 samples of Left_turn(L), Right_Turn(R), Informative_sign(I), Stop_sign(S), T_sign(T), Pedestrian_crossing(P) and Ghat_ahead(G) signs out of which 20 samples of each were considered for test purpose and rest were used for training purpose. To make the data suitable for automatic detection of ROI and classification it is necessary to pre-process
Copyright © 2018 MECS
Automatic Detection of ROI and its segmentation are the two important phases in Segmentation phase. It is challenging task for real time videos as they are captured in natural scenery with maximal complexity of background, angle, occluded ROI etc. In pre-processing phase the acquired sample was preprocessed with color space conversion, and channel separation method for each frame contained in the sample. The channel separation method was found effective for color still images in this case each frame of video stream was considered as still image where the method separates the frame into the 3 basic channels that is RED, GREEN and BLUE. The method finally extracts the contents of each channel, so that the channel with value 1 will be dominating than other color channel having zero value. For example in RED channels the object appears in RED color has more prominence then other, similarly for GREEN and BLUE channels hence cost of object isolation is minimized. The dominating color value in that particular instance of time object will be marked automatically, and segment that marked ROI (either red/blue) object using bounding box. Fig 2 represents the data flow of the proposed work. The ROI that are automatically identified in the stream are segmented automatically and saved in a database for further feature extraction process. Fig 3 shows the detected ROI using bounding boxes where the frame consists of red, blue sign boards.
I.J. Image, Graphics and Signal Processing, 2018, 2, 52-59
Detection and Classification of Signage’s from Random Mobile Videos Using Local Binary Patterns
55
(d). Video frame with Segmented ROI of Pedestrian_crossing.
(e). Video frame with Segmented ROI of T_sign. Fig.2. Data Flow
(f). Video frame with Segmented ROI of Ghat_ahead (a). Video frame with Segmented ROI of Left_turn
(g). Video frame with Segmented ROI of Right_Turn. (b). Video frame with Segmented ROI of Informative_sign.
Fig.3. Video and Images of different symbols: (a) to (g).
C. Feature Extraction
(c). Video frame with Segmented ROI of Stop_Sign.
Copyright © 2018 MECS
After automatic detection and segmentation of ROI it is necessary to extract the feature of ROI. The Local Binary Pattern (LBP) method is a visual descriptor and powerful feature representation of texture analysis for data under observation [9]. LBP is used in different kind of applications like Document image analysis, Computer vision, Medical image analysis, Biometric analysis and Texture analysis [10][11][14]. The selection of LBP method for dataset is due to the act of method towards handling rotation invariant, occlusion and generating more robust and distinct feature for classification. I.J. Image, Graphics and Signal Processing, 2018, 2, 52-59
56
Detection and Classification of Signage’s from Random Mobile Videos Using Local Binary Patterns
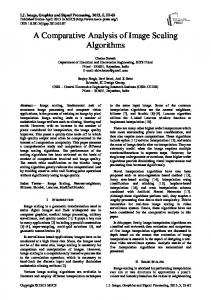
In LBP if the center pixel's value is greater than the neighbor’s pixel value mark it as 1 otherwise 0. The 8digit binary number is obtained that is further converted to decimal as shown in Fig 4, then to evaluate histogram over the cell of the frequency of all occurring value, which is used as feature vector and then normalize the histogram that forms a feature vector for the entire window [10] [11].
T t ( gc , g0 gc ,..., g p 1 gc )
(2)
Assuming the variances are independent of gc, where t(gc) defines the complete luminance of an image, that doesn’t related to local image texture, thus the Eq. (2) can be written as
T t ( g0 gc ,..., g p 1 gc )
(3)
Although invariant against gray scale shift the variances are affected by scaling, hence the signs of the dissimilar are measured to achieve invariance with respect to any monotonic transformation of gray scale. Thus T is given as Eq (4).
T ( s( g0 gc ),..., s( g p 1 gc ))
(4)
Where Fig.4. LBP features with 3X3 neighborhood pixel
s( x) 1 f ( x 0) , and s ( x) 0 f ( x 0)
For the different sizes of matrix LBP operator elongate the use of neighborhoods accordingly. The circle is made with radius R from center pixel on the edge of circle sampling points ‘P’ are equated with the center pixel value. To get sampling point values of the neighborhood for any radius with any number of pixels (bilinear) interpolations is required with (P, R) notation for neighborhood. For different values of P and R, three neighbor sets are given in Fig 5.
Now a binomial weight 2p is allocated to each sign s (gp-gc), to produce LBP code as P 1
LBPP , R s ( g p g c )2 P
(5)
P 0
The outcome of segmented image is given in the Fig 6(a), and the corresponding LBP histogram in Fig 6(b).
Fig.6(a). Segmented image
Fig.5. An example for extended Local Binary Pattern operator with circular neighborhood of (8,1), (16,2), and (8,2).
By defining texture T as the joint distribution of the gray scale of P+1(p>0) image pixels, T is defined as Eq. (1).
T t ( gc , g0 ,..., g p 1 )
(1)
Where gc denotes the gray value of the center pixel of local neighborhood, gp (p=0,…p-1) signify the gray value of equally placed pixel P, on circle radius R where R>0. To get the values with no loss of information, gc is subtracted from gp representing joint distribution values of center pixel. Copyright © 2018 MECS
Fig 6(b). LBP Histogram
D. Classification KNN is one of the modest and straightforward memory based model that accumulates the entire known instance and classifies new outcome instance based on a similarity measures. The training phase is pretty fast in KNN I.J. Image, Graphics and Signal Processing, 2018, 2, 52-59
Detection and Classification of Signage’s from Random Mobile Videos Using Local Binary Patterns
algorithm that does not make any hypothesis based on primitive data propagation [15]. The algorithm equates the class label to a test pattern of its closest neighbor. For n training patterns (x1 , ϴ), (x2 , ϴ),.. (xn ,ϴ) , where xi is the dimension and ϴi is the class label of ith pattern then
The Table 2 elaborates the results obtained by KNN classification with count of correct classification (CC), Miss Classification (MC). The total segmented images are 140 out of which 124 are correctly classified and 14 were misclassified. Table 2. Confusion matrix for KNN
(6)
where i=1..n , pattern p is given to the class ϴk associated with xk . For different k values algorithm have different behavior [15]. Further in this work, SVM classifier with linear kernel is used to check the efficiency of results. SVM is a supervised learning method that constructs a hyper-plane to separate data into classes. The “Support Vectors” are data points that define the maximum margin of hyperplane. SVM is fruitful with number of dimensions greater than the number of samples and with good memory efficiency [5][13]. SVM is basicaly designed to perform binary classification. For multiple classes SVM is constructed using K-problems like one-against-one, one-against-all, the time compexsity of both approach is same, where the evaluation of K class changes for one-againstone(requires K-1 SVM), and for one-against-all(requires K SVM) [12][16]. In our expirement we use one-againsall method with liner SVM classifiction. The results are discussed in the following section IV.
IV. RESULTS The experimentation is conducted by applying LBP method on two basic classifiers KNN and SVM by varying scale values. As a outcome we observed that KNN classifier Outperformed with 89% accuracy with simple liner kernel and for SVM classifier accuracy rate of 90% is obtained. The proposed algorithm is given below. Algorithm: Input: Video Stream. Output: Extraction of ROI (Signage’s). Step 1: Video acquisition and frame extraction. Step 2: Pre-processing that includes noise removal using median filter and gray scale conversion. Step 3: Identification of ROI by RGB color channel separation and segmentation using bounding box. Step 4: Computation of LBP from segmented objects. Step 5: classification using KNN and SVM classifiers. Step 6: End. The classification results are represented in Table 2 and Table 3.
Class Label L
TS
L
R
I
S
T
G
P
CC
MC
A
20
17
1
0
0
2
0
0
17
3
85
R
20
1
17
1
1
0
0
0
17
3
85
I
20
0
0
19
1
0
0
0
19
1
95
S
20
0
0
0
19
1
0
0
19
1
95
T
20
0
0
0
0
19
1
0
19
1
95
G
20
0
1
0
0
0
18
1
18
2
90
P
20
2
0
0
0
0
3
15
15
5
75
Total
140
124
16
89
Table 3. Confusion matrix for SVM Class Label L
TS
L
R
I
S
T
G
P
CC
MC
A
20
18
1
0
0
1
0
0
18
2
90
R
20
2
16
1
1
0
0
0
16
4
80
I
20
0
1
18
1
0
0
0
18
2
90
S
20
0
0
0
19
1
0
0
19
1
95
T
20
0
0
0
1
18
1
0
18
2
90
G
20
0
0
0
0
1
18
1
18
2
90
P
20
0
0
0
0
0
0
19
19
1
95
Total
140
126
14
90
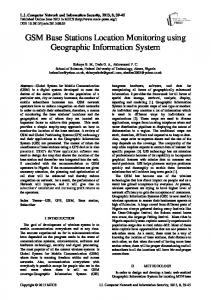
The Table 3 elaborates the results obtained by SVM classification with count of correct classification (CC), Miss Classification (MC). The total segmented images are 140 out of which 126 are correctly classified and 16 were misclassified. The chart in Fig 7 shows the performance of KNN ans SVM by representing the classification rates of each class from left_turn (L) to pedestrian_crosssing (p) , each of which have 20 samples, the figure illustrates the correctly classified and misclassified signage’s in KNN and SVM classifiers. 100 Performance Ratio
d p, xk min d p, xi
57
80 60 40 20 0
1
2
3
4
5
6
7
KNN
85
85
95
95
95
90
75
SVM
90
80
90
95
90
90
95
Fig.7. Performances of KNN and SVM classifiers
Copyright © 2018 MECS
I.J. Image, Graphics and Signal Processing, 2018, 2, 52-59
58
Detection and Classification of Signage’s from Random Mobile Videos Using Local Binary Patterns
V. CONCLUSION In this piece of research work the challenge of automatic detection of signage’s using the method of color space based segmentation, feature extraction and its classification were handled successfully for the dataset captured from mobile device. The Local Binary Pattern features have been computed normalized and classified using two classifiers KNN and SVM. It was observed that KNN classifier demonstrated with accuracy rate of 89% whereas SVM classifier resulted in 90% accuracy over same dataset. In future the work will be extended for the detection green and yellow signage’s along with recognition of the signage’s. REFERENCES [1]
Karthiga P. L, S. Md. MansoorRoomi, Kowsalya.J, “Traffic-Sign Recognition For An Intelligent Vehicle/Driver Assistant System Using Hog”, Computer Science & Engineering: An International Journal (CSEIJ), vol.6, No.1, pp: 16-23, February 2016. [2] Vishal R. Deshmukh, G. K. Patnaik, M. E. Patil, “RealTime Traffic Sign Recognition System based on Colour Image Segmentation”, International Journal of Computer Applications (0975 – 8887) Vol.83, No3, pp: 30-35, December 2013 [3] Md. Safaet Hossain, Zakir Hyder, “Traffic Road Sign Detection and Recognition for Automotive Vehicles”, International Journal of Computer Applications (0975 – 8887) Vol.120, No.24, pp: 11-15, June 2015. [4] Rabia Malik, Javaid Khurshid, Sana Nazir Ahmad, “Road Sign Detection And Recognition Using Colour Segmentation, Shape Analysis and Template Matching”, Proceedings of the Sixth International Conference on Machine Learning and Cybernetics, Hong Kong, pp:35563560, 19-22 August 2007. [5] Jack Greenhalgh and MajidMirmehdi, “Real-Time Detection and Recognition of Road Traffic Signs”, IEEE Transactions on Intelligent Transportation Systems, Vol.13, No.4, pp:1498-1506, December 2012. [6] Saturnino Maldonado-Bascón, Sergio Lafuente-Arroyo , Pedro Gil-Jiménez,Hilario Gómez-Moreno, Francisco Lopez-Ferreras, “Road-Sign Detection and Recognition Based on Support Vector Machines”, IEEE Transactions On Intelligent Transportation Systems, Vol.8, No.2, pp: 264-278, June 2007. [7] R. Belaroussi, P. Foucher , J.-P. Tarel, B. Soheilian , P. Charbonnier , N. Paparoditis, “Road Sign Detection in Images: A Case Study”. 20th International Conference on Pattern Recognition (ICPR), pp: 484-488, 07 October 2010. [8] Zhiyong Huang, Yuanlong Yu, Jason Gu, and Huaping Liu, “An Efficient Method for Traffic Sign Recognition Based on Extreme Learning Machine”, IEEE Transactions On Cybernetics, Vol.47, Issue.4, pp: 920-933, April 2017. [9] Ojala, T., Pietikainen, M. and Maenpaa, T. (2002), Multiresolution Gray-scale and Rotation Invariant Texture Classification with Local Binary Patterns. IEEE Trans. Pattern Analysis and Machine Intelligence 24(7): 971-987. [10] M. Srinivasa Rao, V.Vijaya Kumar, Mhm Krishna Prasad, “Texture Classification based on First order Local Ternary Direction pattern”, International Journal of Image, Graphics and Signal Processsing, 2017, 2, pp:46-54.
Copyright © 2018 MECS
[11] K. Srinivasa Reddy, V.Vijaya Kumar, B. Eswara Reddy, “Face Recognition Based on Texture Features using Local Ternary Patterns”, International Journal of Image, Graphics and Signal Processsing, 2015, 10, pp:37-46. [12] Alireza Tofighi, Nima Khairdoost, S. Amirhassan Monadjemi, Kamal Jamshidi, “A Robust Face Recognition Sysytem in Image and Viddeo ”, International Journal of Image, Graphics and Signal Processsing, 2014, 8, pp:1-11. [13] Dolly Choudhary, Ajay Kumar Singh, Shamik Tiwari, “a Statistical Approach for Iris Recognition Using K-NN Classifier”, International Journal of Image, Graphics and Signal Processsing, 2013, 4, pp:46-52. [14] S.S. Gornale, Basavanna M, Kruti R, “Fingerprint Based Gender Classification Using Local Binary Pattern”, International Journal of Computational Intelligence Research, ISSN 0973-1873 Vol.13, No 2(2017), pp:261271, @Research Indian Publication. [15] S.S.Gornale, Pooja U. Patravali, “Medical Imaging in Clinical Applications: Algorithmic and Computer based approaches”, Basic Chapter, “Engineering and Technology: Latest Progress”, pp: 65-104, ISBN 978-81932850-2-2, 2017. [16] Shivanand.S.Gornale, Pooja U. Patravali, Kiran S. Marathe, Prakash S. Hiremath, “Determination of Osteoarthritis using Histogram of Oriented Gradients and Multiclass SVM”, International Journal of Image, Graphics and Signal Processsing, Vol.9, No.12, pp.41-49, 2017, DOI:10.5815/ijigsp.2017.12.05.
Authors’ Profiles Prof. Shivanand S. Gornale has completed M. Sc. in Computer Science. M.Phil. in Computer Science, Ph.D. in Computer Science from University of Pune, Maharashtra, India. He is recognized research guide for PhD in Computer Science and Engineering from Rani Channamma University, Belagavi and Jain University Bangalore. He has published more than 75 research papers in various National and Inter-national Journals and conferences. He is a Fellow of IETE New Delhi, Life Member of CSI, Life Member of IPRA, Member of IARCS, Life Member of Indian Science Congress Association, Kolkata-India. Presently he is working as Professor and Chairman, Department of Computer Science, Rani Channamma University, Belagavi – Karnataka, India. His research area of interest is Digital Image Processing, Pattern Recognition, Computer Vision and Machine Learning, Video Retrieval and Biometric analysis.
Ashvini K. Babaleshwar completed M.Sc in Computer Science from Rani Channamma University, Belagavi, Karnataka, India in 2013. She is pursuing Ph.D in Computer Science at Rani Channamma University, Belagavi, Karnataka, India. Her area of research includes Image Processing and Pattern recognition, Content based Image and Video retrieval.
I.J. Image, Graphics and Signal Processing, 2018, 2, 52-59
Detection and Classification of Signage’s from Random Mobile Videos Using Local Binary Patterns
Pravin L. Yannawar is Assistant Professor in Department of Computer Science and Information Technology, Dr. Babasaheb Ambedkar Marathwada University, Aurangabad (MS). He has completed M. Sc. (2001), SET(Computer Science & application) Ph. D (2011). He is Member of IETE & life member of IAEng, CSTA, IUPRAI and IACSIT. He is recipient of DST Fast Track
59
Young Scientist research project. His area of research includes Vision, Intelligent Systems, AVSR, OCR, Image Processing and pattern recognition.
How to cite this paper: Shivanand S Gornale, Ashvini K Babaleshwar, Pravin L Yannawar," Detection and Classification of Signage’s from Random Mobile Videos Using Local Binary Patterns", International Journal of Image, Graphics and Signal Processing(IJIGSP), Vol.10, No.2, pp. 52-59, 2018.DOI: 10.5815/ijigsp.2018.02.06
Copyright © 2018 MECS
I.J. Image, Graphics and Signal Processing, 2018, 2, 52-59