I.J. Intelligent Systems and Applications, 2013, 09, 10-18 Published Online August 2013 in MECS (http://www.mecs-press.org/) DOI: 10.5815/ijisa.2013.09.02
Reducing Support Vector Machine Classification Error by Implementing Kalman Filter Muhsin Hassan, Dino Isa, Rajprasad Rajkumar, Nik Ahmad Akram, Roselina Arelhi Department of Electrical and Electronic Engineering, Faculty of Engineering, University of Nottingham, Malaysia Campus, Jalan Broga, 43500, Semenyih, Selangor E-mail:
[email protected] Abstract— The aim of this is to demonstrate the capability of Kalman Filter to reduce Support Vector Machine classification errors in classifying pipeline corrosion depth. In pipeline defect classification, it is important to increase the accuracy of the SVM classification so that one can avoid misclassification which can lead to greater problems in monitoring pipeline defect and prediction of pipeline leakage. In this paper, it is found that noisy data can greatly affect the performance of SVM. Hence, Kalman Filter + SVM hybrid technique has been proposed as a solution to reduce SVM classification errors. The datasets has been added with Additive White Gaussian Noise in several stages to study the effect of noise on SVM classification accuracy. Three techniques have been studied in this experiment, namely SVM, hybrid of Discrete Wavelet Transform + SVM and hybrid of Kalman Filter + SVM. Experiment results have been compared to find the most promising techniques among them. MATLAB simulations show Kalman Filter and Support Vector Machine combination in a single system produced higher accuracy compared to the other two techniques.
Index Terms— Discrete Wavelet Transform (DWT), Support Vector Machine (SVM), Kalman Filter (KF), Defect classification
I.
Introduction
Support Vector Machine is a popular method used for classification and regression in modern days [1]. SVM gains popularity as an alternative for Artificial Neural Networks due to its superior performance [1]. This improvement is due to structural risk minimization used in SVM. Structural Risk Minimization is proven better generalization ability compared to ANN‘s empirical risk minimization technique [1]. Application of SVM in pipeline fault diagnosis shows a promising future [2]. For instance, one can teach SVM to classify type of defect in given situation. This will help with monitoring and classification of what type of defect happen in the time of experiment. In a previous experiment, different type of defects with varying Copyright © 2013 MECS
depths simulated in the laboratory has been classified using SVM. Datasets used in this experiment have been added with Additive White Gaussian Noise to study the performance of hybrid technique for SVM, namely Kalman Filter + SVM hybrid combination [3]. In practical scenario, datasets obtained from the field are susceptible to noise from an uncontrollable environment. This noise can greatly degrade the accuracy of SVM classification. To maintain the high level of SVM classification accuracy, a hybrid combination of KF and SVM has been proposed to counter this problem. Kalman Filter will be used as a pre-processing technique to de-noise the datasets which are then classified using SVM. A popular de-noising technique used with Support Vector Machine to filter out noise, the Discrete Wavelet Transform (DWT) is included in this study as a benchmark for comparison to the KF+SVM technique. Discrete Wavelet Transform is widely used as SVM noise filtering technique [4][5]. DWT has become a tool of choice due to its time-space frequency analysis which is particularly useful for pattern recognition [6]. In this paper, KF+SVM combination shows promising results in improving SVM accuracy. Even though Kalman Filter is not widely used for de-noising in SVM compared to DWT, it has the potential to perform as a de-noising technique for SVM. In previous experiment, each technique tested has been fed with each separate added noise datasets respectively. However in this paper, the performances of these three techniques (SVM vs. DWT+SVM vs. KF+SVM) with the same noisy datasets input will be tested and compared in Results and Discussion section. A more detailed difference of previous paper and this paper workflow is available at Methodology section.
II. Background 2.1 Pipeline Corrosion is a major problem in offshore oil and gas pipelines and can result in catastrophic pollution and wastage of raw material [7]. Frequent leaks of gas and oil due to ruptured pipes around the world are calling for the need for better and more efficient methods of monitoring pipelines [8]. Currently, pipeline inspection is done at predetermined intervals using techniques such I.J. Intelligent Systems and Applications, 2013, 09, 10-18
Reducing Support Vector Machine Classification Error by Implementing Kalman Filter
11
as pigging [9]. Other non-destructive testing techniques are also done at predetermined intervals where operators must be physically present to perform measurements and make judgments on the integrity of the pipes. The condition of the pipe between these testing periods, which can be for several months, can go unmonitored. The use of a continuous monitoring system is needed.
dimensions. The SVM formulation uses the Structural Risk Minimization (SRM) principle, which has been shown to be superior, to traditional Empirical Risk Minimization (ERM) principle, used by conventional neural networks. SRM minimizes an upper bound on the expected risk, while ERM minimizes the error on the training data. It is this difference which equips SVM with a greater ability to generalize [18].
Non Destructive testing (NDT) techniques using ultrasonic sensors are ideal for monitoring pipelines as it doesn‘t interrupt media flow and can give precise information on the condition of the pipe wall. Long range ultrasonic testing (LRUT) utilizes guided waves to inspect long distances from a single location [10]. LRUT was specifically designed for inspection of corrosion under insulation (CUI) and has many advantages over other NDT techniques which have seen its widespread use in many other applications [11]. It is also able to detect both internal and external corrosion which makes it a more efficient and cost-saving alternative. With the recent developments in permanent mounting system using a special compound, the ability to perform a continuous monitoring system has now become a reality [12].
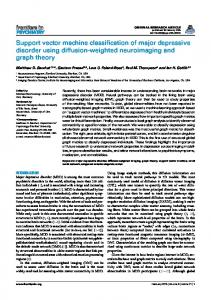
Given a set of independent and identically distributed (iid) training samples, S={(x1, y1), (x2, y2),…..(xn,yn)}, where xi RN and yi {-1, 1} denotes the input and the output of the classification, SVM functions by creating a hyperplane that separates the dataset into two classes. According to the SRM principle, there will just be one optimal hyperplane, which has the maximum distance (called maximum margin) to the closest data points of each class as shown in Fig. 1. These points, closest to the optimal hyperplane, are called Support Vectors (SV). The hyperplane is defined by (1),
An LRUT system was develop in the laboratory for 6 inch diameter pipes using a ring of 8 piezo-electric transducers [13]. Signals were acquired from the pipe using a high speed data acquisitions system. The developed LRUT system was tested out using a section of a carbon steel pipe which is 140mm in diameter and 5mm thick. A 1.5m pipe section was cut out and various defects were simulated as shown in Table 1. A full circumferential defect with 3mm axial length was created using a lathe machine. Depths of 1mm, 2mm, 3mm and 4mm were created for this defect and at each stage tested using the LRUT system.
(1) and therefore the maximal margin can be found by minimizing (2) [18]. ‖ ‖
(2)
2.2 Support Vector Machine Guided wave signals have been used for many researchers by utilizing different signal processing techniques as a means of identifying different types and depths of defects. Advanced signal processing techniques such as neural networks have also been used to quantify and classify defects from the guided wave signals [14] [15]. Since neural networks are a supervised learning algorithm, the data required for its training phase from are obtained from simulation methods. Simulation is performed by modeling the damage based on reflection coefficients or finite elements [16]. The trained neural network model is then tested from data obtained experimentally and have shown to obtain very good accuracy in classifying defects in pipes, bars and plates [17]. Support vector machines, founded by V. Vapnik, is increasingly being used for classification problems due to its promising empirical performance and excellent generalization ability for small sample sizes with high Copyright © 2013 MECS
Fig. 1: Optimal Hyperplane and maximum margin for a two class data [19]
The Optimal Separating Hyperplane can thus be found by minimizing (2) under the constraint (3) that the training data is correctly separated [20]. (
)
(3)
The concept of the Optimal Separating Hyperplane can be generalized for the non-separable case by introducing a cost for violating the separation constraints (3). This can be done by introducing positive slack variables i in constraints (3), which then becomes, (
)
(4)
I.J. Intelligent Systems and Applications, 2013, 09, 10-18
12
Reducing Support Vector Machine Classification Error by Implementing Kalman Filter
unity, so i i is an upper bound for the number of classification errors. Hence a logical way to assign an extra cost for errors is to change the objective function (2) to be minimized into: * ‖ ‖
(∑
)+
(5)
where C is a chosen parameter. A larger C corresponds to assigning a higher penalty to classification errors. Minimizing (5) under constraint (4) gives the Generalized Optimal Separating Hyperplane. This is a Quadratic Programming (QP) problem which can be solved here using the method of Lagrange multipliers [21]. After performing the required calculations [18, 20], the QP problem can be solved by finding the LaGrange multipliers, αi, that maximizes the objective function in (6), n
W ( ) i i 1
1 n i j yi y j x iT x j 2 i , j 1
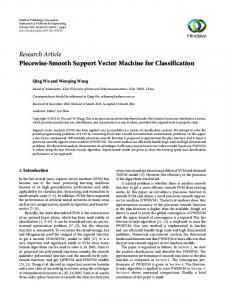
Fig. 2: Mapping onto higher dimensional feature space
By introducing the kernel function,
K xi , x j xi , x j ,
It is not necessary to explicitly know Ф ( ). So that the optimization problem (6) can be translated directly to the more general kernel version [23], n
(6)
(9)
W ( ) i i 1
1 n i j yi y j K xi , x j (10) 2 i 1, j 1
subject to the constraints,
0i C,
and
i 1i yi 0. n
subject to C i 0, (7)
n
y i 1
i
i
0.
After the αi variables are calculated, the equation of the hyperplane, d(x) is determined by,
The new objective function is in terms of the Lagrange multipliers, αi only. It is known as the dual problem: if we know w, we know all αi. if we know all αi, we know w. Many of the αi are zero and so w is a linear combination of a small number of data points. xi with non-zero αi are called the support vectors [22]. The decision boundary is determined only by the SV. Let tj (j=1, ..., s) be the indices of the s support vectors. We can write,
l
d ( x) y i i K( x , x i ) b
(11)
i 1
The equation for the indicator function, used to classify test data (from sensors) is given below where the new data z is classified as class 1 if i>0, and as class 2 if i