ISPRS Annals of the Photogrammetry, Remote Sensing and Spatial Information Sciences, Volume II-2/W2, 2015 Joint International Geoinformation Conference 2015, 28–30 October 2015, Kuala Lumpur, Malaysia
DETECTION AND MONITORING OF GLOBAL CHANGES AND THE EVOLUTION IN THE REGION OF BOUZINA (AURES) USING REMOTE SENSING DATA M. Mekaoussia a
H. Benmessaoudb
Department of Natural Sciences and the Faculty of Life-El Hadj Lakhdar -University -BatnaEmail:
[email protected], Tel: 07 79 91 90 07 b Laboratory LRNAT -Faculté des sciences -Université El Hadj Lakhdar –Batna- Algérie Email :
[email protected] Tél.: 00213 0668292940 Commission VI, WG VI/4
KEY WORDS: Global Changes; Monitoring developments; Remote sensing, Aurès. ABSTRACT: The functioning of Mediterranean ecosystems to daily or interannual scale presents an ecological and socio-economic interest. The intensive exploitation of natural resources of this ecosystem by the population has now reached a critical threshold. To this is added the effect of climate change leading to a drought that occurs mainly in the southern part. This leads to accelerated degradation of the ecosystem and requires the establishment of sustainable management rules.
The objective of this study is to determine
the contribution of multi-date satellite images in detecting global changes and monitoring of developments in the watershed of the Aurès Bouzina center. The approach is to use satellite images Landsat at different times (1986, 2001 and 2013) and sampling work for the confrontation with the ground truth, to conduct a thematic analysis of this environment, and view the global changes that have occurred in this area. The overall reading of the results of the tracking map changes, we notice a degradation of forest cover in ascending gradient from north to south and led to the reduction of vegetation cover drills. The area of irrigated crops registered an increase of grain. In favor of bare soils and wetlands, related to the influence of rivers, as well as the emergence of forage and vegetable crops. Bare soils dominated by a sandy texture are located primarily near areas of crops due to agricultural practices based on the intensification of agriculture as well as silting soil justified by an increase in bare soil. This work is a first step to track the degradation or restoration through ecological indicators field, related to remote sensing data.
1.1 Introduction With satellites it is indeed possible to map the vegetation cover Ecosystem functioning in daily or interannual scale has a very strong
scientific
interest.
The
challenge
is
a
better
understanding of the processes and factors that promote these exchanges (WALKER & STEFFEN, 1996), and also improve the coverage of terrestrial surfaces (Randall et al. 1996). The long-term evolution of ecosystems is also an important issue, particularly because of climate change and human pressure (WALKER & STEFFEN, 1996). It is then necessary to study the composition and structure of ecosystems characterized by parameters such as the density of vegetation cover (REDJAL. 2005). Remote sensing is proving to be a very
in the time scales and varied space (CALOZ & Puech, 1996). Change detection and subsequent land use evolution done by the comparison of multi-date images and surfaces calculated for each pixel between several scenes taken on different dates, the issues of classification maps closely match Field observations. Our job is to study the spatial and temporal evolution of land use in the basin of Bouzina, using satellite images multidate for: - Know the composition and structure of this ecosystem (qualitative study); -Calculate the surfaces of each unit of land use on different dates 1986.2000 and 2013 (quantitative study);
appropriate tool to study the function and monitor vegetation.
This contribution has been peer-reviewed. The double-blind peer-review was conducted on the basis of the full paper. doi:10.5194/isprsannals-II-2-W2-35-2015
35
ISPRS Annals of the Photogrammetry, Remote Sensing and Spatial Information Sciences, Volume II-2/W2, 2015 Joint International Geoinformation Conference 2015, 28–30 October 2015, Kuala Lumpur, Malaysia
- Know the land cover units and their evolution, and detect
threatens ominously Bouzina of vegetation cover and also, The
spatial and temporal changes in each land use unit.
area is known particularly by arboriculture (apple, apricot) and cultivation of cereals being extended at nerdi.
1.2 Background information
Bouzina The region is subject to a climate of the Mediterranean
Bouzina The valley is located in the Aures mountains of
type, it generally has two climate regimes: subhumid climate
central and located 85 km south of the town of Batna, 25 km
with very cold winters for high altitudes and semi arid climate
north of Arris and 60 km north-east of Biskra, occupies about
with cold winters for lower altitudes.
197.4 km² in area, This basin is between the map coordinates X:
Precipitation (299,75mm) on average in the low altitudes and in
06,00 ° - 06,30 ° and Y: 35,18 ° - 35,35 °.
high altitudes (676,91mm). The temperatures, a large thermal gap between deferent extreme altitudes marked according to the minimum (m = -8.21) and maximum (M = 36.80).
1.3 Working methodology The methodology adopted for this work is carried out using remote sensing tools: satellite images from different dates and a GPS in order to make land use map and the changes detected between these dates. The images used are scenes of Landsat, type (TM) and (ETM +) three dates Landsat satellite images are used in our study: 1986 2000 et2013, image processing performed by the ENVI 4.7 software, and the software Arc GIS 9.3, and GPS for positioning on the field sampling points. Fig.1: Location map of the study area
The proposed scientific approach involves the development of a
The Aures Mountains constitute the eastern part of the Atlasic
methodology for monitoring degradation using remote sensing
chain. It is characterized by clay deposits carbonated Jurassic
data. To quantify the evolution of vegetation in the study area,
and Cretaceous. On The geomorphologic aspect of Bouzina
GIS was used to calculate changes and changes in land use over
Valley is one of the highlands of the Atlas Algerians. This is
a period since 1987. In this context, this study quantitatively
usually a pronounced V shape, narrow and deep, catchment
evaluated these changes land use in the municipality of
raids and deeply furrowed. The valley develops over a width of
Bouzina.
about
A sampling fieldwork was conducted during the months of May
7 km between the peaks, and is drained by a river system
and June 2013 with a frequency of six outputs total, and 108
consists of two parts separated by Koudiat El Arar.
sampling points with a GPS. All data used for image
The Bouzina Valley is drained by a river system consists of two
classification and for the final restoration of a sampling
separate branches: the South Oued and Nerdi Oued Bouzina the
georeferenced map with all the information together in their
north, and several emerging sources in the basin of Oued
chart.
Bouzina. These sources can be classified into two groups: The sources of Tabgha sources Nerdi and other sources. Throughout the watershed Bouzina, there is a holm oak and juniper plant association (Quercus ilex, Juniperu sphonicea, Junipeus oxycedrus) covering the tops; Downstream there is a herbaceous
vegetation
consists
mainly
of
Alfa
(Stipa
tenacissima). And in the part facing south located in the steppe to sagebrush, Artemisia herba alba, and Artemisia compestris. Bouzina commune is an agro-pastoral vacation area because of its natural resources, farming is conducted in extensive and Fig.2: Map of the sampling point This contribution has been peer-reviewed. The double-blind peer-review was conducted on the basis of the full paper. doi:10.5194/isprsannals-II-2-W2-35-2015
36
ISPRS Annals of the Photogrammetry, Remote Sensing and Spatial Information Sciences, Volume II-2/W2, 2015 Joint International Geoinformation Conference 2015, 28–30 October 2015, Kuala Lumpur, Malaysia
We realized after a supervised classification by the method of Maximin likelihood (BENMASSOUD, 2009), three maps of land use, using three scenes different dates covering the study area. This card provides an inventory of the types of land use (plant cover, land cultivated and bare ground). Change detection is the process of identifying the differentiation of an object or phenomenon by observing on different dates .We used the results of land uses charts and maps changes to identify changes cultures and natural environments, in time and space by performing evolution cards with tracking changes plots for each class over time. The analysis is based on three cards of occupations of land to
Fig.3: land use map (1986)
study the recent spatial change of vegetation in the basin over the past three decades these cards covering the entire basin and Bouzina treated with ENVI 4.7 software, the methodological procedure is based on the analysis of maps, treatments and analyzes made to these images, we were able to study and explain the spatial and temporal evolution of the vegetation cover in the basin, to get a map of evolution. This card is owned forest and steppe zones degraded or disappeared, stable areas and areas in regeneration unit percentage or ha. 1.4. Results and interpretation Data analysis of land cover maps between 1986.2000 and 2013, shows the evolution of each unit in time and in space, and gives large landscape changes each unit of space.
Fig.4: land use map (2000)
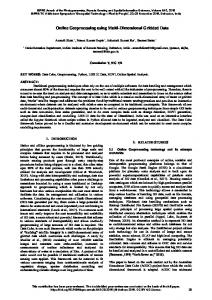
4.1- The soil occupations cards: After a supervised classification of satellite images were obtained for 11 classes out of the land use maps available for each date with the occupied areas of each class.
Fig.5: land use map (2013).
This contribution has been peer-reviewed. The double-blind peer-review was conducted on the basis of the full paper. doi:10.5194/isprsannals-II-2-W2-35-2015
37
ISPRS Annals of the Photogrammetry, Remote Sensing and Spatial Information Sciences, Volume II-2/W2, 2015 Joint International Geoinformation Conference 2015, 28–30 October 2015, Kuala Lumpur, Malaysia
The result of the image classification which covers the Bouzina area (1986, 2000, 2013) is shown in figure (4, 5, 6), the evaluation of the supervised classification by maximum likelihood is the results of the analysis of the matrix of confusion and the accuracy of the classification of the area show a good classification, watching figure illustrates the land use surfaces in different times and areas in each date. 4.2- detection of changes and changes in space: In this part a diachronic mapping of land cover units, to better understand the evolution of the occupation of the countryside and cultivated in the area Bouzina of the spatial and temporal organization of the areas is analyzed by using three different cards obtained. For each of the dates, an image defining spaces was performed.
Fig.7: Quantification of changes between 1986 and 2000.
Their superposition allowed highlighting and assessing the extension of land cover units between 1986, 2000 and 2013, in
• An extension of the steppe areas in sagebrush (996,84
the form of explanatory maps and graphs of evolution.
hectares) of scrub steppes of alfa (875.52 ha), open land (80.37 ha), cereals (1075.59 ha), forest clear (1037.34ha), urban (38.79 ha) and tree (139.41 ha); • A decrease in the following subject’s areas: Garrigue Juniperus oxycedrus and Juniperus phonicea by an area of 91.71 ha of Juniperus oxycedrus Garrigue and holm a strong value 1042.47, and also the steppe to Artemisia compestris 2,405.52 ha and in the end urban by reducing 704.16 ha.
Fig.6: Evolution of land use units between 1986-2000-2013
- Changes between 1986 and 2000: Changes in land use between 1986 and 2000 for the 11 land-use units are highlighted in the table (Table 1) presented by a graph that compares the units together with two dates 1986 and 2000, to 14 years apart.
Fig.8: Map of changes between 1986-2000 - Changes between 2000 and 2013: Changes in land use between 2000 and 2013 were held in accuracy in the table, the graph compares these units.
This contribution has been peer-reviewed. The double-blind peer-review was conducted on the basis of the full paper. doi:10.5194/isprsannals-II-2-W2-35-2015
38
ISPRS Annals of the Photogrammetry, Remote Sensing and Spatial Information Sciences, Volume II-2/W2, 2015 Joint International Geoinformation Conference 2015, 28–30 October 2015, Kuala Lumpur, Malaysia
- The scrub has a high regression and degrades towards sagebrush steppes which are formations of degraded land, because of the pasture that leaving empty and that prevents the accroissance plants; - Demographic pressure is the direct cause of the progression of the steppe area in the loss of scrublands, this increase in steppe space is always accompanied by a search cultivable land and caused mainly by overexploitation of natural environments; - Arboriculture and cereals: an increase in agricultural production at the expense of natural areas and the abandonment of these areas operated causes denudation of vegetation blankets to
-
Fig.09: Quantification of changes between 2000-2013
bare
land
and
also
causes
of
land
degradation;
Urbanization: Urbanization related to the development of
• An extension of the steppe areas in sagebrush (3595.23 ha),
economic activities such as tourism what it was observed. And
scrubland
phonicea
one of PPDRI program implications for the development of
(1533.87 ha), open land (205.56 ha) of Artemisia steppes
rural areas, with a lack of development program of the
compestris
ha).
extension of the urban, the increase destroyed the green areas of
• A decrease in the areas of scrub alfa steppes of 96.3 ha lost,
scrubland and steppes with a random extension town planning;
and 1441.53 ha of scrub of Juniperus oxycedrus and green oak,
- The bare land: the problem of water erosion and land erosion
843.84 ha of cereals, 1934.91 ha of woodland, 1158, 03 ha of
to the river Bouzina funds and depletion of land by agricultural
dense forests, and reduction of area of 61.38 ha of tree crop
use exacerbated degradation of natural land.
Juniperus
(69.39
oxycedrus
ha)
and
and
Juniperus
urban
(131.94
1.6. Conclusion Land use changes result from a complex interaction of social and environmental systems systems that evolve over time. The practices of the actors and their changes play a primary role on changes in land use, and consequently on environmental systems. The study of the dynamics of natural ecosystems in contact with cultivated areas included in the Basin Bouzina taken to determine the way in which the media are temporal and spatially changed during the last decades The area of the different areas showed a link predominance of production.
agricultural and rangeland to bare land, the agricultural vocation is confirmed and land use provides an overview of land use.
Fig.10: Map of changes between 2000-2013 REFERENCES Discussion A general view of the three land use map shows a wide variation in area and from the number of detected changes in the results, one can say for each floor occupied unit as: - Long periods of drought (semi arid) are accentuated degradation
dense
forests
to
clear
the
forests;
Benmassoud H. (2009) : étude de la vulnérabilité à la désertification par des méthodes quantitatives numériques dans le massif des Aurès (Algérie), thèse de doctorat en sciences en aménagement du territoire, université de Batna, p : 117. Bensaid A. (1997) : Traitement des données multi sources et conception d’une base des données dans un SIG en vue de la
This contribution has been peer-reviewed. The double-blind peer-review was conducted on the basis of the full paper. doi:10.5194/isprsannals-II-2-W2-35-2015
39
ISPRS Annals of the Photogrammetry, Remote Sensing and Spatial Information Sciences, Volume II-2/W2, 2015 Joint International Geoinformation Conference 2015, 28–30 October 2015, Kuala Lumpur, Malaysia
caractérisation d’un milieu physique : application à une zone steppique au Nord de Laghouat. Thèse de Magister, 122 pages, CNTS, Arziew- Algérie. Caloz, R. Et Puech, C. (1996) : Hydrologie et imagerie satellitaire. In Précis de télédétection. Volume 2 : Applications thématiques. Presses de l'Université du Québec UREF/ AUPELF, 159-196. Randall, D. Sellers P. and Berry, J. (1996): A revised land surface parameterisation (SiB2) for atmospheric GCMs. Part III: The greening of the Colorado State University General Circulation Model. Journal of Climate, n°9, 738-763. Redjal O. (2005) : Vers un developpement urbain durable… Phénomène de prolifération des déchets urbains et stratégie de préservation de l’écosystème - Exemple de Constantine -, UNIVERSITE MENTOURI, Pp : 8. Walker B. And Steffen W. (1996): Global Change and Terrestrial Ecosystems. IGBP Book Series No. 2. Cambridge : Cambridge University Press,. 619p.
This contribution has been peer-reviewed. The double-blind peer-review was conducted on the basis of the full paper. doi:10.5194/isprsannals-II-2-W2-35-2015
40