Jour of Adv Research in Dynamical & Control Systems, 13-Special Issue, September 2017
Detection and Trace Back of DDoS Attack Based on Statistical Approach T. Subburaj, Research Scholar, Department of Computer Applications, Kalasalingam University, Krishnankoil, Srivilliputtur, Tamilnadu, India. E-mail:
[email protected] K. Suthendran, Associate Professor, Department of Information Technology, Kalasalingam University, Krishnankoil, Srivilliputtur, Tamilnadu, India. E-mail:
[email protected]
Abstract--- A distributed denial of service (DDoS) attack is the one of the most serious attacks in online causing financially devastating results. They work by creating traffic overflow on internet connections, effectively forcing the services offline. In this attack, the attackers or hackers not involve directly. Zombies or bot-nets are used to attacking the victims. During November 2016, the hacker news.com stated that hackers are trying to shut down the whole Internet of a country, and partially succeeded, by launching massive distributed denial-of-service (DDoS) attacks using a botnet of insecure IoT devices infected by the Mirai malware. In order to prevent our systems or network from such attacks many statistical approaches based on mean values are existing. In this work, a novel idea is proposed based on the median calculation to detect the attacks on the networks with improved accuracy. Keywords--- DDoS Attack, Security, Entropy, Mean, Median, Traceback.
I.
Introduction
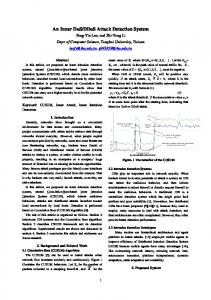
The Denial of Service (DoS) attack is designed to prevent the online service provided by target. The spread form of the DoS attack is called the DDoS attack. The DDoS means decreased availability from security point of view, an outage from operations point of view and money loss from business point of view. Table 1 shows the description of responsibility for each attack node. In Figure 1shows DDoS attack structure. Table 1: Role of DDoS Attack Nodes NAME Attacker Master Zombie or bot-net Victim
RESPONSIBILITY Remotely control the all attack operations and distribute commands or instructions directly. Instructions receive from attacker and all zombies are handling by master. Directly communicate and attack the victims system, More number of zombies is called bot-net. Target system is called. Attacker
Master
Zombies
Zombies
Master
Zombies
Zombies
Zombies
Zombies
Victim
Figure 1: The Structure of DDoS Attack
ISSN 1943-023X
66
Jour of Adv Research in Dynamical & Control Systems, 13-Special Issue, September 2017
A. DDoS Attack Detection and Trace Back The DDoS attack symptoms are like reports of the network running slow, Critical servers are not responsive, WAN interfaces saturated impact all traffic and Layer-7 attacks exhaust resources on victim. In victim system DDoS attack is detect; the concept of entropy calculation is one of the methods used on the router. In router, all travelling packets information is stored based on time intervals. The data flow variation is detected based on the threshold value of the normal flow and the decision is taken accordingly. The attack path is identified based on the abnormal dataflow on the router and the same information is passed to the previous router. The same procedure is repeated on each router until reaching the attacker system. In this paper, the DDoS attack detection and trace back of attack source is done using the median calculation of the statistical approaches.
II.
Literature Survey
In the internet things are moving fast and in 2016 we may expect to have 3000 Gbps DDoS attack [24]. This attack doesn’t have privilege of big operators and data centres, even small or medium company are a target. In[25],statistics[Q3 2014-Q3 2015] show that the DDoS attacks are increasing year over year and specially during Q3 2015 , 180% increase in total DDoS attack. In [1], S. Savage et al projected to trace back the source of attack using packet marking methods. In this work, travelling packets added the particular information by all routers path. This information is used to trace down the attacker, even if the IP is spoofed. S. Matsuda et al, proposed logging method [2], the routers keep some information associated to the travelling packet. This information can be later on used to trace back to the sender node from which the packet has been originated. Since the router stores information about each and every packet passes by and it requires increased memory and CPU usage at routers of the attacked path causes a problem for logging method [3]. Specifically, on Probabilistic Packet marking [1], identified the routers along the path between the source and the destination with help of marking packets. The consequent works [4–6] improved the basic PPM by, among others, enhanced encoding of marks, authenticating marks, and making the map of possible attacks available to the victim. Y.K. Tseng, H.H.C.W.S. Hsieh et al, [7] proposed to change the PPM that ensures that the probability of acceptance the mark is equal to the original marking probability. A. Yaar, et al., [8] proposed a new method to identify the encoding path by marking packets. A. Yaar, A. Perrig, D. Song et al., [9], further improvements to PPM, after receiving few packets the victim can identify the attack path with high probability and short time are proposed. M.T. Goodrich et al., [10], proposed to use randomize-and-link to link the large number of message fragments in a way that is highly scalable, for the checksums serve both as associative addresses and data integrity verifiers. The addresses of probable router messages are spread by attacker to have a collision with legitimate messages. Z. Gao, N. Ansari et al., [11] proposed to encode the Autonomous System level (AS Level) information to ensures the downstream router and check the correctness, then reducing the impact of router. IP address information of each router to reconstruct the attack paths. It is also called as Legacy IP traceback schemes. In the ICMP traceback methods that require routers to send an ICMP message containing the routers’ identification information to the destination of every nth packet [12–13]. In victim system, reconstruct the attack path using ICMP messages. On DPM the packets are marked by ingress router with fixed probability [14][15]. The number of packets required is very less and reconstruction is a simple process. A scalability problem exists as there are only 25 spare bits of the IP packet that can be used for updating. Wang et al. [16] proposed a relative entropy based application layer-DDoS detection method, used to detect the apps DDoS attacks. Yu et al. [17] proposed an Entropy based detection methods used to identify attacking path and also find the attackers orgin. Oikonomou and Mirkovic [18] analyzed defenses against flash-crowd attacks via human behavior modeling, which differentiate DDoS attacks from human flash crowds. Kandula et al. [19] proposed a system to protect a web cluster from DDoS attacks by CAPTCHAs. Wang, Jin, and Shin [20], proposed Hop Count Filtering (HCF) techniques is used to accurate IP-tohop-count (IP2HC) mapping table is used to detect and discard spoofed IP packets. HCF is one of the best approach for prevent and protect the system against the DDoS attacks based on the spoofed IP address. Adrian Perrig, Dawn Song and Abraham Yaar [21] proposed a novel approach to defending against DDoS and IP spoofing attacks. StackPi scheme has great potential as a DDoS and IP spoofing defense mechanism. To identify the StackPi marks of attack packets to filter out all attack packets with the same marking. The victim can associate Stackpi marks with source IP addresses to detect source IP address spoofing. In author [22] provides the new scheme to prevent malicious hackers from DDoS flooding attacks on any IP-based public network. Detect flood
ISSN 1943-023X
67
Jour of Adv Research in Dynamical & Control Systems, 13-Special Issue, September 2017
attacks through adaptive filtering with differential quality of services provided to good and bad packets. In Differential Packet Filtering against DDoS Flood Attacks [22], author relies on probabilistic means to determine risky packets. This method is very useful for to change the traffic and also check the quality of service.
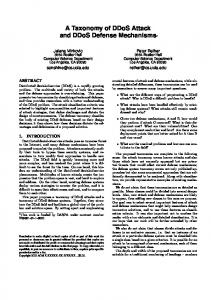
III. Existing Work Abhinav Bhandari et al [23], proposed the detection of the DDos attack using the entropy variation methods. They simulated lot of nodes in network for identifying the attackers using entropy calculation on every second. During the non-attacking time the entropy values are secure. When the attackers are entered in to the networks the entropy values of the each router will be decrease. Quality of the service is also affected. The total number of nodes get decreased, delay increases when the decrease occurs the genuine users provides the quality of services. Each and every router is calculating the entropy value on every second. A DDoS attack occurs in the legitimate flow decreases based on the entropy value. Top identify the decreasing the flow of the data with time as the attack strength is increasing. Then the average entropy is calculated, that minimum of the threshold value means the data flow is affected by DDos attacks. This approach is not suitable when more number of attacks on the same network. False positive and the false negative are also available in this method.
Figure 2: Sample Network for DDos Detection The above figure 2. Shows the DDoS detection sample network was proposed by Abhinav Bhandari et al. It has three routers and two systems and one victim system. From the first second of the transformation of the packets of R1, R2, R3 routers are updating the entropy value. Table 2: Flow based Entropy Samples on A1 and A2 Systems Data Flow based Entropy at R1 Time Flow Entropy Flow from the A1 0.78 1 Flow from the A2 0.89 Flow from the A1 0.96 2 Flow from the A2 0.77 Flow from the A1 0.25 3 Flow from the A2 0.15 Flow from the A1 0.22 4 Flow from the A2 0.19 Flow from the A1 0.28 5 Flow from the A2 0.11 Flow from the A1 0.9 6 Flow from the A2 0.8 Flow from the A1 0.78 7 Flow from the A2 0.88
ISSN 1943-023X
68
Jour of Adv Research in Dynamical & Control Systems, 13-Special Issue, September 2017
Flow Variations 1.2 Entropy Value
1 0.8 0.6 0.4
A1
0.2
A2
0 1
2
3
4
5
6
7
Time Duration
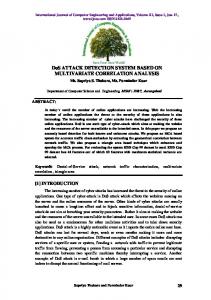
Figure 3: Flow Variation in Entropy at Router R1 The data flow variations on the R1 router is denoted in Fig.2 and Table 2. The R1 router was taken from the above DDoS detection example. It has A1, A2 users; they send the packets to the victim systems through the R1, R2 and R3 routers. In that, the reasonable traffic flows exist through the network for first 2 seconds. The attackers start sending large volume of data packets towards the victim after the first 2 seconds at a rate and the entropy value also decreasing. On 3rd to 5th seconds, the attackers are send the lot of message to the victim now the entropy value is going to decrease. Suddenly the 6th seconds the attackers stop to sending the message, now the entropy value increased to the normal flow. In this method calculating time is very low but false positive and false negatives are high. To overcome these issues we have proposed the approach to identify the flow variation based on the entropy calculation and the threshold value is chosen based on the median based standard deviation calculation and the six sigma value to detect the attacks and to trace back the origin.
IV. Detection and Trace Back Entropy calculation is used to detect the DDoS attack on the victim’s router. Entropy is used for identify the changes in randomness of the flow of data from routers. The range of entropy value is 0 – logn. Threshold value is used for identifying the attack flow in the attacking time. Statistical approach is used for calculating the threshold value. Entropy and threshold values are used to detect the attack flow. Once the data flow variation is identified then the trace back starts from the victim’s router by comparing the entropy value of incoming data flow with the threshold value and decisions are taken accordingly. Later this work is carry forwarded to the upstream routers. When the entropy value of router is one and above then the entropy comparison is done for all the incoming data flows. This process is repeated until reach the attacker’s origin and then blocking that particular IP address.
V.
Simulation and Results
Figure 4: Packet Flow Diagram
ISSN 1943-023X
69
Jour of Adv Research in Dynamical & Control Systems, 13-Special Issue, September 2017
In Figure.4 shows that multiple users including some attacker or hacker is also sending the data to the victim system and its information’s are as follows Total number of systems : 12 Number of Attackers : 6 Number of Routers : 11 Normal flow period : 1 sec – 5 sec Attack initialization : 5.1 sec Analysis period of attack : 5.1 sec – 10 sec In above scenario, the information is passed by the routers and reaches the victim. Totally 12 systems are communicating to the victim system. Hackers are sending the lot of unwanted information to the victim. The message which comes from attacking node is marked as red colour. Initially all the messages are seem to be normal messages. During that time the value of threshold is calculated based on the normal data flow. After that the entropy value of all incoming data flows are compared with threshold value and decision is taken accordingly. Table 3: Number of Packets to the Router on Various Time Intervals Router R1 R2 R3 R4 R5
0.0 – 1.0 Sec 99 85 24 91 78 101 106 222 86 91
1.1 – 2.0 Sec 105 69 88 56 99 66 54 89 44 66
3.1 – 3.0 Sec 88 90 26 91 55 88 89 62 86 88
3.1 – 4.0 Sec 59 68 44 69 78 88 59 89 98 55
4.1 – 5.0 Sec 68 49 92 66 77 48 98 55 88 91
5.1 – 6.0 Sec 466 422 500 56 460 66 54 450 44 400
The table.3 shows the comparison of normal packet flow and attacker’s packet flow. First finding the entropy value for the all packets in each router on every second using the following formulae. n
Entropy:
∑ p( xi) * log p( xi)
(1)
i =1
Where p(xi) = (Number of attack or normal packet)/ Total No of packet. Initially the entropy value is calculated on the incoming data flow using the formula (1) for all the routers. The entropy values of the all routers are shown in the following table 4: Table 4: Entropy Values of all Routers on the Normal Time Routers
ISSN 1943-023X
Time durations (Seconds) 0.0 – 1.0
1.1 – 2.0
2.1 – 3.0
3.1 – 4.0
4.1 – 5.0
R1
1.00
0.97
0.99
0.99
0.99
R2
0.73
0.96
0.79
0.96
0.84
R3
0.99
0.97
0.71
0.80
0.78
R4
0.91
0.96
1.00
1.00
0.99
R5
1.00
0.97
0.95
0.93
0.94
R6
1.56
1.58
1.55
1.58
1.57
R7
0.93
0.99
1.00
0.99
0.99
R8
1.00
0.93
0.99
0.98
0.99
R9
0.99
0.99
0.97
1.00
0.99
R10
0.99
0.99
0.97
1.00
0.99
R11
0.62
0.63
0.69
0.71
0.68
70
Jour of Adv Research in Dynamical & Control Systems, 13-Special Issue, September 2017
A. Mean based Threshold Formula The mean calculation is using for the average of the all numbers. It is sometimes called the arithmetic mean. Calculate the mean base threshold value by using the below formula.
1 n ∑ H ( Xi) n i =1
Average (Mean) Calculation (β) = Standard Deviation (σ)
=
Six-Sigma value (ή) Threshold value of entropy
= =
∑ (x − µ)
2
N 6σ ή + or - β
B. Median based Threshold Formula The median of the dataset is dependent on whether the number of elements in the data set is odd or even. Using the following formulas to calculates the median based threshold value. Median calculation (β) = if the total number of Value is odd number means = {(n + 1) ÷ 2} th value OR Value is even number means Average
= (Value before median + value after median) ÷ 2
Standard Deviation (σ)
=
∑ (x − µ)
2
N
Six-sigma calculation
=
6*σ
Threshold value of entropy
=
ή + or - β
The six-sigma and mean or median based Standard deviation formula is used to calculate the threshold values. In the victim is connecting to the Router R11. It has the 2 flows. Entropy values are as follows 0.42,0.20,0.42,0.21,0.45,0.24,0.52,0.36,0.52,0.37 Based on the time of 0.0 second to 5.0 seconds . Median Values S.D 6*σ Threshold value
= 0.39 Mean Value = 0.119 S.D = 0.715 6*σ = 0.32 Threshold value
= 0.37 = 0.119 = 0.715 = 0.34
Table 5: Threshold Value of all Routers on the Normal Time Router R11 R8 R7 R6 R5 R1 R2 R3 R4
Threshold Value (Median ) 0.32 0.357 0.25 0.584 0.19 0.307 0.15 0.18 0.20
Threshold Value (Mean) 0.34 0.359 0.26 0.586 0.21 0.309 0.17 0.20 0.21
Compare the median and mean a value from the table 5 median based threshold value is lower than the mean based threshold value. If choose the mean based threshold value means without attacking flows also identified the attacking flow. Mean value have increase the false positive. Assume that above example entropy value is 0.33. Now compare with the threshold value in mean based threshold means this entropy value is the attack flow. But in median based it is a normal flow. In normal flow also identified the attack flow in the mean based threshold value. So we choose the median calculation. Calculate the entropy values for the flow time between 5.1 seconds to 6.00 seconds are:
ISSN 1943-023X
71
Jour of Adv Research in Dynamical & Control Systems, 13-Special Issue, September 2017
Table 6: Entropy Calculation for All Routers on 5.1 sec to 6.00 sec R1 R2 R3 R4 R5 R6
R7 R8 R9 & R10 R11
Flows 466 422 500 56 460 66 140 850 110 700 888 556 526 990 810 1970 1800 22 20 42 2918
Sum 888 888 556 556 526 526 990 990 810 810 1970 1970 1970 1800 1800 3770 3770 42 42 2960 2960
p(xi) 0.52 0.48 0.90 0.10 0.87 0.13 0.14 0.86 0.14 0.86 0.45 0.28 0.27 0.55 0.45 0.52 0.48 0.52 0.48 0.01 0.99
log*p(xi) -0.93 -1.07 -0.15 -3.31 -0.19 -2.99 -2.82 -0.22 -2.88 -0.21 -1.15 -1.83 -1.91 -0.86 -1.15 -0.94 -1.07 -0.93 -1.07 -6.14 -0.02
p(xi)*log p(xi) (Base 2) 0.49 0.51 0.14 0.33 0.17 0.38 0.40 0.19 0.39 0.18 0.52 0.52 0.51 0.47 0.52 0.49 0.51 0.49 0.51 0.09 0.02
H(X) 1.00 0.47 0.54 0.59 0.57 1.54
0.99 1.00 1.00 0.11
For the table 6 the entropy value of Router R11 is 0.11. The entropy value with the median based threshold value is 0.32. When the entropy value is less than the threshold value means that flow is attack flow. After identification of the attack flow the trace out of attack source begins. Router R11 has the 2 flows are Flow1 path is R9-R10-R11 and Flow2 paths is R1-R2-R3-R5-R8-R11 & R4-R5R7-R8-R11. Flow1 entropy value is 0.09 and the Flow 2 entropy value is 0.02. To check which one is the lowest entropy value is the attack flow. So identified the Flow2 is the attack flow. Then move on to the Router R8 for further verification. Router R8 has two flows that are Flow1 path is R1, R2, R3 - R5-R8 and the Flow2 path is R4, R5-R7-R8. Now check the entropy value. Router R8 entropy value one means to verify the all flows on the router. On the Router R8 have Flow1 from the R6 & flow2 from the R7 are going to ensure. In Router R6 at the time of attack the Entropy value is 1.54. Entropy value is one and above means to check the all flows on the routers. In Router R6 have three flows (R1-R6, R2-R6, R3-R6). Now verify three flows to find the attack flow or not. In router R1 have two flows (A-R1, B-R1) and entropy value is 1.00. The two flows entropy values are around equal so these flows are defined as attack. In that flow the two users A & B are connected then identify the flows is attack flow so the two users are named as attackers. Router R2 has 2 flows (C1-R2, C2- R2). The entropy value of C1-R2 is 0.14 and the C2- R2 is 0.33. The threshold value of Router R2 is 0.15. Now compare the threshold value to Entropy values of 2 flows. Then determine the lowest entropy is defined as attack flow. In that C1-R1 flow has the lowest entropy, so it is attack flow. Router R3 has 2 flows (D-R3, E- R3). The entropy value of D-R3 is 0.17 and the E- R3 is 0.38. The threshold value of Router R2 is 0.18. Now compare the threshold value to Entropy values of 2 flows. Then determine the lowest entropy is defined as attack flow. In that D-R3 flow has the lowest entropy, so it is attack flow. In Router R7 at the time of attack the Entropy value is around 1.00. Entropy value is one means to check the two flows. On the Router R7 have Flow F1 from the R4 & flow F2 from the R5 are going to ensure. Router R4 has 2 flows (F-R4, G-R4). The entropy value of F-R4 is 0.40 and the G-R4 is 0.19. The threshold value of Router R4 is
ISSN 1943-023X
72
Jour of Adv Research in Dynamical & Control Systems, 13-Special Issue, September 2017
0.20. Now compare the threshold value to Entropy values of 2 flows. Then determine the lowest entropy is defined as attack flow. In that G-R4 flow has the lowest entropy, so it is attack flow. Router R5 has 2 flows (H-R5, I-R5). The entropy value of H-R5 is 0.39 and the I-R5 is 0.18. The threshold value of Router R5 is 0.19. Now compare the threshold value to Entropy values of 2 flows. Then determine the lowest entropy is defined as attack flow. In that H-R5 flow has the lowest entropy, so it is attack flow. Finally user A, User B, User C1, User D, User G and User I are the attackers. To block that Users IP address.
VI. Conclusion and Scope In this paper, a novel approach has been proposed to detect the attacks on the networks with improved accuracy which enables to trace out of attack source quicker. The comparison result shows that the proposed approach based on the median calculation is accurate than the existing mean based threshold value. Further, it is achieved with reduced false positive and less overhead on the router. However, this approach is not suitable for the low rate and the high rate flow attack identification and it is still open issue. In future, we propose a new approach to handle low rate and high rate data flow attack identification using entropy calculation and trace out the source of the attackers.
Acknowledgment The author would like to thank the management of Kalasalingam University for supporting the research through University Research Fellowship.
References [1] [2] [3] [4] [5] [6] [7] [8] [9] [10] [11] [12] [13] [14]
[15] [16]
Savage, S., Wetherall, D., Karlin, A. and Anderson, T. Network support for IP traceback. IEEE/ACM transactions on networking 9 (3) (2001) 226-237. Matsuda, S., Baba, T., Hayakawa, A. and Nakamura, T. Design and implementation of unauthorized access tracing system. Symposium on Applications and the Internet, 2002, 74-81. Gong, C. and Sarac, K. IP traceback based on packet marking and logging. IEEE International Conference on Communications, 2005, 1043-1047. Dean, D., Franklin, M. and Stubblefield, A. An algebraic approach to IP traceback. ACM Transactions on Information and System Security 5 (2) (2002) 119-137. Song, D.X. and Perrig, A. Advanced and authenticated marking schemes for IP traceback. Twentieth Annual Joint Conference of the IEEE Computer and Communications Societies, 2001, 878-886. Doeppner, T.W., Klein, P.N. and Koyfman, A. Using router stamping to identify the source of IP packets. Proceedings of the 7th ACM conference on Computer and communications security, 2000, 184-189. Tseng, Y.K., Chen, H.H. and Hsieh, W.S. Probabilistic packet marking with non-preemptive compensation. IEEE Communications Letters 8 (6) (2004) 359-361. Yaar, A., Perrig, A. and Song, D. Pi: A path identification mechanism to defend against DDoS attacks. Symposium on Security and Privacy, 2003, 93-107. Yaar, A., Perrig, A. and Song, D. FIT: Fast internet traceback. 24th Annual Joint Conference of the IEEE Computer and Communications Societies, 2005, 1395-1406. Goodrich, M.T. Efficient packet marking for large-scale IP traceback. Proceedings of the 9th ACM Conference on Computer and Communications Security, 2002, 117-126. Gao, Z. and Ansari, N. A practical and robust inter-domain marking scheme for IP traceback. Computer Networks 51 (3) (2007) 732-750. Bellovin, S.M., Leech, M. and Taylor, T. ICMP trace back messages, IETF Draft, 2000. Massey, D., Mankin, A., Wu, C.L., Zhao, X.L., Wu, F., Huang, W. and Zhang, L. Intention-Driven ICMP Trace-Back. Internet Draft: draft-ietf-itrace-intention-00. txt. Expires, 2002. Mankin, A., Massey, D., Wu, C.L., Wu, S.F. and Zhang, L. On design and evaluation of "intention-driven" ICMP traceback. Tenth International Conference on Computer Communications and Networks, 2001, 159165. Belenky, A. and Ansari, N. IP traceback with deterministic packet marking. IEEE communications letters 7 (4) (2003) 162-164. Wang, J., Yang, X. and Long, K. A new relative entropy based app-DDoS detection method. IEEE Symposium on Computers and Communications (ISCC), 2010, 966-968.
ISSN 1943-023X
73
Jour of Adv Research in Dynamical & Control Systems, 13-Special Issue, September 2017
[17] [18] [19]
[20] [21] [22] [23]
[24] [25]
Yu, S., Zhou, W., Doss, R. and Jia, W. Traceback of DDoS attacks using entropy variations. IEEE Transactions on Parallel and Distributed Systems 22 (3) (2011) 412-425. Oikonomou, G. and Mirkovic, J. Modeling human behavior for defense against flash-crowd attacks. IEEE International Conference on Communications, 2009, 1-6. Kandula, S., Katabi, D., Jacob, M. and Berger, A. Botz-4-sale: Surviving organized DDoS attacks that mimic flash crowds. Proceedings of the 2nd conference on Symposium on Networked Systems Design & Implementation. 2005, 287-300. Wang, H., Jin, C. and Shin, K.G. Defense against spoofed IP traffic using hop-count filtering. IEEE/ACM Transactions on Networking (ToN) 15 (1) (2007) 40-53. Perrig, A., Song, D. and Yaar, A. StackPi: a new defense mechanism against IP spoofing and DDoS attacks. Technical Report (2003). Tanachaiwiwat, S. and Hwang, K. Differential packet filtering against DDoS flood attacks. ACM Conference on Computer and Communications Security (CCS), 2003, 1-15. Bhandari, A., Sangal, A.L. and Kumar, K. Destination Address Entropy based Detection and Traceback Approach against Distributed Denial of Service Attacks. International Journal of Computer Network and Information Security 7 (8) (2015). https://www.linkedin.com/pluse/2016-yeaar-3000-gbps-ddos-attack-tech2016-macros-ortiz-valmaseda? trk=pulse_spock-articles https://www.stateoftheinternet.com/downloads/pdfs/Q3-2015-SOTI-Connectivity-Executive-Summary.pdf
ISSN 1943-023X
74