DETECTION OF EVENTS IN A MULTIDISCIPLINARY NETWORK MONITORING VRANCEA AREA VICTORIN-EMILIAN TOADER, IREN-ADELINA MOLDOVAN, ALEXANDRU MARMUREANU, CONSTANTIN IONESCU National Institute for Earth Physics, P.O.Box MG-2, RO 077125, Magurele, Romania E-mails:
[email protected];
[email protected];
[email protected];
[email protected] Received August 30, 2015
This paper describes the modalities of detection of events in a multidisciplinary network that monitor seismicity, telluric field, magnetic field, electric-electrostatic field, radio ULF waves, air ionization, radon concentration, solar radiation, infrasound, light and acoustic phenomena, meteorological parameters, air-earth temperatures, satellite data with application in seismic Vrancea area (bending zone of Carpathians mountains). The most part of data analysis is automatically done into a distributed structure. Methods used are general but the measured parameters have to be adapted to particularities of monitoring area. Vrancea is a complex zone characterized by intermediate depth earthquakes concentrated and distributed on several levels deep. Data acquisition is followed by their analysis (detection, effects evaluation) and automatic transmission of alerts to beneficiaries specialized in emergency situations (Inspectorate for Emergency Situations, organizations involved in managing special events). Network monitoring allows tracking of climate change and it sends information in real time. Key words: seismic event detection, multidisciplinary monitoring, precursor phenomena, information and alert system, acoustic monitoring, radon detection, cross-correlation.
1. INTRODUCTION
Many applications detect events from real world that involve monitoring for long time periods and large volumes of data. Some abnormal deviations are event of interest that is detected in near – real time (like an earthquake) or offline for slow phenomena (i.e. atmospheric temperature). An early detection allows rapid decision making and to avoid human, material losses and reduces cost to society. Our multidisciplinary network has application for Inspectorate for Emergency situations (in Romania and Bulgaria), to civil engineering like dams Vidraru-Bicaz, and at reactor of Nuclear Research Institute from Mioveni Romania. A part of sensors are for environmental monitoring (meteorological stations, CO2, radon, ionization, clouds, solar radiation, light and acoustic phenomena). Rom. Journ. Phys., Vol. 61, No. 7–8, P. 1437–1449, 2016
1438
Victorin-Emilian Toader et al.
2
We focus at lithosphere – atmosphere coupling and the relation between tectonic stress, earthquakes and related phenomena. Anomalies can be detected by a simple STA/LTA algorithm or could be a complex analysis that needs a large quantity of data (i.e. radon monitoring). Many times the first step is to eliminate the false information. The cleaning process could be difficult because what you do not need for an application could be useful for other. Our goal is to detect early as possible with high accurately the deviation from normal state. An application in seismology is earthquake warning system (EEWS). This is a way to avoid large damages and to prevent the population with 25–30 seconds before the event. Chaoyong Peng et al. in ‘Development of an integrated onsite earthquake early warning system and test deployment in Zhaotong, Chin’ [1] use the classic STA/LTA algorithm and Pd method to determinate the magnitude. Y. Cansy introduced PMCC (Progressive Multi-Channel Correlation) theory based on crosscorrelation functions of each couple of stations [2] from a dense array. Sometimes you need an array to locate the source of event. This is the case for seismic networks. Y. Cansi and Y. Klinger in ‘An automated data processing method for mini-arrays’ [3] describe the application of PMCC method for analyzing lowamplitude infrasonic coherent waves within non-coherent noise.
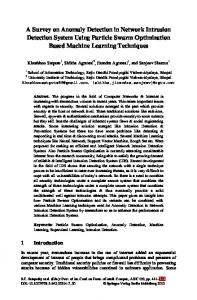
Fig. 1.1 – Main faults (map by C. Dinu, V. Raileanu et al. CEEX 647/2005, NIEP).
3
Detection of events in a multidisciplinary network monitoring Vrancea area
1439
Cross-correlation is used for detect automatic the P wave by El Hassan Ait Laasri et al. in ‘Automatic detection and picking of P wave arrival in locally stationary noise using cross-correlation [4]. We use the same method for geomagnetic signals analysis. Another event is a meteor explosion in atmosphere [5]. Acoustic – seismic signals were recorded by hundreds of seismic stations in U.S. Pacific. The atmosphere is inhomogeneous propagation environment that can change rapidly. We have a similar example in Fig. 2.3 (meteor explosion over Vrancea 07.01.2015). Three weather stations were used to evaluate the acoustic wave propagation conditions. This paper presents an original implementation of a multidisciplinary network (Fig. 1.1) [6]. Seismic events are not everywhere. A geological map helps us to select monitoring stations (MLR, NEHR, LOPR, BISR, ODBI, VRI, PLOR, COVR) near to faults [7]. 2. NETWORK STRUCTURE
We present a general structure of monitoring network in Fig. 1.1, logical diagram in Fig. 2.1 and station equipment in Fig. 2.2.
Fig. 2.1 – General logical structure of a complex monitoring network and data processing.
1440
Victorin-Emilian Toader et al.
4
Fig. 2.2 – Equipment into a seismic station.
National Institute for Earth Physics of Romania (NIEP) has a large seismic network (Fig. 2.3). A part of stations belongs to a multidisciplinary monitoring structure. Stations NEHR, BISRR, LOPR, ODBI, and VRI (Fig. 1.1) have acoustic pressure sensors. VRI and PLOR monitor the magnetic and electric fields, and watch the clouds. The positions of stations are correlated with geological faults (Fig. 1.1). This is important for radon, CO2 and ionization monitoring. Direct and reflected solar radiation is determinate with a net radiometer sensor, too. The red numbers from Fig. 2.3 represent the order of arrivals of acoustic waves caused by the explosion of a meteor over Vrancea 15/01/07.
5
Detection of events in a multidisciplinary network monitoring Vrancea area
1441
Fig 2.3 – NIEP monitoring network.
3. METHODS, SOFTWARE FOR INFORMATION AND WARNING
First stage (‘1’ in Fig. 3.1) is data acquisition (Fig. 2.1 notation D). Every station has a multichannel digitizer (Fig. 2.2). One application or more take the information and send it to stage ‘2’ where we gather all information and decide if we have an alert situation (Fig. 2.1, Analysis + Trigger). A server gets information from stage ‘2’ or from other sources (EWS) and send messages to clients (Fig. 3.1, stage ‘3’). The stage ‘4’ represents the interface to end users note with ‘5’. ‘5a’ is a SMS dispatcher, ‘5b’ send emails to a list, ‘5c’ is an info-alert application (visual and sound) that connects a light tour (‘6b’), displays the earthquake solution on a map (‘6’a) and on an alert window (‘6c’). All these applications have a backup for safety. The info-alert process waits the confirmation from clients and resends the message if there are errors. The network activity is stored in files and a special software analysis offline the quality of connections. An example of detection is in Fig. 3.2. The levels are determined
1442
Victorin-Emilian Toader et al.
6
off line with other software and stored in a configuration file. Detection of exceed the limits of telluric field, ionization, electrostatic field or meteorological conditions is presented in Fig. 3.2, too. The time and values are saved in files and send to stage ‘2’ from Fig. 3.1. Radon monitoring is analysed using standard deviation according to atmospheric pressure, humidity and temperature. Magnetic storms are reported as well (Figs. 3.6–3.9).
Fig. 3.1 – Software implementation, information flux 1–6.
7
Detection of events in a multidisciplinary network monitoring Vrancea area
1443
Fig. 3.2 – Software acquisition, triggering.
Figure 3.2 shows three programs and behind them there are others for FTP transfer and format conversion. On left upper site we have information from a multichannel digitizer used for telluric currents, air-borehole temperature, air ionization, and inclinometer. Next we measure the geomagnetic field with 24 bits resolution. Both programs trigger in real time. The detection is a simple level threshold with hysteresis. The sample rate is 1 Hz. In lower part we have meteorological information. Seismic signals have a low frequency and the usual triggering method is STA/LTA. Fig. 3.3 presents a real earthquake recorded at Vrancioaia station (VRI HHZ component). Spectrogram shows that the S wave has the main energy. Two filters can be used for attenuate the noise. The JTFA method has few algorithms implemented (LabVIEW library): the Adaptive Spectrogram, the Cone Shaped Distribution, the Choi-Williams Distribution, the Gabor Spectrogram, the ShortTime Fourier Transform (used in picture), the Wigner-Ville Distribution, and the wavelet with proper parameters. Filters type is selectable (Low pass, High pass, Band pass, Band stop), and design Butterworth, Chebyshev, Invers Chebyshev, Elliptic, Bessel, and Median. The button ‘apick’ from low left corner of Fig. 3.3 opens the window Fig. 3.4. The operator can change the parameters of the detector STA / LTA directly or could edit/save them (Fig. 3.5). The trigger/detrigger levels, settle time,
1444
Victorin-Emilian Toader et al.
8
time window length, coda ratio could be changed. Many times triggering stops in noise. To avoid this we use two cursors (ST and oF) in the upper graph from Fig. 3.4.
Fig. 3.3 – Seismic signal, power spectrum and spectrogram.
The magnetic field is characterized by disturbances caused by solar flares. Examples are in figures 3.6–3.9, where Kp = 8 by NOAA (22.06.15–25.06.15). Correlation involves a “master” station. Fig. 3.6 shows graphs SLRmg*MLRmg, SLRmg *THY, where SLRmg (Surlari, Faculty of Physics, Bucharest, Romania) is defined as master. MLRmg is a Bartington magnetometer in Muntele Rosu station (Fig. 1.1), and THY is an Intermagnet station in Hungary. We used the Pearson formula for correlation coefficients:
.
(1)
This relation is applied on a moving time window “delta(s)” with steps “delta%”. The results are (Fig. 3.6): +1, there is a perfect linear correlation; 0, no correlation; –1, there is a perfect negative correlation.
9
Detection of events in a multidisciplinary network monitoring Vrancea area
Fig. 3.4 – Pick with STA/LTA method.
Fig. 3.5 – Trigger, STA/LTA configuration.
1445
1446
Victorin-Emilian Toader et al.
Fig. 3.6 – Correlation, SLRmg master channels.
Fig. 3.7 – Subtract Pairs of Channels.
10
11
Detection of events in a multidisciplinary network monitoring Vrancea area
1447
A simple analysis is done by subtracting pairs of axes after a derivation or filtration. In Fig. 3.7 is an example where SLRmg station is the reference, too. Geomagnetic field is characterized by impedance. The detection can be applied on Bz/Bx,By signals (Fig. 3.8).
Fig. 3.8 – Bz /Bx,y Geomagnetic Impedances.
A good detection is on derived signals (Fig. 3.9). In this case the first front is higher than in Fig. 3.6, the constant factors are eliminated and the trigger is safer. We use the same method for radon in correlation with atmospheric pressure to avoid false alerts.
Fig. 3.9 – Derivative Analysis.
Some methods cannot be used in real time. In this case triggers announce that you need attention and an offline analysis is necessary. The atmospheric conditions affect radon variations, for example [8]. A correlation is necessary when you analysis solar radiation with net radiometers (2 Pyranometers, 2 Pyrgeometers, 2 temperature sensors), too. The acoustic monitoring usually uses an array of
1448
Victorin-Emilian Toader et al.
12
sensors [3]. We detect differences in propagation times for locate the source of the event. Every signal has a signification and a method attached. DGD_k (Daily Geomagnetic Data, K indices) are downloaded from NOAA, so figures 3.6–3.9 are not in real time. 4. CONCLUSIONS
A monitoring network involves a multidisciplinary activity that highlights the interdependence of environmental factors (air, earth) and their balance under normal conditions. Weather or seismic events represent the point of maximum imbalance and may occur at any time. The network has to be ready for every event at any time (What we learned from the Great Tohoku earthquake? [9]). Few applications work in nine Inspectorate for Emergency situations, in dams VidraruBicaz (Fig. 4.1), Eforie station (Tsunami Center to the Black Sea) and at TRIGA reactor of Nuclear Research Institute from Mioveni. Acoustic method is feasible for Vrancea area but it should correlate with other parameters [10]. The result of this project is the growth of the seismic alert service through: perfecting risk evaluation, seismic forecast, informing the decision factors regarding the impact minimization of natural disasters and the education of the population.
Fig. 4.1 – NIEP Information and Alert System, dams monitoring.
13
Detection of events in a multidisciplinary network monitoring Vrancea area
1449
New detection technics will be applied. An example is in ‘Application of a wavelet technique for the detection of earthquake signatures in the geomagnetic field’ by L. Alperovich et al. [11]. An earthquake means energy released in a nonlinear environment [12]. Only a multidisciplinary network creates the opportunity to understand the related phenomena and can minimize the effects. Acknowledgements. This work was supported by a grant of the Romanian National Authority for Scientific Research, Programme for research – Space Technology and Advanced Research – STAR, project number 84/2013, AeroSolSys, and by the Partnership in Priority Areas Program – PNII, under MEN-UEFISCDI, DARING Project no. 69/2014.
REFERENCES 1.
ChaoyongPeng, XiaoyiZhu, JiansiYang, BingXue, YangChen, Development of an integrated onsite earthquake early warning system and test deployment in Zhaotong, China, Computers &Geosciences, V 56, p. 170–177, 2013. 2. Y. Cansi, An automatic seismic event processing for detection and location: The P.M.C.C. method, Geophysical Research Letters, V 22, p. 021–1024, 1995. 3. Y. Cansi and Y. Klinger, An automated data processing method for mini-arrays, CSEM/EMSC European-Mediterranean Seismological Centre, NewsLetter V 11, p. 1021–1024, 1997. 4. El Hassan Ait Laasri, Es-Said Akhouayri, Dris Agliz, Abderrahman Atmani, Automatic detection and picking of P wave arrival in locally stationary noise using cross-correlation, Digital Signal Processing 26, 87–100, 2014. 5. Michael A. H. Hedlin, Doug Drob, Kris Walker, and Catherine de Groot‐Hedlin, A study of acoustic propagation from a large bolide in the atmosphere with a dense seismic network, Journal of Geophysical Research, Vol. 115, B1 1312, 2010. 6. V.E. Toader, I.A. Moldovan, C. Ionescu, Complex Monitoring and Alert System for Seismotectonic Phenomena, Rom. Journ. Phys., 60, 7–8, 1225–1233 (2015). 7. Bala, V. Raileanu, C. Dinu, M. Diaconescu, Crustal seismicity and active fault systems in Romania, Rom. Rep. Phys., 67, 3, 1176–1191, 2015. 8. Daniela Gurau, Doru Stanga, Mitica Dragusin, Review Of The Principal Mechanism Of Radon In The Environment, Rom. Journ. Phys., Vol. 59, Nos. 9–10, p. 904–911, 2014. 9. D. Ouzounov, S. Pulinets, G. Papadopoulos, V. Kunitsyn, I.Nesterov, K. Hattori, M. Kafatos, and P. Taylor, Multi-sensors observations of pre-earthquake signals. What we learned from the Great Tohoku earthquake?, Geophysical Research Abstracts Vol. 14, EGU2012-10234-1, 2012 EGU General Assembly 2012 © Author(s) 2012. 10. Nobuki Kame, Kohei Nagata, Masao Nakatani and Tetsuya Kusakabe, Feasibility of acoustic monitoring of strength drop precursory to earthquake occurrence, Earth Planets and Space, 2014, 66:41. 11. L. Alperovich, V. Zheludev, and M. Hayakawa, Application of a wavelet technique for the detection of earthquake signatures in the geomagnetic field, Natural Hazards and Earth System Science, 1 (1/2), pp. 75–81, 2001. 12. Gheorghe Mărmureanu, Carmen Ortanza Cioflan, Alexandru Mărmureanu, Constantin Ionescu, How Long Time Will We Go With Linear Seismology?, Rom. Journ. Phys., 60, 3–4, 613–625, 2015.