atmosphere Article
Detection of Ground Clutter from Weather Radar Using a Dual-Polarization and Dual-Scan Method Mohammad-Hossein Golbon-Haghighi 1,2, *, Guifu Zhang 1,2,3 , Yinguang Li 1 and Richard J. Doviak 1,3,4 1 2 3 4
*
School of Electrical and Computer Engineering, University of Oklahoma, Norman, OK 73019, USA;
[email protected] (G.Z.);
[email protected] (Y.L.);
[email protected] (R.J.D.) Advanced Radar Research Center, University of Oklahoma, Norman, OK 73072, USA School of Meteorology, University of Oklahoma, Norman, OK 73072, USA National Severe Storms Laboratory, NOAA, Norman, OK 73072, USA Correspondance:
[email protected]; Tel.: +1-405-541-5233
Academic Editors: Werner Singer and Robert W. Talbot Received: 2 March 2016; Accepted: 7 June 2016; Published: 15 June 2016
Abstract: A novel dual-polarization and dual-scan (DPDS) classification algorithm is developed for clutter detection in weather radar observations. Two consecutive scans of dual-polarization radar echoes are jointly processed to estimate auto- and cross-correlation functions. Discriminants are then defined and estimated in order to separate clutter from weather based on their physical and statistical properties. An optimal Bayesian classifier is used to make a decision on clutter presence from the estimated discriminant functions. The DPDS algorithm is applied to the data collected with the KOUN polarimetric radar and compared with the existing detection methods. It is shown that the DPDS algorithm yields a higher probability of detection and lower false alarm rate in clutter detection. Keywords: dual-polarization and dual-scan (DPDS); weather radar; polarimetry; Bayesian classifications; clutter detection
1. Introduction Ground clutter in weather radar observations causes degradation of data quality and can lead to misinterpretation of radar echoes. It is important to detect clutter and to mitigate clutter effects to obtain accurate weather measurements. Ground objects such as buildings, power line poles, and trees can cause severe clutter to be mixed with weather echoes when the radar beam points at low elevation angles. Since these objects are mostly stationary, a band-stop filter can be applied to remove clutter contaminations [1,2]. Although this traditional filtering is frequently used to remove clutter from weather signals, the power components of weather signals may fall into the stop band, causing the filter to also suppress its power components and bias the moment estimates, especially for narrow-band zero-velocity weather signals [3–5]. Although the Gaussian Model Adaptive Processing (GMAP) algorithm [3] is capable of recovering the weather power spectrum, it is time-consuming to apply GMAP at every gate. Thus, to avoid biases from the filtering and to be efficient, the ground clutter locations should first be accurately identified, before applying the filtering, to obtain high-quality weather data. There are a number of clutter detection methods that have been developed and used in weather radar community. Historically, the clutter map method was used for clutter detection, in which radar measurements are made in clear-air conditions. It was also used for clutter-contaminated areas [6]. However, a clutter map can change depending on weather conditions, e.g., abnormal propagations. Therefore, this method is not always reliable. The clutter mitigation decision (CMD) algorithm was introduced in [7–9], which utilizes differences in signal coherence and spatial texture between ground clutter and weather for clutter Atmosphere 2016, 7, 83; doi:10.3390/atmos7060083
www.mdpi.com/journal/atmosphere
Atmosphere 2016, 7, 83
2 of 11
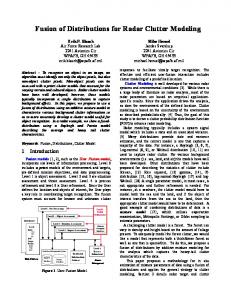
detection. The CMD algorithm is widely known in the weather radar community and combines clutter phase alignment (CPA), texture of reflectivity (TDBZ), and spatial variability of reflectivity field as three discriminant functions for clutter detection. However, the CMD is based on single polarization radar data, and we will show that the probability of detection for CMD is not acceptable, in comparison to other proposed algorithms. The Spectrum Clutter Identification (SCI) algorithm was developed in [2,5,10,11]. It was based on single polarization signal and combined four discriminants for clutter detection. Considering that radar signals from ground clutter have a much longer correlation time than that from weather, a scan-to-scan (dual scan: DS) method was proposed in [12], and shown to be effective in clutter detection. Dual-scan data are available for most operational radars such as the weather surveillance radars (WSR-88D) at low elevation angles. Furthermore, the WSR-88D radar network has been updated with dual-polarization capability [5]. Dual-polarization (DP) data provide rich information for clutter detection. In [5,13], a simple Bayesian approach that utilizes dual-polarization data was developed to separate clutter from weather signals. Discriminant functions of cross correlation coefficients between dual-polarization signals, power ratio (PR), and differential reflectivity (ZDR ) are defined and combined for clutter detection with improved results. In this paper, we combine dual-polarization and dual-scan (DPDS) methods to further improve detection accuracy. Since more information is used, the DPDS method provides a higher probability of detection and lower false alarm rate. This paper is organized as follows: In Section 2, three discriminants derived from DPDS measurements are introduced. In Section 3, the implementation procedure of the DPDS algorithm is discussed. In Section 4, the performance of the DPDS algorithm is evaluated using controlled data collected by KOUN polarimetric radar. Practical results demonstrate that DPDS algorithm improves the detection performance significantly. Conclusions are drawn in Section 5. 2. Discriminant Functions The Bayesian classifier is used to combine DPDS information for clutter detection, which includes estimation and aggregation of discriminants for decision making. In this section, three discriminant functions for clutter detection are defined and estimated based on the DPDS data. The DPDS discriminant functions are the differential reflectivity (ZDR ), the cross-correlation coefficient between two scans (ρ12 ), and the copolar cross-correlation coefficient between dual-polarization (H and V-polarization) (ρhv ) signals. Our training data were collected by the national KOUN (WSR-88D) radar on two different days—this data were used to find the probability density functions (PDFs) for the discriminant functions. The training weather data were collected at 13:08 UTC on 9 February 2011. The weather was mostly cloudy without any precipitation. The training clutter data were collected in clear weather conditions, at 00:46 UTC on 4 February 2011. It should be noted that we created a controlled training data set by matching and combining the almost pure clutter data at 00:46 UTC on 4 February 2011, and pure weather data at 13:08 UTC on 9 February 2011. Two sequential azimuthal scans with different pulse repetition times (PRTs) are used in the volume coverage patterns (VCPs) of the WSR-88D to mitigate range–velocity ambiguities [14]. The first azimuthal scan collects voltage samples data using long PRT (Ts1 = 3.10 ms); and the second scan at the same elevation angles uses a short PRT (Ts2 = 0.973 ms), as shown in Figure 1. To implement the scan-to-scan method, the short PRT data are down-sampled in order to be matched with its corresponding long PRT data. Because the WSR-88D records the azimuth of each voltage sample, we were able to select those short PRT samples that are nearest in azimuth to the corresponding, long PRT samples.
Atmosphere 2016, 7, 83
3 of 11
Atmosphere 2016, 7, 83
3 of 12
clutter
2nd scan
VV (t2 ) 1st scan
VH (t2 ) VV (t1 )
VH (t1 )
Figure Figure 1. 1. Dual-polarization Dual-polarization and and dual-scan dual-scan (DPDS) (DPDS) weather weather radar. radar.
Weather I/Q data were edited by excluding the resolution volumes showing SNR < 20 dB. The Weather I/Q data were edited by excluding the resolution volumes showing SNR < 20 dB. 20 dB SNR threshold is applied to produce data to mitigate/avoid noise effects. The weather data The 20 dB SNR threshold is applied to produce data to mitigate/avoid noise effects. The weather consist of two scans at the same elevation angle (i.e., 1.49°) separated by about 36 s. The clutter data data consist of two scans at the same elevation angle (i.e., 1.49˝ ) separated by about 36 s. The clutter were collected at 00:46 UTC on 4 February 2011 with two scans at the same elevation angle (0.5°) data were collected at 00:46 UTC on 4 February 2011 with two scans at the same elevation angle (0.5˝ ) separated by about 76 s under clear air conditions. Ground clutter I/Q data were edited by deleting separated by about 76 s under clear air conditions. Ground clutter I/Q data were edited by deleting resolution volumes volumesshowing showingmean meanDoppler Doppler velocities 1 1m· s−1 CNR and (Clutter CNR (Clutter to s´ the resolution velocities |vr | v ěr 1 m¨ and to Noise Ratio) < 3 dB.< This provided a clutter field field not contaminated fromfrom moving objects on the Noise Ratio) 3 dB.deletion This deletion provided a clutter not contaminated moving objects on ground or airborne (e.g., birds and aircraft). the ground or airborne (e.g., birds and aircraft). The The three three discriminant discriminant functions functions for for DPDS DPDS clutter clutter detection detection are are defined defined as: as: A. Cross-Correlation Coefficient (ρhv ) hv ) A. Co-Polar Co-Polar Cross-Correlation Coefficient ( Co-polar correlation coefficient coefficient between between H H and and V, V, commonly Co-polar correlation commonly known known as as dual-polarization dual-polarization correlation coefficient for H and V co-polar echoes, is a polarimetric parameter frequently used correlation coefficient for H and V co-polar echoes, is a polarimetric parameter frequently used in in weather radar community, and it is defined [5,13]: thethe weather radar community, and it is defined asas [5,13]: ˇ ˇ
hv1
ρhv1 “ dˇ ˇ
ˇ1 ˇM
ˇ ˇ
M ř
1 Mˇˇ M1 Vh1 pmqV* ˚v1 pmqˇˇ Vm“1 h1 m ˇˇVv1 m M m 1 M M ˇˇ 1 ř ř ˚ ˇˇ Vh1 pmqVh1 pmqˇˇ M
ˇ ˇ
ˇ Vv1 pmqV˚ v1 pmqˇ
m“1 1 M 1 Mm“1 * Vh1 m Vˇh1 m Vv1ˇ m Vv1* m M ˇ1 ř M m 1 M V˚1 pmqˇˇ ˇ V pmqm
ρhv2 “ dˇ ˇ
ˇ1 ˇM
h2
v2 ˇ ˇˇ ˇ M M ˇˇ 1 ř ˇ ř ˇ Vh2 pmqV˚ Vv2 pmqV˚ pmqˇˇˇˇ M v2 pmqˇ h2 M
ˇM
m“1
0 ď m ď M´1
0 m M 1
(1)
(1)
m“1 1 * V m V h2 v2 m M where V represents the complex echo m 1 signal sample received from h (v) as the horizontally (vertically) 2 polarizedhvecho samples m signifies the echo sample number; M from the first or second 1 1 M scan; subscript * * m V m V m V m and M is the number of V samples in a dwell time (i.e., the time used h 2 v2 v 2 to make estimates of polarimetric h2 M M m 1 m 1 variables and spectral moments). m“1
where V represents the complex echo signal sample received from h (v) as the horizontally (vertically) polarized echo samples from the first or second scan; subscript m signifies the echo
sample number; and M is the number of samples in a dwell time (i.e., the time used to make estimates of polarimetric variables and spectral moments). Reliable ground truth is an important issue to evaluate the performance of clutter detectors [7,8]. To 2016, obtain Atmosphere 7, 83 the class label of each resolution volume for obtaining the training data4 and of 11 discriminant PDFs, CMD has been used as suggested by [9]. Although the performance of the CMD algorithm is entirely acceptable for our controlled training data, all PDFs were double-checked and Reliable ground truth is an important issue to evaluate the performance of clutter detectors [7,8]. modified by our DPDS algorithm. To obtain the class label of each resolution volume for obtaining the training data and discriminant The following are the three classes of echoes being considered: PDFs, CMD has been used as suggested by [9]. Although the performance of the CMD algorithm is 1. acceptable Clutter (“C”) (narrow bandtraining zero Doppler velocity) entirely for our controlled data, all PDFs were double-checked and modified by our DPDS algorithm. 2. Narrow-Band Zero Velocity Weather (“W0”) (i.e., vr ≤ 2 m·s−1 and v ≤ 2 m·s−1 The following are the three classes of echoes being considered: 3. Non-Zero Velocity Weather (“W”) (i.e., vr > 2 m·s−1 and v > 2 m·s−1) 1. Clutter (“C”) (narrow band zero Doppler velocity) vr and Zero where the mean Doppler velocity spectrum width 2. Narrow-Band Velocity Weather (“W0 ”) (i.e., |vr | ďand 2 m¨the s´1 and σv ď 2 m¨ s´1 of weather, v are 1 and σ > 2 m¨ s´1 ) | > 2 m¨ s´weather 3. Non-Zero Velocity (“W”) respectively [4,5,8]. We Weather considered W0(i.e., as |v a rseparate v class because their properties are mostly similar to clutter signals, and thus are the most challenging to distinguish. Weather signals where mean Doppler velocity spectrumand width weather, respectively [4,5,8]. r | and σfrom v are the W0 are|vechoes resolution volumes whereand thethe turbulence theofmean wind radial shear are We considered W as a separate weather class because their properties are mostly similar to clutter 0 radial velocity close to zero; thus, these weather signals commonly have a longer weak, with a mean signals, and thus are the most challenging to distinguish. Weather signals W0 are echoes from resolution correlation time compared with the other weather signals (i.e., W). volumes where thecturbulence and the mean wind radial shear are weak, with a mean radial velocity arethus, two these correlation coefficient between Hhave and V polarization, based on the two scans,with i.e., closeThere to zero; weather signals commonly a longer correlation time τc compared hv1other hv 2 . We hvW).as the average of hv1 and hv 2 , because the PDFs are almost the andweather used(i.e., the signals same.There are two correlation coefficient between H and V polarization, based on the two scans, i.e., ρhv1 and Weused ρhv as the average of ρhv1 and ρhv2 , because the PDFs are almost the same. hv2 .of The ρpdf hv is shown in Figure 2. It can be seen from this figure that hv values for both The pdf of ρhv is shown in Figure 2. It can be seen from this figure that ρhv values for both clutter clutter and weather are mostly close one. However, theforground has larger much hv for ground and weather signalssignals are mostly close to one.toHowever, the ρhv clutter clutter has much spreadspread values compared with weather signals. It shouldItbeshould noted be thatnoted the clutter pdfclutter of ρhv pdf depends larger values compared with weather signals. that the of on hv the characteristics of scatterers and antenna rotation, and can be easily updated, based on the weather depends on the characteristics of scatterers and antenna rotation, and can be easily updated, based condition, radarcondition, and antenna rotation. on the weather radar and antenna rotation.
Figure 2. Co-polar cross-correlation coefficient ( hv ). Figure 2. Co-polar cross-correlation coefficient (ρhv ).
Atmosphere 2016, 7, 83
B.
5 of 12
Dual-Scan Cross-Correlation Coefficient
Dual-scan cross-correlation coefficient between two-time series from the same location but from 5 of 11 consecutive scans is defined as [5,15,16]: Atmosphere 2016, 7, 83
1 M M m 1
B. Dual-Scan Cross-Correlation Coefficient V
h1
m Vh*2 m
12h cross-correlation coefficient between two-time series from the same location but from Dual-scan M 1 M consecutive scans is 1defined as [5,15,16]: * *
V m ˇ V m
M m 1
ρ12h “ dˇ ˇ1 ˇ ˇM
12v
h1
h1
V m V m h2
h2
M m 1 ˇˇ M ˇ1 ř ˇ ˇ V m p qV˚ h1 M ˇ h2 pmqˇ m“1 ˇˇ ˇ M M ˇˇ 1 ř ˇ ř ˚ ˇˇ ˇ MqV˚ Vh1 pm m V m V m p q p q p q h2 M ˇˇ ˇ h1 h2
m“1
1 * Vv2 m Vv1 m m“1 Mˇ m 1 ˇ
0 ď m ď M´1
M ˇ ˇ1 ř ˇ Vv1 pmqV˚ pmqˇˇ M v2M ˇM 1 1 * * ρ12v “ dˇV m Vm“1 ˇˇ Vv2 m Vˇˇv2 M M v1 m ˇˇ ˇ 1 v1ř ř ˚ ˚ 1 ˇ ˇ ˇ ˇ M m 1ˇ M Vv1 pmqVv1 pmqˇˇM 1 v2 pmqVv2 pmqˇ M m V
m“1
0 m M 1
(2) (2)
m
m“1
This cross-correlation can be calculated for both h and v polarizations. Thus, there are two This cross-correlation can be calculated for both h and v polarizations. Thus, there are two 12hρ and v , their discriminants, andρ 12 used asaverage the average of and due to their 12h and v , and discriminants, ρ12h wewe used ρ12 as12the of ρ12h having 12v , and 12v , due12to having mostly the same PDFs. mostly the same PDFs. be larger for ground clutter than weather signals [4,5,12], because It is is expected expectedthat thatρ12should 12 should be larger for ground clutter than weather signals [4,5,12], ground clutter has a longer correlation time thantime weather signals, as shownasinshown Figurein3.Figure 3. because ground clutter has a longer correlation than weather signals,
Figure 3. Dual-scan cross-correlation coefficient ( 12 v ). Figure 3. Dual-scan cross-correlation coefficient (ρ12v ).
Figure 4 illustrates the joint pdf between dual-scan cross-correlation and dual-polarization Figure 4 illustrates the joint pdf between dual-scan cross-correlation and dual-polarization cross-co-polar correlation, for two different SNR threshold values. As expected, the weather signals cross-co-polar correlation, for two different SNR threshold values. As expected, the weather signals 12 with have larger ρ hvwith with smaller the clutter has larger values withrange a wide 12 . Additionally, have larger smaller ρ12 .Additionally, the clutter has larger ρ12 values a wide of hv ρ . Thus, it can be clearly concluded that the joint pdf of clutter and weather signals are thoroughly range of hv . Thus, it can be clearly concluded that the joint pdf of clutter and weather signals are hv separated in terms of this discriminant function. Therefore, this discriminant function can undoubtedly thoroughly separated in terms of this discriminant function. Therefore, this discriminant function reduce the error detection and improve the probability of detection compared to previous common algorithms. As can be seen from this figure, the SNR threshold value may change the joint PDFs, but the performance of the DPDS algorithm is not sensitive to SNR, because the overlapped areas
Atmosphere 2016, 7, 83
6 of 12
can undoubtedly reduce the error detection and improve the probability of detection compared to algorithms. As can be seen from this figure, the SNR threshold value may change 6 of 11 the joint PDFs, but the performance of the DPDS algorithm is not sensitive to SNR, because the overlapped areas between clutter and weather do not change with SNR. Other discriminants can be between clutter weather doby notusing change with SNR. Other discriminants canantennas be considered for future considered forand future works cross-correlation between multiple and exploiting works by using cross-correlation between multiple antennas and exploiting spatial diversity [17–19]. spatial diversity [17–19]. previous2016, common Atmosphere 7, 83
Figure4.4.Probability Probabilitydensity densityfunction functionof ofdual-scan dual-scan cross-correlation cross-correlation vs. vs. dual-polarization dual-polarization co-polar Figure co-polar cross-correlation, obtained from training data (a) SNR threshold value 20 dB and (b) SNR threshold cross-correlation, obtained from training data (a) SNR threshold value 20 dB and (b) SNR threshold value5 5dB. dB. value
C. Differential Reflectivity (ZDR) C. Differential Reflectivity (ZDR ) Differential reflectivity is the power ratio of horizontal and vertical polarization signals [20], Differential reflectivity is the power ratio of horizontal and vertical polarization signals [20], and is and is defined as: defined as: ¨ˇ ˇ˛ M ˇ 1M ř ˇ ˚ ˇ ˚ 1ˇM Vh pmq*Vh pmqˇˇ ‹ mV “1h m Vh m ‹ ˚ ZDR “ 10log10 (3) ˇ‹ 0 ď m ď M ´ 1 ˚ Mˇˇ m1ř M ˇˇ ‚ ˝ ZDR 10 log10 0 m M 1 (3) ˚ pmq ˇ 1M pmq V V v v 1ˇM ˇ *
“1 m V m v v M mV m 1 The PDFs of differential reflectivity based on the training data are shown in Figure 5. As is normally
expected, the ZDRof values for clutters have a wider range in comparison to weather signals [4,5]. Because we The PDFs differential reflectivity based on the training data are shown in Figure 5. As is conducted two consecutive there two differential reflectivities (i.e., ZDR1 and ZDR2 ); and both normally expected, the ZDRscans, values for are clutters have a wider range in comparison to weather signals of[4,5]. them most likely have the two sameconsecutive PDFs; thus, we used value for ZDR . It can be seen Because we conducted scans, therethe areaveraged two differential reflectivities (i.e., Z DR1 from Figure 5 that both PDFs center near zero, but that clutter has a wide distribution, whereas the and Z 2 ); and both of them most likely have the same PDFs; thus, we used the averaged value for PDF forDR weather signals is narrow. Because the PDF of ZDR for weather is much larger than that of ZDRclutter . It canin be from Figure both PDFs center zero, but that clutter would has a wide the theseen region near zero, 5it that is clear that clutter withnear the near-zero ZDR values most distribution, whereas the PDF for weather signals is narrow. Because the PDF of Z DR for weather is likely be detected as weather instead of clutter. Therefore, in order to decrease the detection error rate, larger than that of the clutter in the region near zero, it is clear that clutter with the near-zero Zmuch DR in the interval within the pair of vertical lines is not considered for clutter detection. ZDR does Z DR values would most likely be detected as weather instead of clutter. Therefore, in order to not contribute as much as the other discriminants. However, from our experience, there is around a decrease the detection error rate, ZDR in the interval within the pair of vertical lines is not considered 3%–5% performance improvement for PD when we use ZDR as a discriminant. for clutter detection. ZDR does not contribute as much as the other discriminants. However, from our experience, there is around a 3%–5% performance improvement for PD when we use ZDR as a discriminant.
Atmosphere 2016, 7, 83
7 of 11
Atmosphere 2016, 7, 83
7 of 12
Figure 5. Probability density function (PDF) of differential reflectivity (ZDR) for C, W, W0, (i.e.,
Figure 5. Probability density function (PDF) of differential reflectivity (ZDR ) for C, W, W0, P(Z DR | ωi ) given ω = C, W0, and W), obtained from the training data. (i.e., PpZDR |ωi q given ωi = C,i W0 , and W), obtained from the training data. 3. Bayes Optimal Decision
3. Bayes Optimal Decision
After the PDFs are obtained from training data, they will be used as a reference for the optimal
After the PDFs are to obtained from training will and be used a reference for the Bayesian classifier make decisions on testingdata, data.they The PDFs three as types of radar echoes areoptimal shown in Figures 4 and 5. The three discriminants of testing data are calculated from Equations (1)– Bayesian classifier to make decisions on testing data. The PDFs and three types of radar echoes are (3)Figures for each 4gate, observational discriminant vector X° =are (ZDR , hv , 12from ). shown in andto5.form Thethe three discriminants of testing data calculated Equations (1)–(3) Given an observation of the discriminants (X°), the classifier that X = X° belongs to for each gate, to form the observational discriminant vector X ˝ =will (Zidentify , ρ , ρ ). DR hv 12 ˝ ˝ belongs to [C, W0,will ωi , if and only ωi |X°) > p ( ω j |X°) the class if p( discriminants forthe i, j classifier W], jidentify ≠ i. According to = theXBayes Given an observation of the (X ), that X ˝ ˝ the class ωi , if and only if p(ωthi |X ) > p (ω j |X ) for i, j P [C, W0 , W], j ‰ i. According to the Bayes rule, rule, the probability of i class given the observed X°, can be calculated as [21]: the probability of ith class given the observed X ˝ , can be calculated as [21]:
p( X = X O | ωi ) p(ωi ) p(ωi | X = X O ) ppX “ XO ˇˇω qppω p( X = Xi O ) i q ppω |X “ XO q “ i
ppX “ XO q
(4)
(4)
1 . A priori probabilities are assumed to be equal for all classes, i.e., p pCq “ p pW0 q “ p3pWq “ 31 . A priori probabilities are assumed to be equal for all classes, i.e.,
p C p W0 p W
Furthermore, X°)the is the same forall allclasses, classes, Equation (4)(4) cancan be rewritten as: as: Furthermore, as p(Xas=p(X X ˝=) is same for Equation be rewritten
p(ωi ˇˇ| X = X O ) K p( X = X Oˇˇ | ωi ) ppωi ˇX “ XO q “ K ppX “ XO ˇωi q
(5)
(5)
where K is constant for all classes.
where K is constant for all classes.
1 K 1 K “ 3 p( X = XOO ) 3ppX “ X q
O Therefore, ˇ p(ω | X = X ) is proportional to the likelihood function of classes with respect Therefore, ppωi ˇX “i XO q is proportional to the likelihood function of classes with respect to ˇ O pˇ(ω Xi q=. X ωi ) . The likelihood X =ppX X°, “ i.e.,XO function be obtained from trainingdata datafor for all all classes X = X ˝ , to i.e., The| likelihood function can becan obtained from training by using PDFs that are shown in4Figures and 5.we Thus we have: by usingclasses the PDFs thatthe are shown in Figures and 5.4Thus have:
p( X Xˇˇ O | ωi ) ´p hvO , O12Oˇˇ | ωi¯ p ´ZDR O O| ωˇˇ i ¯ ppX “ XO ˇωi q “ p ρO hv , ρ12 ˇωi p ZDR ˇωi
(6)
(6)
ˇ Therefore, ppX “ XO ˇωi q is calculated for all classes, and the class corresponding to the maximum probability value will be selected as the classification decision. Thus, we can infer that Bayesian classifier assigns X = X ˝ to “C” only if ppX “ X ˝ |Cq ą ppX “ X ˝ |W0 q and ppX “ X ˝ |Cq ą ppX “ X ˝ |Wq
Atmosphere 2016, 7, 83
8 of 11
The DPDS algorithm is summarized in the following steps: 1. 2. 3.
Calculate SNR for current gate. If SNR < 20 dB, the current gate is considered not to have a significant weather signal and we compute SNR for the next range gate. Otherwise, go to step 2. Compute the three observed discriminant functions for the current gate, and calculate ˇ ˇ ˇ ppX “ XO ˇC q , ppX “ XO ˇW0 q , and ppX “ XO ˇWq using Equation (6). ˇ ˇ ˇ ˇ If ppX “ XO ˇCq ą ppX “ XO ˇW0 q and ppX “ XO ˇCq ą ppX “ XO ˇWq for the current gate, the data is clutter-contaminated. Otherwise, the data is not contaminated and we return to step 1) for the next gate.
4. Performance Evaluations of DPDS In this section, the performance of the DPDS algorithm is evaluated using the testing control data sets collected by the KOUN (WSR-88D) radar at 13:07, 13:08 and 14:02 UTC on 9 February 2011, and 00:46 UTC on 4 February 2011 with two scans at the same elevation angle. The same procedure has been used to obtain the ground truth, from the combination of pure clutter and pure weather data for the controlled testing data sets. Therefore, the ground truth will be used as a reference for the clutter detection algorithms. The ground truth can also be used to find the clutter to noise ratio (CSR). By changing the CSR, we can compare the performances of detection algorithms. We will compare the DPDS algorithm to previous clutter detection algorithms, such as DP, DS, CMD, presented in [8,12,13]. Figure 6 shows the statistical characteristics of our testing data for DPDS.
Figure 6. Pure weather signals (13:08 UTC on 9 February 2011) mixed with pure ground clutter (00:46 UTC on 4 February 2011). (a) Dual-scan cross-correlation coefficient; (b) dual-polarization co-polar cross-correlation coefficient; (c) differential reflectivity; (d) ground truth clutter map.
To evaluate the performance of DPDS, the numbers of true positives (TP), false negatives (FN), false positives (FP), and true negatives (TN), as well as probability of detection PD , and probability of
Atmosphere 2016, 7, 83
9 of 11
false alarm PFA are calculated. “True” or “False” stand for truly or falsely detected by the algorithm, and “Positive” or “Negative” stand for the clutter decision made by the algorithm. The probability of detection and false alarm (i.e., PD and PFA ) are generally calculated as: PD “
TP FP , PFA “ TP ` FN FP ` TN
Figure 7 illustrates the probability of detection (PD ) versus clutter to signal ratio for DPDS, DP, DS, and CMD algorithms. It is clear PD rate should increase with increasing clutter power or CSR. All radars do not have ability to collect dual scan data. However, the same procedure can be implemented to detect clutter using other discriminants such as power ratio (PR—defined as the ratio between coherent and incoherent power). As shown in Figure 7, there is still significant improvement in PD using the proposed clutter detection procedure over that of CMD. Figure 8, illustrates the clutter map of the ground truth along with CSR, and clutter maps of DPDS, DP, DS, and CMD algorithms. As can be seen from this figure, the DPDS is most similar to ground truth in comparison to other algorithms. Additionally, it was shown in Figure 7 that the difference between PD of DPDS and other detection algorithms increased with decreasing CSR. Therefore, the DPDS improvement gain is clearly observable in the resolution of the clutter map, in Figure 8, especially for the low values of CSR. It also can be seen from Figure 8 that for high CSR values, DPDS algorithm has better performance in comparison to DP, DS, and CMD algorithms, respectively. In Table 1, we list the probability of false alarm (PFA ) for the three controlled testing data sets, collected by KOUN at 13:07, 13:08 and 14:02 UTC on 9 February 2011. From Table 1, we can see that all four algorithms produce low PFA , the reason is that there are too many weather signal pixels. This table shows that DPDS algorithm produces the lowest PFA with the highest PD . Table 1. PFA for three testing data by using the DPDS, DP, DS, and CMD algorithms. Data-Time, UTC
CMD
DS
DP
DPDS
13:08 13:07 14:02
0.7770% 0.5525% 0.6346%
0.3387% 0.2130% 0.2363%
0.4782% 0.3195% 0.3443%
0.00% 0.00% 0.00%
Atmosphere 2016, 7, 83
10 of 12
PDD))vs. Figure vs.Clutter Clutterto toSignal SignalRatio Ratio(CSR). (CSR). Figure 7. 7. Probability Probability of of Detection Detection ((P
Atmosphere 2016, 7, 83
Figure 7. Probability of Detection ( PD ) vs. Clutter to Signal Ratio (CSR).
10 of 11
Figure 8.8.Clutter andGround Groundtruth truthwith withCSR. CSR. Figure Cluttermaps mapsusing: using:DPDS, DPDS, DP, DP,DS, DS, and and CMD CMD algorithms, algorithms, and
5. Conclusions Table 1.
PFA
for three testing data by using the DPDS, DP, DS, and CMD algorithms.
In the proposedData-Time, DPDS clutter detection algorithm, and dual-scan (DPDS) UTC CMD DSa dual-polarization DP DPDS weather radar improves 13:08 detection of clutter from weather signals with minimum error rates. 0.7770% 0.3387% 0.4782% 0.00% Cross-correlation and auto-correlation between two scans of dual-polarization 13:07 0.5525% 0.2130% 0.3195% 0.00%radar signs have been jointly combined to form exceptional discriminant PDFs of 0.00% discriminants may change 14:02 0.6346% functions. 0.2363% The 0.3443% and may need to be updated based on the weather, clutter, and antenna rotation, but the procedure of detecting clutter is the same. Proposing a thorough clutter detection method for various conditions 5. Conclusions and precipitations will still serve as a motivator for future works. A well-known Bayesian classifier In the proposed DPDS clutter detection algorithm, a dual-polarization and dual-scan (DPDS) has been defined to make an optimal decision for clutter detection, based on discriminant functions. weather radar improves detection of clutter from weather signals with minimum error rates. Practical control data sets have verified the performance improvement of our proposed DPDS algorithm Cross-correlation and auto-correlation between two scans of dual-polarization radar signs have been compared with DP, DS, and CMD algorithms. The statistical and physical characteristics obtained jointly combined to form exceptional discriminant functions. The PDFs of discriminants may change from dual-polarization weather radars can be generalized to detect other objects instead of just clutter. and may need to be updated based on the weather, clutter, and antenna rotation, but the procedure Acknowledgments: This work was supported by the National Oceanic and Atmospheric Administration under Grant NA11OAR4320072. The data were collected with KOUN radar by NSSL engineers. Author Contributions: The authors contribute equally to this paper. Conflicts of Interest: The authors declare no conflict of interest.
References 1. 2.
3.
Groginsky, H.L.; Glover, K.M. Weather radar canceller design. In Proceedings of the 19th Conference on Radar Meteorology of the American Meteorological Society, Miami Beach, FL, USA, 15–18 April 1980. Cao, Q.; Zhang, G.; Palmer, R.D.; Knight, M.; May, R.; Stafford, R.J. Spectrum-Time Estimation and Processing (STEP) for Improving Weather Radar Data Quality. IEEE Trans. Geosci. Remote Sens. 2012, 50, 4670–4683. [CrossRef] Siggia, A.D.; Passarelli, R.E. Gaussian model adaptive processing (GMAP) for improved ground clutter cancellation and moment calculation. In Proceedings of the Third European Conference on Radar in Meteorology and Hydrology, Visby, Sweden, 6–10 September 2014.
Atmosphere 2016, 7, 83
4. 5. 6. 7. 8. 9.
10. 11. 12. 13. 14.
15.
16. 17. 18. 19.
20. 21.
11 of 11
Doviak, R.J.; Zrnic, D.S. Doppler Radar & Weather Observations, 2nd ed.; Dover: New York, NY, USA, 2006; p. 562. Zhang, G. Weather Radar Polarimetry; CRC Press: Boca Raton, FL, USA, 2016. Meischner, P. Weather Radar Principles and Advanced Applications; Springer-Verlag: Berlin, Germany, 2002. Hubbert, J.C.; Dixon, M.; Ellis, S.M.; Meymaris, G. Weather Radar Ground Clutter. Part I: Identification, Modeling, and Simulation. J. Atmos. Ocean. Technol. 2009, 26, 1165–1180. [CrossRef] Hubbert, J.C.; Dixon, M.; Ellis, S.M.; Meymaris, G. Weather Radar Ground Clutter. Part II: Real-Time Identification and Filtering. J. Atmos. Ocean. Technol. 2009, 26, 1181–1197. [CrossRef] Ice, R.L.; Wyle Information Systems; Norman, O.K.; Rhoton, R.D.; Krause, J.C.; Saxion, D.S.; Boydstun, O.E.; Heck, A.K.; Chrisman, J.N.; Berkowitz, D.S.; et al. Automatic clutter mitigation in the WSR-88D, design, evaluation, and implementation. In Proceedings of the 34th Conference on Radar Meteorology, Williamsburg, VA, USA, 5–9 October 2009; p. 5.3. Yinguang, L.; Guifu, Z.; Doviak, R.J. A new approach to detect the ground clutter mixed with weather echoes. In IEEE Radar Conference (RADAR), Kansas City, MO, USA, 23–27 May 2011. Li, Y.; Zhang, G.; Doviak, R.J.; Lei, L.; Cao, Q. A New Approach to Detect Ground Clutter Mixed with Weather Signals. IEEE Trans. Geosci. Remote Sens. 2013, 51, 2373–2387. [CrossRef] Li, Y.; Zhang, G.; Doviak, R.J.; Saxion, D.S. Scan-to-Scan Correlation of Weather Radar Signals to Identify Ground Clutter. IEEE Geosci. Remote Sens. Lett. 2013, 10, 855–859. [CrossRef] Zhang, G.; Doviak, R.J. Ground Clutter Detection Using the Statistical Properties of Signals Received with a Polarimetric Radar. IEEE Trans. Signal Process. 2014, 62, 597–606. OFCM. Doppler Radar Meteorological Observations, Part III—WSR-88D Products and Algorithms. FEDERAL METEOROLOGICAL HANDBOOK NO. 11; FCM-H11C-2006. Federal Coordinator for Meteorological Services and Supporting Research: Washington, DC, USA, April 2006. Available online: http://www.ofcm.gov/fmh11/ fmh11partc/pdf/FMH-11-PartC-April2006.pdf (accessed on 10 November 2015). Lei, L.; Zhang, G.; Doviak, R.J.; Palmer, R.; Cheong, B.L.; Xue, M.; Cao, Q.; Li, Y. Multilag Correlation Estimators for Polarimetric Radar Measurements in the Presence of Noise. J. Atmos. Ocean. Technol. 2012, 29, 772–795. [CrossRef] Melnikov, V.M.; Zrnic, D.S. Autocorrelation and cross-correlation estimators of polarimetric variables. J. Atmos. Ocean. Technol. 2007, 24, 1337–1350. [CrossRef] Golbon-Haghighi, M.-H.; Mahboobi, B.; Ardebilipour, M. Linear Pre-coding in MIMO–CDMA Relay Networks. Wirel. Pers. Commun. 2014, 79, 1321–1341. [CrossRef] Golbon-Haghighi, M.-H.; Mahboobi, B.; Ardebilipour, M. Multiple Antenna Relay Beamforming for Wireless Peer to Peer Communications. J. Inf. Syst. Telecommun. 2013, 1, 209–215. Golbon-Haghighi, M.-H.; Shirazi, M.; Mahboobi, B.; Ardebilipour, M. Optimal Beamforming in Wireless Multiuser MIMO-relay Networks. In Proceedings of the 21st Iranian Conference on Electrical Engineering (ICEE), Mashhad, Iran, 14–16 May 2013; pp. 1–5. Qing, C.; Yeary, M.B.; Zhang, G. Efficient Ways to Learn Weather Radar Polarimetry. IEEE Trans. Educ. 2012, 55, 58–68. [CrossRef] Papoulis, A. Probability, Random Variables, and Stochastic Processes; Mcgraw-Hill Incorporated: New York City, NY, USA, 1991. © 2016 by the authors; licensee MDPI, Basel, Switzerland. This article is an open access article distributed under the terms and conditions of the Creative Commons Attribution (CC-BY) license (http://creativecommons.org/licenses/by/4.0/).