J. Europ. Opt. Soc. Rap. Public. 7, 12047 (2012)
www.jeos.org
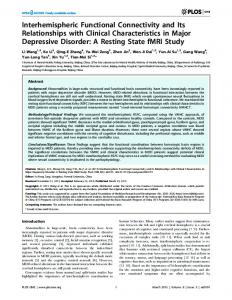
Detection of inter-hemispheric functional connectivity in motor cortex with coherence analysis V. P. Varshney N. Liapounova
Department of Radiology and Experimental Imaging Centre, University of Calgary, Calgary, AB, Canada Department of Radiology and Experimental Imaging Centre, University of Calgary, Calgary, AB, Canada
A.-M. Golestani
Seaman Family MR Research Centre, Calgary, AB, Canada Department of Electrical & Computer Engineering, University of Calgary, Calgary, AB, Canada
B. Goodyear
Seaman Family MR Research Centre, Calgary, AB, Canada Department of Radiology and Hotchkiss Brain Institute, University of Calgary, Calgary, AB, Canada
J. F. Dunn
Department of Radiology; Experimental Imaging Centre, and Hotchkiss Brain Institute, University of Calgary, Calgary, AB, Canada
[email protected]
Functional near-infrared spectroscopy (fNIRS) is showing promise as an alternate method to fMRI for studying cortical function. Resting state studies in both methods are showing functional linkages. The strength of functional connections is typically quantified by the level of significance of the temporal synchrony between brain regions, termed resting-state functional connectivity. Coherence analysis of resting state allows for phase insensitive and frequency specific analysis. This paper provides a detailed method for undertaking fNIRS in combination with resting-state coherence analysis. We show that maps of inter-hemispheric resting-state functional connectivity between the motor cortices can be reliably generated, and the frequency responses (to 50 Hz) for both oxy- and deoxyhemoglobin. Frequencies of 0-0.1 Hz provide robust data as have been shown previously. Higher frequencies (up to 5 Hz) also exhibit high coherence. Deoxyhemoglobin also shows high coherence above 10Hz. Coherence is similar during both resting and task activated states. fNIRS allows for mapping cortical function and, in combination with coherence analysis, allows one to study variations in frequency response. [DOI: http://dx.doi.org/10.2971/jeos.2012.12047] Keywords: Coherence, near-infrared tomography, functional connectivity, optics, brain, coherence analysis
1 INTRODUCTION Imaging of brain function using functional magnetic resonance imaging (fMRI) has greatly advanced our understanding of the link between function and anatomy in the human brain [1, 2]. fMRI is based on the observation that a localized increase in neural activity results in an increase in the venous concentration of oxyhemoglobin relative to deoxyhemoglobin at the active site [2, 3]. Functional near-infrared spectroscopy (fNIRS) is a new method of functional neuroimaging that can map cortical function by measuring changes in both oxy- and deoxyhemoglobin [4]. Although fNIRS possesses limited spatial resolution and depth penetration relative to fMRI [5], it has obvious advantages including greater portability, lower cost, and greater frequency resolution [4], and improving the depth penetration and quantification of fNIRS continues to be an active area of research and development [6]. As fNIRS systems are now available with mapping capability, it is possible to use fNIRS to study regional variations in cortical function [5, 7]. Historically, fMRI studies have used a repeated “on/off” pattern of task presentation, in order to detect brain regions whose signal intensities, and thus neural activities, are modulated by the task [8]. An alternative and complementary ap-
proach to task-related fMRI has been associated with identifying brain regions that are synchronous in their spontaneous activities in the absence of a task. Such “resting state” fMRI studies typically use a form of temporal cross-correlation analysis to detect this synchrony and, as a result, identify spatially distinct brain regions that comprise a functionally connected network; the strength of the synchrony or correlation has been termed connectivity [9]–[12]. The present study builds on previous studies demonstrating that fNIRS provides a robust method to study connectivity [13]–[15]. In the current study, we detail the methods required for undertaking an fNIRS coherence study including a discussion of seed placement. We also provide additional detail with respect to coherence analysis previously undertaken [16]. A specific advantage of coherence analysis is that it allows one to select frequency ranges for study. We examined the frequency response (0-50 Hz) of inter-hemispheric coherence between the motor cortices, using both oxyhemoglobin and deoxyhemoglobin, and determined if coherence is influenced by motor function. The ability to quantify coherence using fNIRS will permit the
Received June 29, 2012; revised ms. received September 25, 2012; published November 17, 2012
ISSN 1990-2573
J. Europ. Opt. Soc. Rap. Public. 7, 12047 (2012)
V. P. Varshney, et al.
comparison of functional connectivity between subjects, and it will provide exciting new opportunities to study the impact of neurological disease on the functional connections of the brain without any effort required by the patient and using a technology that could be used at a patient’s bedside or in a physician’s office.
2 METHODS Ten right-handed male subjects were recruited (ages 22-52) for this study. Subjects were excluded if there was evidence of a neurological or psychiatric illness, use of antipsychotics, antiepileptics or anxiolytics, and drug or alcohol abuse, based on self-report. Informed consent was obtained from all subjects prior to their participation. The protocol was approved by the Conjoint Health Research Ethics Board of the University of Calgary.
2.1 Continuous wave system and optode placement A continuous wave diffuse optical tomographic mapping system (TechEn, Inc., Milford, MA) was used [17]. Note some now use “tomography” to refer to overlapping sourcedetector pairs and “topography” to the current method [18]. This system has laser diodes for sources and avalanche photodiodes for detectors, and operates at two wavelengths (690 nm and 830 nm). Changes in attenuation at 690 nm are related to deoxyhemoglobin (dHb) and 830 nm to oxyhemoglobin (oxyHb), meaning that light absorption is relatively greater for each chromophore at those wavelengths [4]. Relative changes in chromophore concentration are reported [4, 19, 20]. The delta-dHb and -oxyHb data were calculated using a modified Beer-Lambert law and the differential pathlength. It inputs the delta absorption at both wavelengths and takes into account the extinction coefficient of both chromophores at both wavelengths. The equations can be found in the manual for HomER, the custom software program used to analyze optical data [21]. A custom made head cap was placed over each motor cortex and consisted of a rectangular pattern of 4 detectors, 4 sources and 4 detectors (Figure 1). Each source-detector pair was 2 cm apart. These optodes were placed over the motor cortex of both hemispheres according to the International EEG system of electrode placement [22, 23]. The precentral gyrus was estimated to be 40% of the distance from the top of the nasal cartilage to the base of the skull at the end of the occiput bone. The cap extended from above the earlobe to the sagittal sinus. The pad was held to the head with a Velcro strap and covered with a black cloth, which was also positioned with a Velcro strap (Figure 1). The room lights were off during data acquisition. Optode coupling to the skin was confirmed by detection of heart rate frequencies in the range of 0.8-1.7 Hz. Optical signals were filtered as described previously [17]. Data was filtered to 100 Hz before coherence analysis. When calculating the change in oxyHb or dHb in response to the finger movement task (described below), a low-pass filter was then applied to remove fluctuations in excess of 0.8 Hz due to
FIG. 1 The custom built fNIRS cap. (a) photograph showing the flexible plastic cut to shape and holes made at 2 cm increments. Rubber stoppers with holes in them provided support for the tip to mount it into the plastic, and ‘shock’ absorbance for the comfort of the subject. The Velcro strips were cut to hold each individual wing of the cap, to allow flexibility and more comfortable positioning for the subject. The gaps between the optode rows also allowed one to gently probe beneath the cap, to move hair away from each fiber, thus improving contact with the scalp. (b) a cartoon of the positioning with the optode numbers. X = transmit optode and O = receive optode, Placement of the cap is described in the methods. The circled transmit/receive pair was used as the optimum for pair based on anatomical positioning.
heart rate or respiration. Results were expressed as the change in concentration of the chromophore [24] and were processed using HomER [21].
2.2 Study Paradigm Upon placement of optodes, subjects were asked to rest for 5 minutes for a baseline recording. Data were recorded for resting-state coherence analysis. Subjects then performed a finger movement task, which consisted of 5 minutes of tapping the right index finger to the thumb (self-paced at approximately 1 Hz) for 15 seconds alternating with 30 seconds of rest. A detectable NIR response to tapping also confirmed that the optodes were placed correctly over the motor cortex. The source-detector pair exhibiting the largest change during the task was used as one option for defining the ‘seed’ fiber pair for coherence analysis (described below). An alternate choice of seed was based on anatomy. In this case, the head caps were positioned based on the EEG system of electrode placement, making the fiber positions consistent across subjects relative to the anatomy of the skull.
12047- 2
J. Europ. Opt. Soc. Rap. Public. 7, 12047 (2012)
V. P. Varshney, et al.
To generate seed-wise functional connectivity maps, we calculated band-averaged coherence estimates using discrete frequency bands:
ˆ xy ( f ) = Coh
2 ˆ ∑ Pxy ( f ) f ∑ Pˆxx ( f ) ∑ Pˆyy ( f ) f
(5)
f
3 RESULTS
FIG. 2 Responses of hemoglobin saturation to finger tapping in the motor cortex, based on source-detector pairs showing significant activation in response to tapping as statistically determined by HomER software. Calculated changes in oxyHb, dHb and tHb are shown. The duration of finger tapping is defined by the red bar. Points are averaged from sixty tapping periods in the contralateral hemisphere to the tapping hand. Time series data were averaged to obtain 2 Hz bins of data (mean±SE, n=10 subjects).
2.3 Coherence analysis Coherence estimates the linear time-invariant (LTI) relationship between time series x and y, at frequency f. A coherence value of 0.0 indicates there is no linear relationship between the two signals, and 1.0 indicates that there is a complete linear relationship between them. Coherence is defined as the cross-spectral density function, normalized by the auto spectral density functions (i.e., power spectra) [25]: Pxy ( f ) 2
Cohxy ( f ) =
(1)
Pxx ( f ) Pyy ( f )
To estimate coherence, the cross-spectral and power-spectral densities of the 830 nm (i.e., oxyhemoglobin-weighted) peak is first estimated using Welch’s modified periodogram averaging method [26] by dividing signals into 8 segments with 50 percent overlap. Each segment was demeaned and windowed using a Hanning filter. Cross-spectrum is given by Eq. (2): 1 Pˆxy ( f ) = N
N
∑ Xn
(T )
∗( T )
( f )Yn
(f)
(2)
n =1
where Xn(T)(f) is the T-point discrete Fourier transform (DFT) of the windowed and demeaned nth segment of x. Likewise the power-spectrum estimate is given by Eq. (3): 1 Pˆxx ( f ) = N
N
∑ Xn
n =1
(T )
2 ( f )
(3)
Coherence between x and y is then estimated using these estimates of the cross-spectrum and power-spectrum, and is expressed as Eq. (4):
Cohxy ( f ) =
2 ˆ (T ) Pxy ( f ) (T ) (T ) Pˆxx ( f ) Pˆyy ( f )
(4)
The change in optical density at 830 and 690 nm (oxyHb and dHb, respectively) were used to calculate changes in in oxyHb, dHb and tHb during finger tapping (Figure 2). Graphed is the average of trials for 10 subjects. There is a small decrease in dHb after finger tapping commences, which plateaus at about 7 to 8 sec, and decreases further for 4 sec after finger tapping ends, before returning to baseline. The concentrations of oxyHb and tHb undershoot baseline levels reaching a minimum 5-10 sec after finger tapping ends. The maximal estimated change in oxyHb concentration in response to tapping was 3x10⁻⁶ moles/L. These results show a detailed plot of the time course of hemodynamic changes associated with cortical activation. The grouped means for patterns are similar to those observed in individuals in previous studies [22]. The finger tapping was also used to confirm that the optode pads were situated over the motor cortex in both hemispheres. In order to calculate coherence, a seed signal must be identified. We compared the fiber pair that, based on anatomical markers, would be over the motor cortex (Figure 1), with the pair that gave the largest change in signal with finger tapping. In most subjects (7/10) the same fiber pair was identified with anatomy and maximum response. In the remaining 3, we compared the difference in contralateral coherence observed using the 2 different seed locations. In each, the average coherence on the contralateral side was actually somewhat less using the seed of maximum absorption change with finger tapping vs. the anatomically positioned seed. As a result, for this paper, we used the anatomically identified fiber pair as the seed so that the data would be comparable with future studies using anatomy. This has advantages for resting state measurements as it eliminates the need for finger tapping to localize the seed and so shortens the study time. Figure 3 shows example resting state coherence maps from two subjects. A major advantage of the coherence analysis is the ability to isolate data from different frequency bins. Coherence maps from a range of frequencies are shown. Coherence is high on both sides of the brain. Frequencies near 1 Hz showed the highest coherence, but this was attributed to physiological oscillations caused by heart rate which would mask functional activation. There was a strong coherence in frequencies above 10 Hz in the dHb signal. Figure 4 shows histograms of resting-state coherence in the contralateral hemisphere to the seed and the results from resting state and tapping, averaged from all the fiber pairs in the contralateral hemisphere. Both oxyHb and dHb show signif-
12047- 3
J. Europ. Opt. Soc. Rap. Public. 7, 12047 (2012)
V. P. Varshney, et al.
FIG. 3 Maps of the optode pads showing coherence in the left and right motor cortex when the seed (small black dot) was in the right pad as one views the maps. The scale is from 0 (black) to 1 (white) with white areas represent higher coherence. The columns show results from different frequency bins. The rows show results from the oxyHb and dHb analysis from two example subjects. The low frequency data (0-0.1 Hz) shows strong interhemispheric coherence. Frequencies near the heart rate (approximately 1Hz) show the highest coherence. Frequencies above 1 Hz show coherence, declining as frequency increases. The dHb channel still shows high coherence at the 10-50 Hz bin.
icant contralateral coherence. There is no difference in coherence using oxyHb data when comparing the resting state with data during motor activation (finger tapping). In the low frequency bands (0-0.1 Hz) using dHb, there was significantly more coherence in the resting state than during the motor function task. In the 0.1-5 Hz range, oxyHb tends to have higher coherence than dHb. The histograms show clearly that the dHb signal has much higher coherence at high frequencies (10-50 Hz) than does oxyHb. Comparing resting state vs. finger tapping, there are no significant differences in coherence measured using oxyHb data, while there is a reduced coherence in the low frequency data from dHb when finger tapping.
4 DISCUSSION Functional connectivity is a term used to describe regions of the brain that appear to be in close communication based on analysis of time series data of some neurophysiological index. The rise of the concept of functional connectivity has led to the study of linked frequency responses measured by MRI, EEG and near-infrared spectroscopy [10, 11, 27]. The detection of changes in activation of brain with fMRI is largely based on changes in deoxyhemoglobin [2]. Near infrared spectroscopy is capable of detecting changes in both oxyhemoglobin and deoxyhemoglobin, and so provides an alternative method to fMRI for the study of brain activation [27]. fNIRS is relatively inexpensive, can detect higher frequencies than MRI and can be used for cortical surface mapping [20, 27]. fNIRS is limited in depth penetration however, making it necessary to validate the experimental setup to ensure that cortical function is being detected. The time course of hemodynamic changes with finger tapping, measured in the motor cortex, follows the expected time course of hemodynamic changes associated with finger tapping [9, 28]. In this case, even the post-activation undershoot in dHb can be clearly seen, as has been observed with fMRI
and modeled previously [6]. The relatively large changes in oxyHb and tHb compared with dHb indicate that, if one were only looking for regions of task activation, these parameters may provide higher sensitivity compared with dHb. The correlation method of analysis is often applied to the study of time series analysis of functional magnitude-time data [14, 15]. The coherence method used in this paper, modified after Sasai et al. [16], analyzes magnitude frequency data after performing the Fourier transform. One advantage is that the dataset is not filtered to a limited frequency range. The coherence method is often used in EEG analysis, where it is important to maintain frequency information. It was introduced to study functional connectivity using fMRI [29]. The high frequency range of fNIRS, combined with the coherence analysis, allowed us to study the frequencies related to functional connectivity in the motor cortex [14, 30]. The choice of a seed, or reference frequency, may influence the resulting coherence. We assessed an anatomic landmark based on the EEG standard for electrode placement (see Methods), as well as a functional landmark based on the fiber pair with the highest change in absorption during contralateral motor activation. Both gave similar results. This indicates that, for studies of resting state coherence, it would be possible to use an anatomic position, which would eliminate the need for finger tapping and greatly shorten the study time. There may be study designs that require a task, where a correlation or coherence analysis of connectivity is also desired. In order to determine if this type of study design was possible, we compared coherence values obtained within the motor cortex both during task activation and the resting state. There were no significant differences in coherence (Figure 4). This suggests that the communication between regions is somehow necessary for normal function. The highest coherence was found at 1-2 Hz (Figures 3, 4). This
12047- 4
J. Europ. Opt. Soc. Rap. Public. 7, 12047 (2012)
V. P. Varshney, et al.
changes in the cell or mitochondria [31, 32]. A signal with a time frame in milliseconds has been reported [31]–[34]. Gated fNIRS using a similar system to that used in this study also showed a “fast signal” with a latency of approximately 100 ms (10 Hz) [24]. They reported a fast signal of similar amplitudes in the 690 and 830 nm wavelength that is coherent with a finger tapping paradigm. They did not report fast signal in the resting state. An equivalent fast signal was not found in awake macaque monkeys [35]. Fast signals were detected in amphibian retina [36]. A study comparing NIRS with EEG patterns in 11 subjects did observe a fast response [37]. Fast optical signals have also been seen in isolated brain tissue preparation [38]. The bulk of the literature supports the ability of NIRS to detect a fast signal. In our study, there was a fast signal regardless of whether there was motor function. In addition, there was a large difference in the coherence between the channels associated with oxyHb and dHb. If scattering were the main cause, one might expect similar results with the two channels. It will require further work to determine if these changes are due to absorption or scattering. Interestingly, there is a large difference in absorption spectra at approximately 600 nm in cytochrome a/a3 with oxy/reduction state [39], which is fairly close to the 690 nm detection wavelength weighted to dHb in our study.
FIG. 4 Histograms of the magnitude of coherence vs. the analysed frequency. Open bars=rest, closed bars=during tapping. Mean data from all fiber pairs on the contralateral side from the seed. a) oxyHb data, b) dHb data. The highest coherence values occurred in the frequency range of 1-2 Hz for oxyHb, most likely due to heart rate coherence. All frequency ranges between 0-5 Hz resulted in average coherence values at or above 0.5. Frequency ranges above 10 Hz showed no significant coherence in the oxhHb channel, but did show coherence in the dHb channel. (mean±SE, n=10 subjects, * indicates significant different p