method could be useful for detecting the function of respiratory system. Key words: ..... Text book of Respiratory. Medicine. 3rd Edn., Philadelphia: W.B. Saunders, pp: 781-881. 2. ... http://ccjm.org/content/70/10/866.full.pdf+html. 4. Pierce, R.
Journal of Computer Science 4 (8): 663-667, 2008 ISSN 1549-3636 © 2008 Science Publications
Detection of Respiratory Abnormalities Using Artificial Neural Networks 1
Mahdi Jan Baemani, 2Amirhasan Monadjemi and 3Payman Moallem Department of Computer Engineering, Mahshahr Azad University, Mahshahr, Iran 2 Department of Computer Engineering, Faculty of Engineering, University of Isfahan, Isfahan, Iran 3 Department of Electrical Engineering, Faculty of Engineering, University of Isfahan, Isfahan, Iran 1
Abstract: Problem Statement: Lung disease is a major threat to the human health regarding the industrial life, air pollution, smoking, and infections. Lung function tests are often performed using spirometry. Approach: The present study aims at detecting obstructive and restrictive pulmonary abnormalities. Lung function tests are often performed using spirometry. In this study, the data were obtained from 250 volunteers with standard recording protocol in order to detect and classify pulmonary diseases into normal, obstructive and restrictive. Firstly, spirometric data was statistically analyzed concerning its significance for neural networks. Then, such parameters were presented as input to MLP and recurrent networks. Results: These two networks detected normal and abnormal disorders as well as obstructive and restrictive patterns, respectively. Moreover, the output data was confirmed by measuring accuracy and sensitivity. Conclusion: The results show that the proposed method could be useful for detecting the function of respiratory system. Key words: Spirometry, obstructive disorders, restrictive disorders, normal patterns, artificial neural networks INTRODUCTION
respiratory maneuvers. It allows one to determine how much air can be inhaled and exhaled, and how fast[1,3] . Accurate measurement of respiratory function is necessary to assess and manage different pulmonary abnormalities[2,4]. The following parameters are measured using spirometer: Vital Capacity (VC), Forced Vital Capacity (FVC), Forced Expiratory Volume at 1st second (FEV1), ratio of FEV1 to FVC (FEV1%), Peak Expiratory Flow (PEF) and Forced Expiratory Flow 25-75% (FEF 25-75)[3]. In the present study, the ratio of FEV1 to VC was computed too. Spirometry depends on such factors as age, height, weight, and gender of subjects[1,3,5]. The complexity of outputs of spirometer and the close relationship between respiratory patterns (obstructive, restrictive, and normal) necessitates the use of intelligent systems in the interpretation of the test results. Restrictive lung diseases are characterized by reduced lung volume, either because of an alteration in lung parenchyma or because of a disease of the pleura, chest wall, or neuromuscular apparatus. In physiological terms, restrictive lung diseases are characterized by reduced Total Lung Capacity (TLC), vital capacity, or resting lung volume[4,6]. The obstructive condition is characterized by progressive airflow obstruction of the peripheral airways, associated with lung inflammation, emphysema and mucus hyper
Nowadays, lung diseases are one of the most serious threats to the human health. Some phenomenon such as air pollution various infections, and smoking habit have recently increased its risk factors drastically. Lung function tests are ordered by physicians mostly in order to: • To evaluate symptoms and signs of lung disease (e.g., cough, dyspnea, cyanosis, wheezing, hyperinflation, hypoxemia, hypercapnia) • To assess the progression of lung diseases • To monitor the effectiveness of therapy • To evaluate preoperative patients in selected situations • To screen people at risk of pulmonary diseases such as smokers or people with occupational exposure to toxic substances in occupational surveys. • To monitor for the potentially toxic effects of certain drugs or chemicals (e.g., amiodarone, beryllium)[1,2] Lung function tests are often performed using spirometry. Spirometry is the measurement of the air moving in and out of the lungs during various
Corresponding Author: Mahdi Jan Baemani, Department of Computer Engineering, Mahshahr Azad University, Iran
663
J. Computer Sci., 4 (8): 663-667, 2008 secretion. Cessation of cigarette smoking is accompanied by a reduction in decline in lung function and is one of the most important aspects of obstructive management[7]. Systemic effects of obstructive disease include weight loss, nutritional abnormalities, musculoskeletal dysfunction and osteoporosis each of which contributes to the symptoms, morbidity, and probably the mortality of Chronic Obstructive Pulmonary Disease (COPD)[5-8]. Restrictive and obstructive patterns have four different levels:
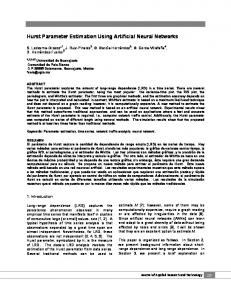
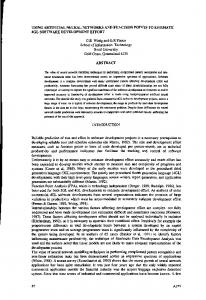
The biological neural network (i.e. the brain) is the original inspiration for artificial neural networks. In human nervous system, learning occurs by changing the effectiveness of the synapses. Just like the brain, an artificial neural network can be trained using samples. ANNs have the ability of processing inputs to obtain an output; if the given response does not yield the desired result, then the neuron's weights are corrected during the learning or training process. This correction generally occurs by sequentially applying input values to the ANN while making weight adjustments until a minimal error is achieved[7,9]. The feed forward neural network was the first and arguably simplest type of artificial neural network devised. In this network, the information moves in only one direction, forward, from the input nodes, through the hidden nodes (if any) and to the output nodes. There are no cycles or loops in the network. Multilayer Perceptron Neural Networks (MLPNNs), shown in Fig. 2, constitute one of the most popular feed forward neural networks[10]. MLPNNs have features such as the ability to learn and generalize, smaller training set requirements, fast operation, ease of implementation and therefore are the most commonly used neural network architectures[8,11]. Contrary to feed forward networks, Recurrent Neural networks (RNs) are models with bi-directional data flow. While a feed forward network propagates data linearly from input to output, RNs also propagate data from later processing stages to earlier stages. In this study, a recurrent network called Elman was used. Elman neural network has a backward connection between the hidden and context layers. This feedback path allows it to learn temporal and spatial patterns of input data. Thus Elman neural network has certain dynamic characteristics over the feed forward neural network. On the other hand, the memory nodes and feedback connections increase its computational complexity[12]. In 2007, Mahesh Veezhinathan and Swaminathan Ramakrishnan carried out a study to detect obstructive respiratory abnormalities using Radial Basis Function artificial networks in which the results showed that the proposed method is useful for classifying the pulmonary functions into normal and obstructive conditions[13]. After a while and in a more recent study, they developed another research for the classification and detection of restrictive respiratory abnormalities by means of artificial neural networks. In this study, it was revealed that artificial neural networks could be used
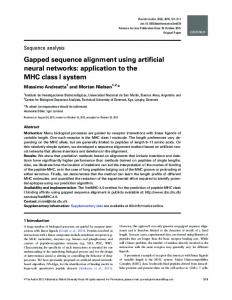
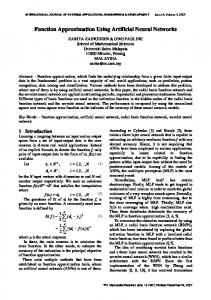
Fig. 1: Volume-time curve and flow-volume curve of three patterns[3] • • • •
Mild Moderate Severely moderate Severe
Figure 1 shows volume-time curve and flowvolume curve of three patterns.
Fig. 2: Multilayer Perceptron neural network topology 664
J. Computer Sci., 4 (8): 663-667, 2008 for the detection of normal and restrictive patterns of pulmonary diseases[14]. The above-mentioned studies were carried out focusing on two out of three patterns of respiratory abnormalities; however, in this study all three patterns of respiratory abnormalities are taken into consideration. Since combined neural network models often result in a prediction accuracy that is higher than that of the individual models, the present article aims at detecting mild restrictive, mild obstructive and normal patterns of respiratory abnormalities by means of a combined set of neural networks as well as the data gathered from spirometer. Mild levels of obstructive and restrictive patterns of pulmonary diseases are almost similar to normal patterns; hence, their early diagnosis is of importance since early diagnosis of mild respiratory diseases by means of neural networks may prevent the spread of pulmonary diseases to a critical phase thus may be of utmost importance in medical contexts.
More accurate results emerge by using more than one neural network. In other words, when a problem is investigated by means of a number of neural networks, the final result is more reliable and suffers less error since malfunctioning of a network may be compensated by other networks and also each network receives inputs different from that of others and thus may yield more accurate results[10,13,14,15,17,19]. Data were divided into two groups (train and test) randomly. In order to train a neural network model appropriately, the samples must be selected carefully in order to represent the whole subjects under investigation. In this study, 200 samples were used to train the network and another 50 samples were used to test it. Furthermore, making an informed decision on Table 1: Variables in the step wise discriminant analysis Sig. to f Step Tolerance to remove 1 FEV1% 1 0 2 FEV1% 0.786 0 FEF25-27 0.786 0 0.376 3 FEV1% 0.756 0 FEF25-27 0.767 0 0.359 PEF 0.957 0 0.293 4 FEV1% 0.626 0 FEF25-27 0.75 0 0.336 PEF 0.956 0 0.274 FEV1 0.719 0 0.273 5 FEV1% 0.031 0 FEF25-27 0.726 0 0.25 PEF 0.956 0 0.198 FEV1 0.029 0 0.266 FVC 0.031 0 0.256 6 FEV1% 0.031 0 FEF25-27 0.726 0 0.234 PEF 0.956 0.001 0.187 FEV1 0.027 0 0.261 FVC 0.031 0 0.246 FEV1/VC 0.639 0.002 0.185
MATERIALS AND METHODS For the present study, 250 (134 normal, 40 mild restrictive and 76 mild obstructive) adult volunteers were considered. The portable Micro lab spirometer was used for the pulmonary function test and standard digital volume transducer was used for data collection. These transducers have already been used for precise flow-volume measurements with high accuracy and stability[15]. The acceptability and reproducibility criteria were adopted as per the recommendations given by American Thoracic Society (ATS)[11,16]. Spirometric data on Vital Capacity (VC), Forced Capacity (FVC), Forced Expiratory Volume in 1st second (FEV1), ratio of FEV1 to FVC (FEV1%), ratio of FEV1 to VC and Peak Expiratory Flow (PEF) were collected. Neuro Solutions 5 and SPSS 11.5 were used concerning ANNs measurements and statistical analysis, respectively. RESAULTS
Wilks lambda 0.969 0.937 0.625
0.298
0.288
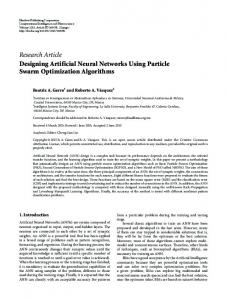
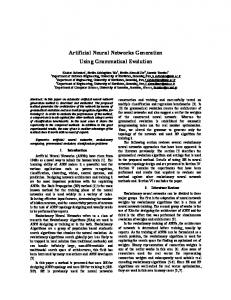
Fig. 3: Combined neural networks yielding more accurate results
Step Wise Discriminant Analysis was used in order to identify the significance of the selected data for neural networks. Then, the most significant data were given to the networks (Table 1). Table 2 represents the accuracy of the statistical procedure used in this study. Artificial neural networks are appropriate alternatives to standard statistical methods[12,17]. Therefore, they were used in this study in order to yield more reliable and accurate results.
the structure of neural networks and the number of neurons in input, hidden and output layers seemed necessary. The number of neurons in input layer is equal to the number of variables in network input. Since this study aimed at classifying the volunteers into two groups, one neuron was used in output layer and two different codes were obtained (normal and abnormal as well as obstructive and restrictive patterns). Another 665
J. Computer Sci., 4 (8): 663-667, 2008 Table 2: Classification of results of step wise discriminate analysis Predicted group membership -------------------------------------------------------------Mild restrictive Mild obstructive Normal Mild restrictive 34 2 4 Mild obstructive 3 69 4 Normal 7 6 121
issue was the number of neurons used in hidden layers. Although experimental rules may determine the number of neurons needed in these layers, the best approach is that of trial and error[15,20]. The next point to be taken into consideration is the fact that neural networks should be trained using appropriate number of training cycles; otherwise, it may result in underestimation or overestimation[21,16].
In the present study, 11 inputs were given to the neural networks. As shown in Fig. 3, two neural networks, i.e. a multilayer perceptron (ANN1) and an Elman network (ANN2) were used. The former aimed at distinguishing between normal and abnormal subjects. It had three hidden layers. Table 3 shows the results of ANN1. The results obtained from ANN1 (volunteers with respiratory abnormalities) were given as input to an Elman network (27 inputs marked as *) with 2 hidden layers. This network classified and distinguished between mild obstructive and mild restrictive patterns. Table 4 shows the outputs of Elman network. The developed tests were evaluated by computing four evaluation indices[17,18] such as accuracy, sensitivity, specificity, and adjusted accuracy which are commonly used for validating medical and clinical tests[17,18]. Abnormal
Normal
19
1
Abnormal
3
27*
Table 4: Results of ANN2 Mild restrictive Mild restrictive 10 Mild obstructive 1
Normal (ANN1) Mild obstructive (ANN2) Mild restrictive (ANN2)
Adjusted accuracy 92.50% 91.50%
92.50%
93%
91.50%
90%
85% 91% 90%
TP + TN TP + TN + FP + FN
(1)
Sensitivity =
TP TP + FN
(2)
Specificity =
TP TP + FN
(3)
Adjusted Accuracy =
Sencitivity + Specificity 2
(4)
The results obtained from ANNs were evaluated by above relations and are presented in Table 5. CONCLUSION Lung function analysis plays an important role in the diagnosis and prognosis of respiratory disorders and spirometric investigation remains central in such clinical practices[22,17]. In this study, abnormalities of respiratory system have been detected using artificial neural networks which are appropriate alternatives to standard statistical methods[12,23]. The study of results obtained from two ANNs revealed that a synthetic network is more accurate in detecting patterns than statistical methods (Step Wise DiscriminantAnalysis), as shown in Table 5 in comparison to Table 2 illustrating the results obtained from synthetic neural networks and statistical methods respectively. In other words, the diagnosis of respiratory disorders could be carried out more accurately using two ANNs (a three-layer Perceptron and an Elman network) in which the former fulfills part of diagnosis and gives the results as input to the latter.
Table 5: Results of ANN1 and ANN2 Sensitivity Specificity 95% 90% 90% 93%
40 76 134
Accuracy =
Mild obstructive 1 15
Accuracy 92% 92.50%
Percent of accurate classification ---------------------------------------
The event that classifies a normal data as an abnormal one is termed as False Positive (FP), whereas, the event that classifies an abnormal data as normal is termed False Negative (FN). True Positive (TP) and True Negative (TN) are those events that classify normal data as normal and abnormal data as abnormal respectively. Reported mild restrictive and mild obstructive patterns of ANN2 were evaluated by these indices too. The values of these indices were calculated using the following relations:
DISCUSSION
Table 3: Results of ANN1 Normal
Total ---------
666
J. Computer Sci., 4 (8): 663-667, 2008 13. Veezhinathan, M. and R. Swaminathan, 2007. Detection of Obstructive Respiratory Abnormality Using Flow-Volume Spirometry and Radial Basis Function Neural Networks. J. Med. Syst., 31: 461465. DOI: 10.1007/s10916-007-9085-9. 14. Mahesh, V. and S. Ramakrishnan, 2007. Assessment and classification of normal and restrictive respiratory conditions through pulmonary function test and neural network. J. Med. Eng. Technol., 31: 300-304. DOI: 10.1080/03091900701233962. 15. Woods, K., W.P. Kegelmeyer and K. Bowyer, 1997. Combination of Multiple Classifiers Using Local Accuracy Estimates. IEEE Transactions on Pattern Analysis and Machine Intelligence, 19: 405-410. DOI: 10.1109/34.588027. http://doi.ieeecs.org/10.1109/34.588027 16. Veezhinathan, M. and R. Swaminathan, 2007. Detection of Obstructive Respiratory Abnormality Using Flow-Volume Spirometry and Radial Basis Function Neural Networks. J. Med. Syst., 31: 6368. DOI: 10.1007/s10916-006-9043-y. 17. Rakesh, K.S., A. Yogender and N.D Barda, 2007. Backpropagation artificial neural network detects changes in electro-encephalogram power spectra of syncopic patients. J. Med. Syst., 31: 63-68. DOI: 10.1007/s10916-006-9043-y. 18. Kittler, J. and M. Hatef, 1998. On combining classifiers. IEEE Transact. Pattern Analys. Machine Intelligence, 20: 226-239. DOI: 10.1109/34.667881. 19. Lynch, R.S. and P.K. Willet, 1999. Performance considerations for a combined information classification test using Dirichlet Priors. IEEE Transactions on Signal Processing, 47: 1711-1715. DOI: 10.1109/78.765145. 20. Kim, Y. and S.Y. Sohn, 2004. Managing Loan Customers Using Misclassification Patterns of Credit Scoring Model. Expert Syst. with Applicat., 26: 567-573. DOI: 10.1016/j.eswa.2003.10.013. 21. Malhotra, R. and D.K. Malhotra, 2003. Evaluating consumer loans using neural networks. Omega, 31: 83-96. DOI: 10.1016/S0305-483(03)00016-1. 22. Enright, P.L., M. Studnicka and J. Zielinski, 2005. Spirometry to Detect and Manage Chronic Obstructive Pulmonary Disease and Asthma in Primary Care Settings, European Respirometry Monitor, 31: 1-14. DOI: 10.1080/03091900701233962. http://www.viasysmedtech.com/prod_serv/downloa ds/ra_ch1.pdf 23. Wei, Q., S.M.F. Kenneth, H.Y.C. Francis, F.K. Lan, W.F.P. Paul and P.H. Roger, 2002. Adaptive Filtering of Evoked Potentials with Radial-Basis Function Neural Network Prefilter. IEEE Trans. Biomed. Eng, 49: 225-232. DOI: 10.1109/10.983456.
The proposed method can be used for automatic analyses in medical contexts. In addition, an automatic analysis based on algorithm using neural networks with more input parameters may be useful for accurate diagnosis of such disorders. REFERENCES 1.
2. 3.
4. 5.
6. 7.
8.
Gold, W.M., 2000. Pulmonary function testing. In: Murray, J.F., J.A. Nadel, R.J. Mason and H.A. Boushey, (Eds.). Text book of Respiratory Medicine. 3rd Edn., Philadelphia: W.B. Saunders, pp: 781-881. Crapo, R.O., 1994. Pulmonary-function testing. N. Engl. J. Med., 331: 25-30. http://content.nejm.org/cgi/content/extract/331/1/25
Al-Ashkar, F., R. Mehra and P. Mazzone, 2003. Interpreting Pulmonary Function Tests: Recognize the Pattern and the Diagnosis Will Follow. Cleveland Clin. J. Medic., 70: 866-881. http://ccjm.org/content/70/10/866.full.pdf+html Pierce, R., 2005. Spirometer: An Essential Clinical Measurement. Aust. Fam. Physician, 34: 525-529. http://www.racgp.org.au/afp/200507/200507pierce.pdf Barnea, O., S. Abboud, A. Guber and I. Bruderman,
2004. Model-based Prediction of Expiratory Resistance Index in Patients with Asthma. J. Clin. Monit. Comput., 18: 241-245. DOI: 10.1007/s10877-005-9612-5. Sharma, S., 2006. Restrictive Lung Diseases. EMedicine Elect. J., URL: http://www.emedicine.com/MED/topic2012.htm. Hogg, J.C., F. Chu and S. Utokaparch, 2004. The nature of small airway obstruction in chronic obstructive pulmonary disease. The New England J. Medi., 350: 2645-2653. http://content.nejm.org/cgi/content/abstract/350/26/2645
Nicholas, J., 2005. Chronic Obstructive Pulmonary Disease Outcome Measurements What’s Important? What’s Useful?, The Proceedings of the American Thoracic Society, 2: 267-271. 9. Boukebeche, M., N. Cot and J.P. Giroud, 1995. Handling intelligent and active data by object knowledge bases and object databases: The public health care case study. Proceedings of Seventh International Conference of Computing and Information, July 5-8 1995, pp: 512-528. 10. Haykin, S., 1999. Neural Networks: A Comprehensive Foundation, Prentice Hall. ISBN: 978-0132733502. 11. Ubeyl, E.D. and I. Inan Guler, 2004. Multilayer Perceptron Neural Networks to Compute Quasistatic Parameters of Asymmetric Coplanar Waveguides. Neurocomputing, 62: 349-365. DOI: 10.1016/j.neucom.2004.04.005. 12. Elman, J., 1990. Finding Structure In Time, Cognitive Since. 14: 179-211. DOI: 10.1016/03640213(90)90002-E. 667