DETERMINATION OF HIV DRUG RESISTANCE. EARLY WARNING INDICATORS SURVEY IN. ETHIOPIA, 2014/15. ETHIOPIAN PUBLIC HEALTH INSTITUTE, ...
DETERMINATION OF HIV DRUG RESISTANCE EARLY WARNING INDICATORS SURVEY IN ETHIOPIA, 2014/15
ETHIOPIAN PUBLIC HEALTH INSTITUTE, ADDIS ABABA, ETHIOPIA
July,2015
PREFACE Ethiopia has been progressively expanding and intensifying her response to the epidemic since enactment of the National HIV/AIDS Policy in 1998. In 2003, the Government of Ethiopia introduced its ART program with the goal of reducing HIV-related morbidity and mortality, improving the quality of life of people living with HIV and mitigating some of the impact of the epidemic. Free ART was launched in 2005, since then both the numbers of sites providing the service and patients receiving treatment have rapidly increased. In June 2013, a total of 913 health facilities were providing HIV care and treatment services in all regions of the country while 308,860 of patients were on treatment. As the number of people on treatment increases, the emergence of HIV drug resistance (HIVDR) becomes a greater risk which has the potential to undermine the dramatic gains that ART programs have had in reducing the morbidity and mortality. To respond to the problem of HIVDR and to attempt to minimize its occurrence, WHO has established several strategies for surveillance and monitoring of HIVDR. Among the activities proposed is monitoring the quality of care in ART program using “Early Warning Indicators” of HIVDR (EWI). The Ethiopian Ministry of Health (MoH) has been proactive in minimizing preventable HIVDR. A national HIVDR working group was established within the MoH to integrate the essential HIVDR strategy into the country‟s ART and HIV prevention plans. EWI pilot survey was conducted in December 2007 in 14 selected hospitals providing ART in 4 regions. Following the pilot study preparation was done to do the survey in different geographically representative ART sites, data was abstracted in 45 (2008), and 49 (2009 &2010) health facilities. In 2014, following the 2012 update of WHO global strategy for HIVDR, EWIs survey was done in 81 different geographically representative sites of the country. The report or result of this survey will be used to improve the performance of the ART site practice and quality of care and also be used to inform national decision-making on ART program development and other HIVDR prevention measures. As one of the major activities of the institute in supporting the HIV/AIDS control program, EPHI will continue to produce data for decision making to improve programs. As a future plan effort will be done to integrate EWI collection in to the national ART program as routine practice. i
CONTRIBUTORS Mr. Yimam Getaneh (EPHI) Mr. Nigussie Gezahagn (EPHI) Ms. Eleni Kidane (EPHI) Mrs. Kidist Zealyas (EPHI) Mr. Tesfaye Tilahun (EPHI) Mr. Abebe Asefa (EPHI) Dr. Fekadu Adugna (WHO-E) Ms. Seble Girma (EPHI) Dr. Yibeltal Assefa (EPHI) Dr. Desta Kassa (EPHI) Mr. Atsbeha Gebrexier (EPHI)
ii
ACRONYMS
AIDS
Acquired Immunodeficiency Syndrome
ART
Antiretroviral Therapy
ARV
Antiretroviral Therapy
AZT
Zidovudine (also known as ZDV)
EWI
Early Warning Indicator
HAART
Highly active anti-retroviral therapy
HIV
Human immunodeficiency virus
HIVDR
HIV drug resistance
NNRTI
Non-Nucleoside Reverse Transcriptase Inhibitor
NRTI
Nucleoside Reverse Transcriptase Inhibitor
PI
Protease Inhibitor
RNA
Ribonucleic Acid
RT
Reverse Transcriptase
TWG
Technical Working Group
UNAIDS
Joint United Nations Program on HIV/AIDS
VL
Viral Load
WHO
World Health organization
UNGAS
United Nations General Assembly Special Session on HIV/AIDS
iii
Contents
Page no.
PREFACE ......................................................................................................................................................... i CONTRIBUTORS ............................................................................................................................................. ii ACRONYMS .................................................................................................................................................. iii EXECUTIVE SUMMARY ................................................................................................................................. vi 1. INTRODUCTION ......................................................................................................................................... 1 1.1.
RATIONALE .................................................................................................................................... 1
1.2.
OVERVIEW OF HIV IN ETHIOPIA .................................................................................................... 4
2. OBJECTIVE ................................................................................................................................................. 7 3. METHODOLOGY ........................................................................................................................................ 7 4. RESULTS AND DISCUSSIONS .................................................................................................................... 11 4.1. ART roll out ...................................................................................................................................... 11 4.2. Early warning indicators by Facility and Region............................................................................... 12 4.3. Early warning indicators by level of facilities .................................................................................. 21 4.3.1. Facility related factors contributing to drug supply continuity ................................................ 23 4.4. Early warning indicators by Round (2013/14 Vs 2014/15) .............................................................. 25 5. RECCOMENDATIONS ............................................................................................................................... 27 6. LIMITATIONS ........................................................................................................................................... 29 7. ACKNOWLEDGMENTS ............................................................................................................................. 30 ANNEX-1; DESCRIPTION OF EARLY WARNING INDICATORS (EWIs) .............................................................. 1 ANNEX-2 WHO RECOMMENDED SAMPLE SIZE DETERMINATION .............................................................. 1 ANNEX-3 SUMMARY OF EWIs BY HEALTH FACILITIES IN (2014/15) ............................................................ 2
iv
List of Tables
Page No.
Table 1 Facility related factors contributing to ARV drug supply continuity ............................................ 24
List of Figures
Page No.
Figure 1 On-time pills pick up achievement of health facilities by region (proportion) ............................. 13 Figure-2 Retention in care of classification of health facilities by region (proportion) ........................... 16 Figure- 3 Proportion of health facilities with ARV drug supply continuity by region ............................... 19 Figure 4 Proportion of health facilities with ARV drug supply continuity by region ................................ 22 Figure- 5 Proportion of health facilities with ARV drug supply continuity by Health Facility Level ....... 22 Figure 6 Proportion of On time Drug pick up and patient retention in care by round (2013/14Vs 2014/15) .................................................................................................................................................................... 25 Figure 7 proportion of Drug supply continuity by round ............................................................................ 26
v
EXECUTIVE SUMMARY Background: Rapid scale-up of antiretroviral therapy (ART) in resource-limited settings, like Ethiopia, is accompanied with an increasing risk of HIV drug resistance (HIVDR), which in turn could compromise the performance of national ART rollout program. HIVDR testing is not routinely available in the country, therefore, ART program and site factors known to be associated with emergence of HIVDR should be monitored to optimize the quality of patient care and minimize the emergence of preventable HIVDR. World Health Organization (WHO) developed a set of HIVDR early warning indicators (EWIs) that assess ART, patient, clinic and program factors associated with HIVDR emergence and provide targets for optimal functioning of clinics and program. This study is, therefore, intend to evaluate the levels of the four chosen HIVDR EWIs in 89 selected ART sites in Ethiopia in order to identify potential strengths and weaknesses of the national ART program, and to inform the relevant evidence-based policies necessary to improve the quality of clinical healthcare, the drug supply/management system, and patient adherence; with the ultimate goal of minimizing the development and the spread of preventable HIVDR in the country. Methods: A retrospective cohort and cross sectional survey was conducted in 2015 among 89 geographically selected ART sites, data were abstracted using pre established WHO tool to evaluate the performance of health facilities using the four EWIs; (1) on time pill pickup (EWII), (2) Retention in care (EWI-II), (3) ARV drug supply continuity (EWI-III) and (4) ART dispensing practice practices (EWI-IV). Performances of the health facilities were classified based on a set of scorecards, according to WHO-2012 recommendation. Result: Twenty percent (18/89) of the facilities achieved „„excellent‟‟ performance in on time drug pick up practice of patients attending in the respective ART clinics while 56% (50/89) and 24% (21/89) of them had „„fair‟‟ and „„poor‟‟ performance respectively. Indicator for Patient retention in care revealed that 81% (72/89) of the sites achieved „„excellent‟‟ while 15% (13/89) „„fair‟‟ performance. Only 4% (4/89) of the facilities had „„poor‟‟ performance in patient retention in care. with regard to Drug supply continuity, 48% (43/89) of the facilities had no ARV drug stock out over 12 month preceding the survey. The entire facilities selected for this survey achieved excellent performance in ARV drug dispensing practice. In conclusion, the level of EWIs for HIVDR in Ethiopia ,in this survey, indicated excellent ARV drug dispensing practice in all the facilities and improvements on patient retention in care. However, indicators related to patient adherence (i.e on time drug pick up) and drug supply continuity remained still a challenge, thus, reflecting the important risks of emerging HIVDR. EWI monitoring directly resulted in public health action which will optimize the quality of care, specifically the strengthening of ART record systems, engagement of ART sites and operational research for improved adherence assessment and ART patient defaulter tracing.
vi
1. INTRODUCTION 1.1. RATIONALE Major challenges to expanded access of antiretroviral therapy (ART) for human immuno deficiency virus (HIV) infected individuals in sub-Saharan Africa arise from a deficient, under resourced health infrastructure. Suboptimal delivery of HIV care and treatment may accelerate the emergence of drug-resistant viruses, which could impair the sustained response to first-line ART and increase the subsequent spread to newly infected individuals1. Because HIV drug resistance (HIVDR) testing is not routinely available in resource-limited settings, the World Health Organization (WHO) as part of its global strategy for prevention and assessment of HIVDR, recommends that ART program factors, such as on time drug pick up, dispensing practice, patient retention and drug supply continuity, are monitored to optimize the quality of patient care2. World Health Organization HIVDR early warning indicators (EWIs) make use of data that are routinely collected in patients‟ medical and pharmacy records3, and feasibility of their implementation has been successfully demonstrated in sub-Saharan Africa4.
The HIV induced acquired immunodeficiency syndrome (AIDS) pandemic, has been a major medical and public health problem globally. At the end of 2013, an estimated 35 million people were living with HIV. According to the WHO, an estimated 39 million people have died since the first cases were reported in 1981 and 1.5 million HIV-related death and 2.1 million new infections has occurred only in 20135. Sub-Saharan Africa is the most affected region, with 24.7 million people living with HIV and 1.5 million new infections, accounts for almost 70% of the global new HIV infections in 2013.
1
Zaccarelli M, Tozzi V, Lorenzini P, et al. Multiple drug class-wide resistance associated with poorer survival after treatment failure in a cohort of HIV-infected patients. AIDS 2005; 19: 1081–9. 2 Little SJ, Holte S, Routy JP, et al. Antiretroviral-drug resistance among patients recently infected with HIV. N Engl J Med 2002; 347: 385–94. 3 Bennett DE, Bertagnolio S, Sutherland D, Gilks CF. The World Health Organization’s global strategy for prevention and assessment of HIV drug resistance. Antivir Ther 2008; 13(Suppl 2): 1–13 4 World Health Organization. HIV drug resistance early warning indicators; June 2010 update. Geneva, Switzerland. 5
The Gap Report Joint United Nations Program on HIV/AIDS (UNAIDS), 2014
1
The introduction of highly active antiretroviral therapy (HAART) was the significant breakthrough in the battle against HIV/AIDS. Although antiretroviral drugs cannot eradicate HIV from infected cells, the therapy has resulted dramatic decline in morbidity and mortality associated with HIV, prolong survival, improve quality of life, restore and preserve immunologic function. Furthermore potent and durable viral suppression decrease the number of viral copies and result in reduced probability of virus transmission, restricted viral evolution6. Following the recommendations of the United Nations General Assembly Special Session on HIV/AIDS (UNGASS) of 2011, rapid scale-up of antiretroviral therapy (ART) for HIV in resource-limited countries has been an international priority. Since then, incredible achievements were recorded in expanding the service particularly in countries with high burden of the disease7. At the end of 2013, 12.9 million people were receiving ART globally of which 11.7 million were in low- and middle-income countries, which represent 36% of the people living with HIV in lowand middle-income countries. ART has averted 7.6 million deaths between 1995 and 2013 including 4.8 million deaths in sub-Saharan Africa. Similarly, providing access to antiretroviral medicines for pregnant women living with HIV has averted more than 900, 000 new HIV infections among children since 20093. Rapid scale-up of ART in resource-limited settings is accompanied with an increasing risk of emergency and transmission of HIVDR. Due to HIV‟s error-prone replication, high mutation rate and viral recombination, development of some HIVDR is inevitable, even with appropriate ART prescribing and adherence. HIVDR has significant human and financial implications. As the number of people on treatment increases, the emergence of meaningful population-level HIVDR becomes a greater risk which has the potential to undermine the dramatic gains that ART programs have had in reducing the morbidity and mortality of HIV-infected people in resourcelimited settings8.
6
.
Quinn TC, Wawer MJ, Sewankambo N, et al. Viral load and heterosexual transmission of human immunodeficiency virus type Rakai Project Study Group. N Engl J Med. 2000;342(13):921-929 7 World Health Organization Global Strategy for the Surveillance and Monitoring of Drug Resistance, 2012 8
Cohen MS, Chen YQ, McCauley M, et al. Prevention of HIV-1 infection with early antiretroviral therapy. N Engl J Med. 2011;365(6):493-505
2
Monitoring of ART program factors known to be associated with the emergence of HIVDR for the purpose of improving programmatic functioning, may minimize the emergence of preventable HIVDR, especially at ART sites where viral load and HIVDR testing is not routinely available. In response to concerns regarding emergence and transmission of HIVDR, in 20041, the WHO and the United States Centers for Disease Control and Prevention (CDC), in collaboration with HIV ResNet, developed a global strategy for the assessment and prevention of HIV drug resistance, which was updated in 20129. The updated strategy describes five components of a comprehensive package of HIVDR surveys that should be implemented in all countries scaling-up and maintaining populations on ART. These are 1) Monitoring of HIVDR early warning indicators (EWIs), 2) Surveillance of transmitted drug resistance (TDR) in recently infected populations, 3) Surveillance of HIVDR in populations initiating ART, 4) Surveillance of HIVDR in children 12 months and >24 months5.
HIVDR Early Warning Indicators The foundation of the World Health Organization‟s (WHO) global HIVDR prevention and assessment strategy10, which includes laboratory-based surveys of acquired and transmitted11 HIVDR, is the monitoring of HIVDR Early Warning Indicators (EWI). EWIs assess ART site and program factors potentially associated with HIVDR12. Utilizing data routinely collected in patients‟ medical and pharmacy records, EWI monitoring is a minimum-resource strategy designed to be integrated into national monitoring and evaluation programs. EWIs survey factors related to patient care, patient behavior, and clinic-level and program management, all of which are associated with the emergence of HIVDR. When monitored annually at all or a large number of representative ART sites, EWIs provide countries with evidence to make programmatic adjustments at the level of an individual site or the country, when necessary. 9
WHO (2012) Report on assessment of World Health Organization HIV drug resistance early warning indicator advisory panel meeting. 10 Bennett DE, Bertagnolio S, Sutherland D, Gilks CF. (2008) The World Health Organization‟s global strategy for prevention and assessment of HIV drug resistance. Antivir Ther 13 Suppl 2: 1–13. 11 Jordan MR, Bennett DE, Bertagnolio S, Gilks CF, Sutherland D. (2008) World Health Organization surveys to monitor HIV drug resistance prevention and associated factors in sentinel antiretroviral treatment sites. Antivir Ther 13 Suppl 2: 15–23. 12 World Health Organization. (2010) World Health Organization indicators to monitor HIV drug resistance prevention at antiretroviral treatment sites. Available: http://www2.paho.org/hq/dmdocuments/2010/hivdr-early- warning-indicators-updatedapril-2010.pdf. Accessed 25 March 2013.
3
EWIs are quality of care indicators which specifically assess ART sites and program factors potentially associated with HIVDR at individual clinics. Utilizing data routinely collected in patients‟ medical and pharmacy records, EWI monitoring is a minimum-resource strategy designed to be integrated into national monitoring and evaluation programs. Monitoring EWIs annually at all or a large number of representative ART sites will provide countries with evidence to make programmatic adjustments at the level of an individual site or the country. In the 2012 update of WHO global strategy for HIVDR, the number of EWIs was reduced from eight to five indicators that were believed to be closely associated with HIVDR. Definitions of indicators were also simplified and harmonized with indicator definitions used for reporting of Global AIDS Response Progress Report (GARPR) and the United States President‟s Emergency Plan for AIDS Relief (PEPFAR)5. The revised EWIs are 1) On-time pill pick up, 2) Retention in care, 3) Pharmacy stock-outs, 4) Dispensing practices and 5) Viral load suppression at 12 month.
1.2. OVERVIEW OF HIV IN ETHIOPIA The HIV/AIDS epidemic remains one of the important public health challenges in Ethiopia since it was first recognized in the mid-1980s. Ethiopia has been one of the countries severely affected by the HIV/AIDS epidemic. In response to the epidemic, policies and implementation guidelines necessary to effectively guide the prevention, care and treatment efforts were issued by the government. The intensity and quality of interventions against HIV in the country have shown consistent and substantial improvements over time. The WHO ART guideline for public health approach strategy was adopted in 2003. Recent data show that prevalence of HIV among pregnant women aged 15-49 has declined consistently from a peak of 5.8% in 2002 to 2.3% in 2012. Similarly, HIV prevalence among the same group has declined consistently in both urban and rural areas since 2003 13. Estimated overall adult national HIV prevalence in 2013 was 1.3% with rural and urban prevalence of 0.5% and 3.5%, respectively14.
13
Report on the 2009 Round Antenatal Care Sentinel HIV Surveillance in Ethiopia, Ethiopian Health and Nutrition Research Institute (EHNRI), Addis Ababa, August 2011 14 HIV Related Estimates and Projections for Ethiopia, Ethiopian Health and Nutrition Research Institute Federal Ministry of Health, Addis Ababa, August 2012
4
ART was made available freely in 2005 in Ethiopia and since then both the numbers of sites providing the service and patients receiving treatment have rapidly increased. In June 2013, a total of 913 health facilities were providing ART while 308,860 (75.4% of in need) of patients were on treatment15.
With this rapid expansion of ART using the public health approach, emergence of HIVDR is an imminent threat for the national ART program. Cognizant of this fact, the national program adopted the WHO-recommended HIVDR prevention and monitoring strategy in 2007. A national advisory group was established under the leadership of the Ethiopian Public Health institute (EPHI) with the role of technical guidance for HIVDR activities. Since then, EWI surveys were conducted in 2007 (pilot in 14 health facilities). In the first round of EWI survey which was conducted in 2008 a total of 45 (28 hospitals and 17 health centers) health facilities were included in the survey. In the second round of EWI survey conducted in 2012 a total of 49 (33 hospitals and 16 health centers) health institutions were included in the survey. In these surveys 5 of the 8 EWI recommended were collected. These EWIs were: Percentage of adult patients initiating ART at the site who are initially prescribed, or who initially pick up from the pharmacy, an appropriate first-line ART regimen (EWI-1), Percentage of patients initiating ART at the site who are lost to follow-up 12 months after ART initiation (EWI-2), Percentage of adult patients initiating ART at the site who are taking an appropriate first-line ART regimen 12 months later (EWI-3a), Percentage of patients initiating ART at the site who attended all scheduled or expected clinical consultations on-time during the first 12 months of ART (EWI5b) and Percentage of months in a designated year in which there were no ARV drug stock-outs (EWI-6a). Results of these surveys were disseminated in various ways and ART sites are believed to have taken the necessary programmatic correction based on the collected information during the survey.
In 2012, WHO updated the 2010 EWI guidance by conducting a critical review of the available medical literature and the multiple challenges observed with data collection and reporting. EWI definitions were simplified and harmonized with other monitoring and evaluation frameworks 15
Federal HIV/AIDS Prevention and Control Office, 2005 EFY (July 2012 to June 2013) Multi-sectoral HIV/AIDS Response Annual Report, September 2013
5
and processes, including those of the Global Aids Response Progress Reporting (GARPR) and the United States President‟s Emergency Plan for AIDS Relief (PEPFAR). The number of core indicators was reduced to five. Following this recommendation HIVDR technical working group (TWG) determined to abstract the four EWI indicators based on availability of data from existing pharmacy and medical record database.
These EWI indicators are, On-time pill pick-up (EWI-I), Retention in care (EWI-II), Pharmacy stock-outs (EWI-III), Dispensing practices (EWI-IV). The fifth indicator, viral load suppression (EWI-V) at 12 months, was recommended to be monitored only at sites where viral load testing was routinely performed on all patients 12 months after therapy initiation Since routine viral load testing is not done in most ART sites EWI-V was not included in this survey. EWIs performance was rated according to WHO recommended scorecards. The scorecards utilize three classifications: red (poor performance, below desired level), amber (fair performance, not yet at desired level), and green (excellent performance, achieving desired level). Definitions (numerator/denominator) for these selected EWIs and their respective recommended targets are summarized in annex-1.
6
2. OBJECTIVE General Objective The main purpose of HIV drug resistance EWIs monitoring survey was to assess the extent to which ART programs are functioning to optimize prevention of HIVDR in selected geographically representative heath facilities in Ethiopia
3. METHODOLOGY Study design The study design of this survey was combination of cross-sectional and retrospective longitudinal.
Site Selection and Data Abstraction The survey was conducted in all geographically representative areas of the country including all the regions. The source population was those HIV infected individuals who were enrolled for ART since January 1-2013 on wards and have at least 15 months complete data for the recommended EWI-II and all ART patients who were actively on ART in their respective health facilities in the year 2014 for EWI-I and IV. Sites initiated ART and gave a service for at least three years (with 15 months of complete follow up data) plus minimum of 200 and 500 ART patients in follow up for health centers and hospitals, respectively, at the time of the sample start date were included in the survey. Considering all those parameters above mentioned, ninety three public ART delivery sites were selected for this survey (2014/15), which included the eighty one sites that participated in the second EWI survey in 2013/14. Four Health facilities were excluded due to insufficient sample size. Data abstraction was conducted from February to April 2014 by a data abstraction team organized by the EPHI and in collaboration with the WHO. The team consisted of four members (one of whom was a supervisor) who had been trained on data abstraction. Data were queried from individual sites‟ data base, patient follow up chart, pharmacy records and bin card for the respective EWIs taking hard copies as a priority data abstraction source to abstract into an Excel tool provided by the WHO. 7
Sampling and sample size determination The sampling strategy was based on the number of eligible patients for each EWI and was according to the WHO recommendation for the minimum sample size determination as indicated on Table-1. For On-time pill pick-up and Dispensing practices, the number of eligible patients at each site sampled were those patients who were „„actively‟‟ on ART at the time of the sample start date (1-January, 2014). Though, WHO recommends data abstraction on a minimum number of consecutive patients following the sample size criteria (indicated on Annex-1), data abstraction was oversampled by 10% to account for potential censoring of patients. All sites began abstraction from the sample start date and abstracted data until appropriate sample size for each site was reached; regardless of how many months it took to reach the appropriate sample size. Sample sizes for sites were based on the numbers of patients at each participating ART site meeting the eligibility definition of patients to be represented for each EWI according to WHO guidance16. For Retention in care, a census of all patients initiating ART in the 12 months of 2013 was taken (consistent with GARPR/PEPFAR). According to the recommendation by WHO, all ART sites in the country or representative sentinel sites are recommended for such a survey. Due to logistic issue representative sites were selected from all regions of the country. For this round of the survey, the plan was to address 92 geographically representative ART sites including all the 49 which were assessed during the second round survey and 81 facilities addressed during 2013/14 round survey. But at the end of this survey a total of 89 ART sites (60 hospitals and 29 health centers) were included in the survey.
16
World Health Organization Global Strategy for the Surveillance and Monitoring of Drug Resistance, 2012
8
Data Validation, Analysis and Interpretation Structured formats for data collection adopted from WHO were used as a tool for data abstraction. Pre-data collection training was given for 15 data collectors and 5 supervisors. Soon after, data abstraction tools were piloted in selected health facilities in Addis Ababa and gapes identified from the pilot study were corrected before the field data collection. Moreover, survey sites were supervised and all the documentation related to the EWIs was revised. The data were analyzed using excel with inbuilt analytic capacity developed by WHO for this purpose. Moreover, site profile assessment was included as recommended by WHO to see the staffs, number of patients and quality of service in the site.
Data storage and disposition Data were stored at the central data base of EPHI before and after analysis. The participated institutions were the part of the survey so that they can use the data for future actions. Moreover, the electronic form of data base generated was submitted to EPHI data base unit so that the confidentiality of data would not be breached. The collected data per site was based on Unique ART numbers which would not be linked in any form to the patients at a national level where data is stored. Since final data ownership is for EPHI, data retention and disposition is based on the rules and regulations of EPHI.
Study variables According to the newly revised WHO guideline in 2012, there are five recommended set of indicators one of which (viral load suppression at 12 months), was considered conditional and designed to be implemented only at clinics where routine viral load monitoring is performed for all patients 12 months after ART initiation but none of the facilities had this practice of viral load monitoring and hence viral load suppression at 12 month was not calculated. i. On-time pill pick-up (Cross-sectional) ii. Retention in care (Longitudinal) iii. Pharmacy stock-outs iv. Dispensing practices v. Virologic suppression 9
Ethics statements The project was ethically cleared and approved by EPHI Scientific and Ethical Review Office (SERO). Only anonymised data were abstracted from the medical records for public health surveillance purposes. Names, dates of birth, addresses, and unique patient identifier numbers were not abstracted from records. Confidentiality was respected during abstraction of data by the use of specific identification code for each enrolled patient number. Since our study was conducted retrospectively, data were collected from medical/ART and pharmacy registers available at the ART sites. Thus, informed consent from the participants was not required.
10
4. RESULTS AND DISCUSSIONS 4.1. ART roll out Data abstraction and validation was effective for all early warning indicators in 89 (60 hospitals and 29 were health centers) of the 92 ART sites selected for this round survey. However, data from three sites were not validated due to insufficient sample size. All the hospitals and health centers had at least 500 and 200 patients on ARV, respectively. Eighty six of the 89 facilities were government while the remaining 3 were private. All of the health facilities used either clinical or Immunologic criteria for ART initiation and Monitoring, according to the national ART guideline. Forty eight percent (43/89) and 33% (29/89) of the health facilities had a monthly and quarterly supervision, respectively. Yet,11% of the health facilities were supervised irregularly. Total number of patients served by all the selected facilities during the survey period was 362,423 out of which 154,509 patients were on ART. A sample was drawn from those who were on ART based on the WHO-2012 recommendation for sample size determination. Accordingly, a data from 17,987 patients were collected and analyzed for the On-time pill pick-up and dispensing practice. Moreover, additional 11,700 charts were also retrospectively reviewed to assess the level of patient retention in care. The fourth indicator (Drug supply continuity) is facility based to evaluate ARV drug supply, which is not related with patient record. For a general evaluation of the national ART roll-out program performance, data analysis of the overall national EWIs reported that only prescribing practices achieved the target across all the health facilities. Significant improvements had also been observed in some of the EWIs like patient retention in care compared to the previous round (2013/14) survey. Site specific finding of the four EWIs are scored and presented in Annex-3.
11
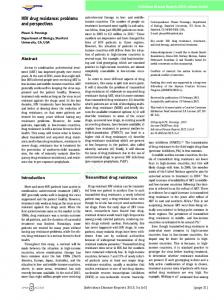
4.2. Early warning indicators by Facility and Region EWI-I: On-time pill pick-up Description; Proportion of patients (adult or pediatric) that pick up ART no more than 7 days late at the first pick-up after the baseline pick-up “On time” as it relates to pill pick-up is defined as a patient picking up their ART within 7 days of their previous prescription running out if taken according to schedule. Numerator /Denominator; Numerator: Number of patients picking up their ART “on time” at the first drug pick-up after baseline pick-up date Denominator: Number of patients who picked up ARV drugs on or after the designated EWI sample start date Target; Red: 90% Findings: The average on-time pill pick-up of patients attending in the selected ART sites was 83% which ranged from 55% to 100%.Specifically, twenty percent (18/89) of the sites achieved „„excellent‟‟ performance for this EWI. More than half (56%) of the sites also fallen under fair performance and a quarter of the sites (24%) achieved “poor" performance. As shown in figure-1, regional comparison showed that, 71% and 67% of ART sites located in Tigray and Afar region achieved „„excellent‟‟ performance with regards to on-time pill pick-up. Significantly high proportion of ART sites in Major regions (Amhara, Oromia and AA) fallen below the recommended performance for this EWI, which achieved 17%, 13% and 12% „„excellent‟‟ performance, respectively. Interpretation of the performance of ART sites for regions including; Harari, Somali, Dire Dawa (DD) and Gambella were difficult due to representation issues of the health facilities for their respective region.
12
Figure 1 On-time pills pick up achievement of health facilities by region (proportion)
Conclusion: A challenge to long-term ART programmatic success is maintaining populations of patients on ART without treatment interruptions. Treatment interruptions may arise due to poor patient adherence or may occur as unintended consequence of ARV supply interruption at ART clinic dispensaries17. Non-adherence to ART causes the worsening of the immunological and clinical state and leads to treatment failure, emergence of drug resistant HIV strain and increases AIDSrelated morbidity, mortality and hospitalization18. Notably, ART interruptions of ≥48 hours in patients receiving NNRTI-based regimens are associated with the selection of drug-resistant HIV19. Based on these facts, ensuring adequate and consistent adherence to ART is a high priority and critical element for the success of ART.
17
Nachega JB, Knowlton AR, Deluca A, et al. Treatment supporter to improve adherence to antiretroviral therapy in HIVinfected South African adults. A qualitative study. J Acquir Immune Defic Syndr. 2006;43(Suppl 1):S127–33 18 Marcellin F, Boyer S, Protopopescu C, et al. Determinants of unplanned antiretroviral treatment interruptions among people living with HIV in Yaoundé, Cameroon (EVAL survey, ANRS 12-116) Trop Med Int Health 2008;13:1470–8 19 Parienti JJ, Das-Douglas M, Massari V, et al. Not all missed doses are the same: sustained NNRTI treatment interruptions predict HIV rebound at low-to-moderate adherence levels. PLoS One. 2008;3:e2783
13
Studies have shown treatment pickup rate is a simple, inexpensive and a valid proxy measure of adherence to ART. It has also been shown that, treatment pickup rate was significantly higher among persons with suppressed viral load, while missed appointment rate was lower among persons with unsuppressed viral load20. Considering the importance of ensuring adequate and consistent adherence to ART is high priority for effective HIV management the national guidelines of Ethiopia recommends patients are required to attend a counseling sessions before ART initiation, in particular, education on the importance of adherence.
In most of ART facilities, additional pills are dispensed to patients in support of inconveniencies to pick their drug on time. This means patient may have some remnant pills a head of their arrival to health facilities. Since the number of remnant pills was not routinely recorded, it was not possible to calculate the actual pill run-out date necessary to monitor this EWI. For this survey patients who attended on or before the appointment date and those who picked up their ARVs up to 7 days later than the appointment date were considered to be on- time pill pick up. Even though, patient delay for drug pick-up could be explained by the availability of left over drugs from the previous appointments, the finding of this survey showed that on time pill pick up of patients attending in the selected health facilities is yet a challenge. Only 20 % (18/89) of health facilities achieved „„excellent‟‟ performance on time pill pick-up. This indicates a large proportion of patients were picking up medication lately. Considering on time pill-pick up as a measure of adherence, the overall delay in drug pick-up strongly suggested that further investigation has to be done to find out the possible causes of this underperformance in on-time pill pick-up practice. In general, it is essential that, facilities with poor achievement of on time pill pick up require further evaluations to determine the underlying factors and implement targeted adherence improvement initiatives to improve adherence which include continuous adherence counseling, defaulter tracing, continuous health education, providing outreach services to remote sites, linking patients to community support organizations.
20
Grossberg R & Gross R (2007) Use of pharmacy refill data as a measure of antiretroviral adherence. Current HIV/AIDS
Reports, 4(4): 187-191
14
EWI-II: Retention in Care Description; Percentage of adults and children known to be alive and on treatment 12 months after initiation of ART Numerator/ Denominator; Numerator: Number of adults and children who are still alive and on ART 12 months after initiating treatment Denominator: Total number of adults and children who initiated ART who expected to achieve 12-month outcomes within the reporting period The denominator excludes transfers out. The indicator includes children. There is now no separate pediatric EWI Target; Red: 85% retained after 12 months of treatment Findings: The average patient retention in care performance of the health facilities represented in this survey was 92% ranged from 67% to 100%. Specifically, 81% (72/89) of the sites achieved „„excellent‟‟ performance while 15% (13/89) and 4% (4/89) had „„fair‟‟ and
„„poor‟‟
performance respectively. Regional comparison showed that; Addis Ababa, Amhara and Tigray regions scored the maximum patient retention in care which accounted for 94% (16/17), 94% (17/18) and 86% (6/7) respectively (Fig, 2).
15
Figure-2 Retention in care of classification of health facilities by region (proportion)
Conclusion: ART provision can be effective only if patients are retained in care over time21. Studies showed that patients with low retention in care are at high risk of developing HIVDR22; this is also an important factor in the transmission of resistant viral strain in the community. Retention is also a critical issue for ART programs from a cost-effectiveness point of view. As programs are trying to maximize the impact of limited resources, a failure to ensure good retention in care is costly for both the program and the patient. Ensuring good retention in care remains one of the key challenges for ART programs while the treatment is still scaled up further23. The average global retention rate in 2009 at 12 months was 82% and dropped to 77% at 24 months and remained stable at 75% and 74.5% at 36 and 48 months, respectively24. These figures were consistent with a meta-analysis of 39 cohorts from sub-Saharan Africa in 201125 21
WHO, Retention in HIV programmes: Defining the challenges and identifying solutions; Geneva: WHO; 2012. WHO, UNAIDS, UNICEF: Towards universal access: scaling up priority HIV/AIDS interventions in the health sector. Progress report 2011 23 WHO, Retention in HIV programmes: Defining the challenges and identifying solutions; Geneva: WHO; 2012. 24 Assefa Y, Van Damme W, Haile Mariam D, Kloos H: Toward universal access to HIV counseling and testing and antiretroviral treatment in Ethiopia: looking beyond HIV testing and ART initiation. 25 Assefa Y, Van Damme W, Haile Mariam D, Kloos H: Toward universal access to HIV counseling and testing and antiretroviral treatment in Ethiopia: looking beyond HIV testing and ART initiation. 22
16
that assured retention in care remains to be a challenge for ART programs though it is improving over time26,27. Many ART programs have therefore been striving hard to identify and implement appropriate strategies to optimize their retention levels28. In addition, it has been identified that levels of retention vary widely across health facilities and programs29. In Ethiopia, in spite of the achievements in scaling up ART in the country, lost to follow-up and early mortality of patients on ART has been challenges for the ART program. Only 65% of the patients were retained after two years on ART by 200830. The average retention in care performance of the health facilities represented in this survey was 92% ranged from 67 % to 100%. Moreover, 81% of the facilities achieved excellent performance which had significant improvement compared to the previous survey that had been reported as 62%. This improvement might be due to the implementation of national programmatic intervention (i.e expansion of ART service and improved site supervision).Though, finding of this survey indicated improvements in the performance of this EWI, a number of health facilities (19%) still achieved below the expected performance in retention in care. Therefore, a proportion of patients served by these health facilities may be at high risk for developing HIVDR. As indicated in the result, there is also heterogeneous performance of health facilities in patient retention in care ranges from 67% to 100% which suggest there might be factors at site-level that are influencing this indicator. Literatures also suggest that adherence support and defaulter tracing has impact on improvement of ART programs31. Hence, efforts should be made to investigate factors contributing to low patient retention in care. Moreover, for sites with migrant
26 2
Tassie JM, Baijal P, Vitoria MA, Alisalad A, Crowley SP, Souteyrand Y: Trends in retention on antiretroviral therapy in National programmes in lowand middle-income countries. 27 Fox MP, Rosen S: Patient retention in antiretroviral therapy programs up to three years on treatment in sub-Saharan Africa: systematic review. 28 WHO, UNAIDS, UNICEF: Towards universal access: scaling up priority HIV/AIDS interventions in the health sector. Progress report 2011 29 Assefa Y, Van Damme W, Haile Mariam D, Kloos H: Toward universal access to HIV counseling and testing and antiretroviral treatment in Ethiopia: looking beyond HIV testing and ART initiation. 30 Federal HIV/AIDS Prevention and Control Office:2013, Monitoring and Evaluation Report, 2011/2012. Addis Ababa, Ethiopia:. 31 UNAIDS (2013) Global Report
17
workers and daily laborers, additional strategies has to be designed to retain patients either at the site or offsite of treatment needs to be devised. There was also variations in patient retention in care among the regions which may intern suggest the need of programmatic support and intervention in some regions with poor performance. EWI -III: Pharmacy stock-outs Description; Percentage of months in a designated year in which there were no ARV drug stock-outs Numerator: Number of months in the designated year in which there were no stock-out days of any ARV drug routinely used at the site Denominator: 12 months Target; Red: 0% dispensing of mono-or dual therapy, Green: 100% dispensing of no mono-or dual therapy Finding: All the health facilities selected for this survey achieved „„excellent‟‟ performance, mean no patients dispensed with mono- or dual therapy 12 months preceding the survey period. 32
Claudia H, Robert M. Adherence to antiretroviral therapy in resource-limited settings: everything matters.AIDS, 2007, 21(8): 1041–1042. 33 Marcellin F et al. Determinants of unplanned antiretroviral treatment interruptions among people living with HIV in Yaounde, Cameroon (EVAL survey, ANRS 12-116).Tropical Medicine and International Health, 2008, 13:1470–1478. 34 Oyugi JH et al. Treatment interruptions predict resistance in HIV-positive individuals purchasing fixed-dose combination antiretroviral therapy in Kampala, Uganda. AIDS, 2007, 21:965–971.
20
Irrespective of the level of health facilities at both hospitals and health centers patients were prescribed and dispensed the appropriate ARV based on the national ART guidelines. Conclusion: Prescribing and dispensing practices are closely associated with the emergence of HIVDR. The prescribing of mono- and dual-ART and inappropriate dosing may lead to insufficient drug pressure to effect viral load suppression, leading to the selection of drug-resistant virus. The rate of correct prescribing and dispensing was the highest; all facilities had achieved the desired 100% dispensing practice according to the level of WHO recommendation and the National ART guideline of the country. This good performance would be likely due to the ongoing efforts in training pharmacy professionals, which could contribute to the conformity of prescribing habits with national guidelines. Thus continuous training of pharmacy professionals need to be strengthened to maintain the good achievement ARV prescriptions and dispensing practice as it will support to minimize emergency of HIV drug resistance.
4.3. Early warning indicators by level of facilities Findings: Comparison of health facilities by their level with regard to on time drug pick up practice revealed that; 17% (5/29) and 18% (11/60) of health centers and hospitals had "excellent" performance while 59% (17/29) and 60% (36/60) of them had "fair" performance respectively. Meanwhile, 24% (7/29) and 13% (22/60) of health centers and hospitals had 'poor' performance. With respect to the level health facility for patient retention in care, 83% (50/60) and 79% (23/29) of hospitals and health centers met the target excellent‟‟ performance (>85%) while 13% (8/60) and 14% (4/29) hospitals and health centers attain 'fair' score of WHO target. Only 3% (2/60) and 7% (2/29) hospitals and health centers had 'poor' performance during the study period. When stock out disaggregated by level of health facilities, 62% (37/60) of hospitals and 28% (8/29) of health centers had stock out of one or more ARV drugs. Except in Gambella, health facilities in all other regions had ARV stock out of various level (Table-2), precaution should be taken in interpreting this as some regions are represented by only one or two facilities.
21
Figure 4 Proportion of health facilities with ARV drug supply continuity by region
Figure- 5 Proportion of health facilities with ARV drug supply continuity by Health Facility Level
Conclusion: Patient adherence can be approximated using pharmacy pickup information, and studies have shown that drug pickup data may be considered an alternative to CD4 cell counts in predicting virologic failure35. Another adherence measure, the medication possession ratio (MPR), defined as the amount of time an individual is in possession of ARVs divided by the time between ARV
35
Nachega JB, Hislop M, Dowdy DW, Chaisson RE, Regensberg L, Maartens G. Adherence to non- nucleoside reverse transcriptase inhibitor-based HIV therapy and virologic outcomes. Ann Intern Med 2007; 146: 564–73.
22
prescriptions, has also been shown to be associated with treatment outcomes in resource-limited settings36. This survey indicated that there is no significant difference between health centers and hospitals with regard to performance in patient retention in care and on time drug pick up practice of patients attending the health facilities. But, significant difference was observed in drug supply continuity. Briefly, 72% of the health centers and 38% of the hospitals had sustainable ARV drug supplies throughout the year 2014/15, preceding the survey period. Moreover, 86% of the population included in this survey is from the hospitals. This may indicate, facilities serving significantly high population are at high risk of developing preventable drug resistance related to fragmented drug supply continuity. 4.3.1. Facility related factors contributing to drug supply continuity
Drug stock outs cause unplanned treatment interruptions. Further, repeated drug stock outs interrupt treatment which causes treatment discontinuity, and if not controlled could lead to drug resistance and/or treatment failure. Furthermore, treatment interruptions affect treatment efficacy and could compromise treatment effectiveness. This could cause first-line treatment to be switched, meaning other drugs belonging to the next step in treatment, for instance to those classified as second line, to guarantee efficacy. Moreover increased complications, hospitalizations and adverse events could follow, which possibly could lead to death. Thus regular and uninterrupted supplies of antiretroviral drugs (ARVs) will considerably decrease treatment discontinuity, and therefore contribute to a decrease of morbidity and number of deaths related to HIV/AIDS. One of the aim of this survey was therefore, to assess facility related determinants of high stock out rate of ARV drugs. Accordingly, this study indicated that, regular stock and bin card monitoring for ARV drugs and training of pharmacy store personnel's were significantly associated with drug supply continuity in the facilities (P=0.01,0.047,0.043). Most health facilities also agreed that delay in consumption report and late distribution of ARV drugs could also contribute to fragmented drug supply system.
36
Paterson DL, Swindells S, Mohr J, et al. Adherence to protease inhibitor therapy and outcomes in patients with HIV infection. Ann Intern Med 2000; 133: 21–30.
23
Table 1 Facility related factors contributing to ARV drug supply continuity Factors Does the pharmacy Head monitor stock of ARV Drugs Is bin card monitoring in place Does the pharmacy conduct regular physical count Does the facilities report consumptions of ARV Drugs on time and regularly (defined) Where does the facility report for consumptions
Is there any ARV drug shortage in the past one year (2014/15) preceding the survey Have your patients being in convinced by the drug stock out
What do you think is the most frequent causes of ARV drug shortage in your facility
Yes No Yes No Yes No Yes No ZHD HO Near By PFSA Hub Central PFSA Yes No Strongly Don't Agree Yes No Unknown Distance from PFSA In Appropriate reporting of the consumption Delay report of consumption to PFSA Delay Distribution of drugs from PFSA
Is there a system for regularly monitoring Stocks of ARV Drugs
Number of ART patients being served by the facility
Average number of patients/clinic/day
Estimated distance from the nearby ARV drug distribution center
Does the pharmacy store personnel trained in SCMS
Number of Pharmacy professionals in the facility
Others No Yes 10132.51 193.51 393.89 Yes No 38.00
Total
24
Drug Supply continuity Excellent Poor 44 13 3 17 46 28 1 12 45 40 2 0 32 27 15 13 16 13 26 24 5 3 30 33 17 7 5 2 21 26 19 11 7 3 4 3
Total 77 20 84 13 85 2 59 28 29 50 8 63 24 7 47 30 10 7
8
5
13
5
4
9
24
26
50
6 46 1 2 39 6 0 1 33 12 1 1 28 12 1 5 23 24 6 31 8 1 1 47
2 40 0 0 35 4 1 3 24 11 2 0 24 14 2 0 20 20 4 22 10 3 1 40
8 86 1 2 74 10 1 4 57 23 3 1 52 26 3 5 43 44 10 53 18 4 2 87
P-Value 0.01 0.047 0.19 0.6
0.28
0.043
0.063
0.8
0.35
0.4
0.74
0.4
0.043
0.2
4.4. Early warning indicators by Round (2013/14 Vs 2014/15) As indicated in Fig. 6 bellow; In this survey, there is significant improvement in patient retention in care from 62% to 81% across all the facilities compared to the 2013/14 survey. This might be due to programmatic interventions, regular supervision and training of the staffs. Unlike, On time drug pick up is yet a challenge in this survey compared to 2013/14 round which indicated 11% decrease ( 28% to 17%). Drug supply continuity is also improved from 35% to 48% but yet more than half of the health facilities had challenges on drug supply continuity. Figure 6 Proportion of On time Drug pick up and patient retention in care by round (2013/14Vs 2014/15)
25
Figure 7 proportion of Drug supply continuity by round
Conclusion: Though there are improvements on performance of some of EWIs through time, on time pill pick up practice of patients attending the health facilities is yet a challenge to come up with the expected excellent performance. This might be alarming on patient adherence. Moreover, significant proportion of health facilities yet reported high proportion of stock out rate 12 month preceding the survey period. Some of the challenges might be, proper documentation related to pharmacy sections need more effort to clarify it, which might help for the head of the institutions and the programmers to use the data for future plan. Moreover, few sites were mentioning the presence of lower stocks of some drugs such as Neverapine and they were obliged to prescribe the drugs for some shorter periods like for two weeks until they got additional drugs from the main stores at a national level. To solve all these problems, intensive collaborative effort of the pharmacy versus clinical records is required.
26
5. RECCOMENDATIONS As individual HIVDR testing is neither recommended nor feasible in most low and middle income countries, the monitoring of patient and clinic factors associated with the emergence of preventable HIVDR is comparatively inexpensive and can be used to identify these factors and reduce their harmful consequence. EWIs are ART site variables designed to be monitored in all (or are representative ART sites ) ART sites within a country and permit countries to make evidence based recommendation about ART program function and take an action to minimize the emergency of preventable HIVDR both at the national and ART site level without requiring laboratory testing. EWI monitoring also identifies successful clinics that could serve as best practice models to other clinics. EWI monitoring results in general can be used to improve patient and clinic management. Ethiopia begun to implement the WHO recommendations in the EWI collection activities in 2007 when it adopted the generic WHO developed tools for EWI collection as part of the global HIV DR strategy. The overall objective was to integrate early warning indicator collection into the national ART program as a routine practice. Considering the on time pill pick up as indicator of population-level adherence to ART, only 20% of the health facilities achieved excellent performance; this may indicate that patient adherence to medication is yet a challenge. Therefore, further investigation is required to dig out the contributing factors for the low performance of this early warning indicator for programmatic intervention.
Performance of health facilities in patient retention in care is improving though time which has to be maintained. Of facilities is optimum 81% compared to WHO recommendation but a number of health facilities 19% had below the expected excellent performance in retention in care, therefore efforts should be made to investigate and intervene on factors contributing for the low performance of patient retention in care.
27
Our results also showed that good dispensing practices are performed in all the ART sites. This good performance would likely be due to the ongoing efforts in training pharmacy professionals working in the facilities which have greatly contributed to the conformity of dispensing habits with national guidelines and hence it should be maintained. The extent to which stock outs of routinely used ARVs were reported is worrisome in most facilities. Only 48% (43/89) of ART sites reported that they did not have stock out of any of the ARV drugs over the 12 month proceeding the survey period. The high rate of discontinuity in drug supply would have decreased adherence to the ART program, delay in drug pick-up and HIVDR emergency. This indicate strong effort must be done in strengthening drug supply management (forecasting, procurement, and supply distribution) systems as the availability of drug stock is one of the key factors in preventing HIVDR. Moreover, this study revealed that facilities should regularly monitor stock card and bin card as well as should also timely report consumptions. Training pharmacy store personnel's and timely delivering ARV drugs could also contribute for the sustainable supply chain system of ARV drugs. In general the finding of this survey thus can be seen as part of ongoing process to identify and solve problem within an existing program. ART site with suboptimal performance achievement are expected to identify appropriate program interventions to improve daily practices in order to reduce or minimize the expansion of HIV drug resistance and to provide the best care and treatment for their patients. Improvements in follow-up procedures, adherence support, continuous drug supply, are some of aspects that need to be done to improve the performance of ART site to limit the risk of emergency of HIVDR. The number of sites covered by the survey is small compared to the total number of health facilities in the country. Further effort should be made to incorporate minor adjustments in existing Health Management Information System (HMIS), which will facilitate abstraction of WHO recommended EWIs in the future and hence EWIs will be routinely monitored at all ART site and reported as an ongoing activity and can be used to make national statements about national and site-specific programmatic functioning in the context of HIVDR and related factors.
28
6. LIMITATIONS
In this survey, only three private health facilities were included which would be difficult to generalize the service delivery quality by the private sectors.
The number of health facilities included in this survey were limited (89) while there are more than 1,000 ART sites in the country, there for representation might be the issue in this survey.
29
7. ACKNOWLEDGMENTS This survey was financially supported by WHO-E. Moreover, technical assistances were obtained from WHO-E and CDC-E country office. The regional health bureaus, hospitals and health centers participating in this survey are highly acknowledged for their unreserved support during the survey. Moreover the ART clinic staffs working in the selected site need to be acknowledged for their support in providing the necessary records, information and assistance during the data collection. Staffs involved in the survey from WHO-E, EPHI, CDC-E and data collectors are highly appreciated for dedication and hard work in the data collection process.
30
ANNEX-1; DESCRIPTION OF EARLY WARNING INDICATORS (EWIs)
Indicator
Description
Early Warning
Proportion of patients Red: 90% first pick-up after the baseline pick-up “On time” as it relates to pill pick-up is defined as a patient picking up their ART within 7 days of their previous prescription running out if taken according to schedule
indicator 1: On time pill pick-up
Status and target
Numerator/Denominator
Variables required to calculate EWI
Numerator: Number of patients picking up their ART “on time” at the first drug pickup after baseline pick-up date
Date of first ARV drug pickup (baseline) ARV drugs picked up at baseline Number of days of ART picked up at Baseline Date of first ARV drug pick-up after baseline pick-up date
Denominator: Number of patients who picked up ARV drugs on or after the designated EWI sample start date Date of death after baseline pick-up (if applicable) Date of transfer out after baseline pickup (if applicable) Date of ART stop without restart after baseline pick-up (if applicable)
1
Early Warning Indicator 2: Retention in care
Early Warning indicator 3: Pharmacy stock-out
Early
Percentage of adults and children known to be alive and on treatment 12 months after initiation of ART
Percentage of months in a designated year in which there were no ARV drug stock-outs
Percentage of adults or
Red: 85% retained after 12 months of treatment
UNGASS/PEPFAR/Global Fund numerator and denominator
Denominator: Total number of adults and children who initiated ART who expected to achieve 12-month outcomes within the reporting period The denominator excludes transfers out. The indicator includes children. There is now no separate paediatric EWI
Red: 0% dispensing of
Numerator: Number of patients who pick up from the 2
ART regimen picked-up at
Warning Indicator 4: Dispensing practices
children being dispensed a mono or dual drug regimen
mono-or dual therapy
pharmacy, a regimen consisting of 1 or 2 ARVs
Green: 100% dispensing of mono-or dual therapy
Denominator: Number of patients
baseline pickup Was it a Mono or Dual Therapy regimen (Yes or No)
picking up ART on or after the designated EWI sample start date This new indicator assesses the percentage of adults and children being dispensed mono or dual ARV therapy Early Warning Indicator 5: Viral load suppression
Percentage of patients receiving ART at the site after the first months of ART whose viral load is