AKNOWLEDGEMENTS. The authors are thankful to Leif Olsson from Göteborg. Energi for supplying field aged cables and to Peter Werelius from Programma AB ...
Determination of Moisture Content in Mass Impregnated Cable Insulation Using Low Frequency Dielectric Spectroscopy Roberts Neimanis
Tapan K. Saha, Senior Member, IEEE
Roland Eriksson, Senior Member, IEEE
Royal Institute of Technology Stockholm, Sweden
University of Queensland Brisbane, Australia
Royal Institute of Technology Stockholm, Sweden
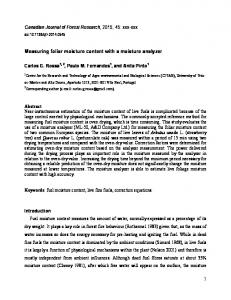
Abstract: The variations in the low frequency dielectric spectra of mass impregnated insulation depending on its moisture content have been investigated. For the calibration purposes a number of the impregnated paper samples was kept in the desiccators where different relative humidities were maintained. Thus obtained moisture content in the samples ranged from 1 % up to 6 %. The variations of the complex capacitance in a frequency range 0.001…1000 Hz were measured on these samples as well as on paper previously dried at elevated temperatures under vacuum. The moisture content of the dried samples determined was in a range 0.2-0.5 %. Moreover the study of water penetration in a 12 kV mass impregnated cable sample was carried out. Continuous measurements of the dielectric spectra revealed the dynamics of water ingress in the cable insulation. Keywords: mass impregnated cable, oil-paper insulation, dielectric spectrum, moisture content, Karl Fischer titration.
I.
INTRODUCTION
Today’s medium voltage (6-33 kV) networks are reinforced by new XLPE insulated cables; however, the percentage of mass impregnated cables in these networks is still considerable. Generally the installation of mass impregnated cables took place up to several decades back, thus inevitable degradation of their insulation properties may have developed. The replacement of the old mass impregnated cables is a long-term strategy and a number of criteria (timing, investments, etc.) are involved. Nevertheless network companies attempt to reduce the fault frequency and related expenses by monitoring of the insulation condition and maintenance of the existing mass impregnated cables. A variety of factors influence the performance of impregnated paper insulation. Among these factors moisture is one of the most common causes of deterioration of the insulation properties and premature ageing. Moreover, it is not necessarily that moisture penetrates the insulation from outside due to leakage in the lead sheet. Ageing (natural, thermal) of cellulose only can produce certain amount of water, which then acts as catalyst for further ageing. Therefore, non-destructive estimation of the moisture content is an important assessment of the insulation condition. Bearing in mind requirement for non-destructive means and taking advantage of recent developments the studies were made using dielectric response measurements in frequency and time domain. In case of oil-paper insulation it is already proven [1, 2, 3] that dielectric response is sensitive to the variations of moisture content in impregnated paper. However, calibrated measurements or charts of dielectric
response for different water contents in either of the domains have rarely been published.
II.
EXPERIMENTAL TECHNIQUE
A number of impregnated paper samples were collected from a 20 years service aged 12 kV mass impregnated cable. Half of the samples were taken from the belt insulation, while the other half from the insulation of different phases. These paper samples were vacuum dried at temperature of 110ºC for 24 hours and then at temperature of 140ºC for one hour. During drying the vacuum was maintained in a range of 0.020.1 mbar, so the expected moisture content was below 0.5 %. In order to obtain different moisture contents in the samples, six desiccators with saturated salt solutions were prepared. The salts used and corresponding relative humidities [5] and measured relative humidities in the dessicators are given in Table 1. Table 1. Salts to maintain different relative humidities
Salt
LiBr LiCl CH3COOK MgCl2 NaI NaBr
Relative humidity given in [5] [%] 6.6 11.0 22.5 33.1 39.5 59.5
Measured relative humidity [%] Not measured 9 22 26 33 50
Three samples from the belt insulation and three samples from phase insulation were placed in each of desiccators. The storage time in desiccators was about 3 weeks. A specially designed test cell was built to measure the dielectric response of the single layers of the impregnated paper. The test cell consisted of two plane electrodes pressed at each side of a test specimen. The pressure applied on the electrodes was 500 kPa. A guard electrode surrounding the measuring electrode was used to prevent possible leakage currents. The measurements of dielectric response were performed in a plastic glove bag filled with dry nitrogen. The desiccator with the samples as well as all necessary equipment for changing samples, vials for Karl Fischer titration and other instrumentation were first placed into glove bag. Then air was purged out and nitrogen was introduced. The relative humidity inside the glove bag was about 8-13%, while temperature variations were in a range 20-22ºC.
The changes of the complex relative permittivity of the impregnated paper samples were measured as a function of frequency in a range 0.001 to 1000 Hz at 5 V. Additionally, a number of charging/discharging current measurements were performed in several occasions covering different moisture contents. These measurements were carried out using Keithley 6517 electrometer and its built in voltage source to charge samples. The charging voltage was 50 V. Directly after the last measurement, one or two samples were taken for the determination of the moisture content.
3
10
wc = 0.18% wc = 1.52% wc = 2.12% wc = 2.60% wc = 3.51% wc = 4.16% wc = 5.19% 2
ε'
10
III.
RESULTS AND DISCUSIONS 1
10
A. Moisture determination Karl Fisher coulometric titration was used to measure the moisture content of the paper. The total number of the samples subjected to dielectric measurements was 36 including dried samples and the average moisture contents based on the number of the samples are given in Table 2.
0
10
-3
10
-2
10
-1
10
0
1
10
2
10
3
10
10
frequency, [Hz]
Table 2. Average moisture content in the investigated impregnated paper.
Saturated salt solution LiBr LiCl CH3COOK MgCl2 NaI NaBr Dry impr. paper
Number of samples 6 6 6 6 4 4 4
Fig. 1. Real part of complex relative permittivity for different moisture contents.
Average moisture content [%] 1.61 2.04 2.74 3.58 3.99 5.08 0.20
104 wc = 0.18% wc = 1.52% wc = 2.12% wc = 2.60% wc = 3.51% wc = 4.16% wc = 5.19%
103
2
10
The dielectric response of the impregnated cable papers in frequency domain showed considerable variations with moisture content. Real and imaginary parts of complex permittivity and the loss tangent (tanδ) for different moisture levels are shown in Fig. 1-3. At highest moisture contents (> 5 %) very substantial increase in permittivity can be observed and the phenomenon of the low frequency dispersion becomes apparent at lower frequencies. Two main tendencies can be mentioned in connection with loss or imaginary part of the response: increase of minimal value and horizontal shift of curves towards higher frequencies. The latter can mainly be attributed to increase in DC conductivity of the paper. At low moisture contents and at very low frequencies a loss peak becomes visible; however, it disappears with an increase in moisture content. These observations are in agreement with previously reported results [1, 3]. In case when frequency responses of the samples are obtained from measurements of the complex capacitance, the geometry of the test object was known and the geometric capacitance was used to obtain complex permittivity. Since it is difficult to estimate the geometric capacitance of a mass impregnated cable with reasonable accuracy, the loss tangent
ε ''
101
B. Frequency domain
100
10-1
10-2
10-3 10-3
10-2
10-1
100
101
102
103
frequency, [Hz]
Fig. 2. Imaginary part of complex relative permittivity for different moisture contents.
is used for the comparison between the measurements on field installed cables and the measurements on the sample papers. As can be seen in Fig. 3 the loss tangent has a minimum, which tends to increase with moisture content in similar fashion as the loss part of complex permittivity. This indicates that one can directly relate the minimum of the loss tangent to certain moisture content in impregnated paper as reported in [1]. This relation is depicted in Fig. 4 where the measured minima of the loss tangent are correlated to the respective moisture contents by an exponential function.
tanδδ
10
1
1
10 wc=0.18% wc=1.52% wc=2.12% wc=2.60% wc=3.51% wc=4.16% wc=5.19%
0
10
-1
10
-2
10
-3
10
o
10 C o
20 C o
40 C o
60 C
0
10
o
80 C
tanδδ
10
-1
10
-2
10
-3
10 -3
10
-2
10
-1
10
0
10
1
10
2
10
-3
10
3
10
-2
-1
10
frequency, [Hz]
Fig. 3. Loss tangent of impregnated paper samples for different moisture contents.
Changes in temperature of oil impregnated paper gives rise to horizontal shift of the frequency response as shown in Fig. 5, while its shape remains unchanged. However, the minimum of the loss tangent is insensitive to the temperature variations, which is of great advantage in case the measurements are performed without accurate knowledge about temperature conditions. C. Time domain The measurements of charging and discharging current were performed mainly for comparison purposes. As can be 0,014
1
10
10
2
3
10
seen in Fig. 6 the magnitude of the charging current increases about 30 times when moisture content changes from 0.2 % up to 4.2 %. Similar behaviour can be observed for discharging currents (see Fig. 7). The discharging currents for lower moisture contents follow so called “general response” law [4]. However, the increase in moisture content gives rise to a non-linear behaviour at longer times, which results in more than two slopes for the discharging current. It may be caused by some electro-chemical reaction in the paper due to presence of larger amount of water and its effect is enhanced by temperature [3]. From the time domain measurements the conductivity of the test object can be estimated from the charging and discharging currents as follows [2]:
ε0 (i pol (t ) − idep (t )), C 0U 0
(1)
where C0 is the geometrical capacitance of the test object, U0 is the charging voltage and ε0 is permittivity of free space. Thus calculated conductivities of the investigated paper samples are given in Table 3.
0,01 minimum tan δ
0
Fig. 5. Temperature dependence of loss tangent of dry oil impregnated paper (moisture content wc