Sensors and Materials, Vol. 24, No. 3 (2012) 115–126 MYU Tokyo S & M 0873
Determination of Ultrasonic Sensor Ability for Use as Guidance Sensors of Mobile Robots Hassan Masoudi*, Reza Alimardani1, Mahmoud Omid1, Seyed Saeid Mohtasebi1 and Noboru Noguchi2 Department of Agricultural Machinery Engineering and Mechanization, Shahid Chamran University, Ahvaz, Iran 1Department of Agricultural Machinery Engineering, University of Tehran, Karaj, Iran 2VeBots Laboratory, Graduate School of Agriculture, Hokkaido University, Sapporo, Japan (Received January 13, 2011; accepted May 30, 2011) Key words: ultrasonic sensor, orientation, position, mobile robot, greenhouse
In this study, we have evaluated the ability of ultrasonic sensors to produce guidance signals for greenhouse application robots. First, one high-quality ultrasonic sensor was selected and some basic experiments were carried out. Experimental results showed that with predetermined internal parameters, the accuracy of the selected sensor was good for distances between 15 and 215 cm and angles between 0 and 30°. The maximum width of view of each sensor was 17.15 cm for flat surfaces and 33.20 cm for round surfaces. From these results, the final configuration of sensors around the robot was determined. With a designed averaging algorithm, it was possible to calculate the averages of orientation and position with high accuracy from ultrasonic sensor outputs. Also, from comparison with data from reference sensors, the maximum error and root mean square error (RMSE) for orientation and position were 11.23°, 4.036° and 3 cm, 0.714 cm, respectively.
1.
Introduction
Applications of robots in greenhouses have many advantages such as reducing labor requirements, minimizing human hazards, and increasing the quality and quantity of products. Many researchers have reported automatic vehicle applications in agriculture. Cho and Ki applied fuzzy logic controller (FLC) and machine vision technologies for an autonomous speed sprayer in an orchard.(1) Machine vision was used to determine Corresponding author: e-mail:
[email protected]
*
115
116
Sensors and Materials, Vol. 24, No. 3 (2012)
vehicle orientation, and four ultrasonic sensors were used to detect obstacles during the operation. The results of simulation and field test showed that the speed sprayer could be operated autonomously by the FLC. Toda et al. developed a navigation method for a mobile robot via sonar-based crop row mapping and fuzzy logic control.(2) Crop rows are exploited for automatic navigation of a mobile robot without needing to construct artificial landmarks. Iida and Burks reported the measurement of the relative position between a tree canopy and a vehicle using ultrasonic sensors for the navigation of a tractor to work in orchards.(3) Singh et al. built an autonomous robotic vehicle for greenhouse spraying.(4) A fuzzy-logic-based proportional-derivative (PD) controller was developed to navigate the vehicle through simulated greenhouse aisles using range information provided by ultrasonic sensors. Shin and Kim developed an autonomous guidance system for a small orchard sprayer with ultrasonic sensors.(5) The design of automatic guidance systems includes two main steps: guidance signal production and controller design.(6) When one vehicle is driven manually, the driver sees the path continuously and compares it with the desired path and corrects errors for vehicle driving. To replace an automatic guidance system with a driver, this close loop should be repeated. Many methods have been developed for agricultural robot guidance according to the manner of obtaining guidance signals from the field such as dead reckoning, machine visions, GPS-based guidance, laser sensors, and so on. Many researchers have reported studies on guidance signals produced by mechanical systems,(7–13) electrical signals,(14–18) machine vision(19–21) and GPS-based methods(22–25) for autonomous agricultural vehicles (AAVs). We see that during the last decade, the methods of producing guidance signals have changed from mechanical systems to GPSbased systems. In each project, according to desired objectives, available conditions, and facilities, one or more of these methods are used. The combination of these methods will increase the accuracy and performance of the system. The main objective of this project was to make a mobile robot for greenhouse applications. Ultrasonic sensors were used to produce guidance signals. In this work, we studied the possibility of using the outputs of ultrasonic sensors as guidance signals for the robot and finding the best configuration of ultrasonic sensors around the robot. The results of basic experiments for obtaining the position and orientation of the robot from the outputs of ultrasonic sensors will also be considered.
2.
Materials and Methods
2.1 Ultrasonic sensors
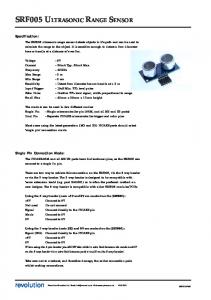
Eight ultrasonic sensors (USS3, Best Technology Company, Japan) were used in the experiments [Fig. 1(a)]. USS3 is an ultrasonic device that measures the reflection time of the supersonic wave. The USS3 sensor has internal signal processing units that remove noises and give us a ready data of distances. It is possible to combine two or more devices with a multi-dropped connection. These sensors are connected together in parallel and to a laptop computer via an interface board (USS3 Configurator, Best Technology Company, Japan), as shown in Fig. 1(b). The performance of this sensor changes with changing amounts of internal parameters. The internal parameters should
Sensors and Materials, Vol. 24, No. 3 (2012)
117
(a)
(b)
Fig. 1. (a) USS3 ultrasonic sensor and its interface board. (b) Method of connecting USS3 sensors to computer.
be set at first. In the experiments, the internal parameters of sensors were selected for measuring 15–200 cm distances that are suitable in greenhouse applications. Also, when we use multiple USS3 sensors together, we encounter malfunction caused by interference from the ultrasound of other sensors. By using a SYNC connector in USS3, its timedivision processes will work automatically and suppress the interference. The response frequency of the USS3 sensor was 40 kHz.(26)
118
Sensors and Materials, Vol. 24, No. 3 (2012)
2.2 Reference sensors
An axial laser range finder (Leica Disto pro4a) was used for measuring actual distances. The Leica Disto pro4a stores up to 800 measured values and can transfer them via the interface to a computer. The Leica DISTO pro4a boasts an increased accuracy of ±1.5 mm. A fiber optic gyroscope (FOG) (JG-35FD, Japan Aviation Electronics Industry, Ltd.) was used as an angle reference sensor for orientation evaluation. This sensor obtained the actual angle data during the experimental run. This sensor’s drift angle accuracy is ±0.5 deg/h. A total station (APL-1, TOPCON Ltd.) was used as the positioning sensor to obtain the actual position (x, y axes) of the mobile target with an accuracy of ±3 mm for fine mode and ±10 mm for coarse mode. The total station was set to fine mode.
2.3 Data acquisition system
Software for acquiring data from all ultrasonic and reference sensors, noise removal, data fusion, and calculation of necessary parameters was developed using Visual Studio 2008 software with VC++ programming language. The ultrasonic sensors were connected to a laptop via a USB port. The FOG was connected to the laptop using an RS232 cable. Data of the total station were sent to the laptop via a Bluetooth serial RS232 adapter (Parani-SD100). During the experiments, the outputs of all the sensors were saved in the laptop and after that, statistical analysis was carried out using Microsoft Excel 2003 software. The average data-receiving frequency for all the sensors was 11 Hz.
2.4 Experiments
First, two sets of experiments were conducted to measure the accuracy of the sensors and find the best configuration of sensors around the robot. Then, the last experiment was carried out to determine the accuracy of the ultrasonic sensors in terms of orientation and position determination.
2.4.1 First experiment: sensor errors in measuring distances
The objective of this experiment was to determine the ultrasonic sensor accuracies in measuring distances from walls with different angles. The instruments of this experiment were a laptop computer, two USS3 ultrasonic sensors, an interface board, an axial laser range finder, and a carrier. The two ultrasonic sensors were put on the carrier with 22 cm intervals and connected to the laptop via an interface board. By moving the carrier in front of the vertical walls with 0 to 90° angles in distances from 15 to 250 cm, the output of both sensors was saved in the laptop memory. At the same time, the exact distances were measured using an axial laser range finder. Finally, the orientations and positions were extracted from the ultrasonic sensor data and compared with the actual sensor data.
2.4.2 Second experiment: actual detection area of ultrasonic sensors
In this experiment, one ultrasonic sensor was installed on a base vertically. One grid paper with 100×200 cm2 dimensions and 10×10 cm2 pixels was expanded in front of the sensor. Two plastic objects with flat (18×22 cm2) and round (7 cm radius and 20 cm height) surfaces were put in front of the sensor and moved in distances from 10 to
Sensors and Materials, Vol. 24, No. 3 (2012)
119
200 cm. In each pixel, detection of the objects by the sensor was considered. Finally, the actual detection area of the ultrasonic sensor was drawn using Solid Works 2003 software.
2.4.3 Third experiment: orientation and position determination by ultrasonic sensors
In this experiment, an artificial aisle was constructed from tables with vertical walls and 115 cm width and 500 cm length (Fig. 2). The wall surface was wooden and completely smooth. Eight ultrasonic sensors were connected to each other in parallel and installed around a carrier (4 sensors on the left and 4 sensors on the right). The sensors were connected to the laptop via a USB port. By moving the carrier inside the aisle in different paths (30 repetitions), the outputs of each sensor were saved in the laptop. For determining the accuracy of position and orientation, the outputs of reference sensors were also collected during experiments. Figure 3(a) shows steps of the position and orientation determination algorithm. In this algorithm, a median filter was used for noise removal, and an averaging method (described in the next section) was used for position and orientation determination.
2.4.4 Orientation and position determination
In each situation, the outputs of the ultrasonic sensors are the shortest distances from the objects. Thus, according to Fig. 3(b), the amounts of orientations and positions were calculated by an averaging method as follows: Calculation of orientation:
φlk(t) = sin–1(dlj(t)–dli(t))/w
(1)
φl(t) = (∑φlk(t))/num
(2)
φrk(t) = sin–1(drj(t)–dri(t))/w
(3)
Fig. 2. Experiment for position and orientation determination by ultrasonic sensors.
120
Sensors and Materials, Vol. 24, No. 3 (2012)
Start
Acquiring data from ultrasonic sensors Noise removal by median filter Position and orientation calculation by averaging method
End
(b)
(a)
Fig. 3. (a) Orientation and position determination steps. (b) Calculation of orientation and position by averaging method.
φr(t) = (∑φrk(t))/num
(4)
φ(t) = (φl(t)+φr(t))/2
(5)
where i = 1, 2, 3, j = 2, 3, 4, and k = 1, 2, 3, 4, 5, 6 φlk(t): orientation from i, j sensors in the left side in time t (deg) φl(t): orientation average of the left-side sensors in time t (deg) φrk(t): i, j sensor orientation in the right side in time t (deg) φr(t): orientation average of the right-side sensors in time t (deg) φ(t): final orientation in time t (deg) dli(t) and dlj(t): output of sensor i or j in the left side in time t (cm) dri(t) and drj(t): output of sensor i or j in the right side in time t (cm) w: distance between two sensors in one side (= 22 cm) num: number of USS3’s in each side (= 4) Calculation of position:
eli(t) = dlj(t)–((wp–wu)/2)
(6)
el(t) = (∑eli(t))/num
(7)
121
Sensors and Materials, Vol. 24, No. 3 (2012)
eri(t) = ((wp–wu)/2)–dri(t)
(8)
er(t) = (∑eri(t))/num
(9)
e(t) = (el(t)+er(t))/2
(10)
where i = 1, 2, 3, 4 eli(t): position from sensor i in the left side in time t (cm) el(t): average of positions of the left-side sensors in time t (cm) eri(t): position from sensor i in the right side in time t (cm) er(t): average of positions of the right-side sensors in time t (cm) e(t): final position in time t (cm) wp: width of path (= 115 cm) wu: distance between USS3 sensors in left and right sides (= 44 cm)
3.
Results
3.1 First experiment
The results of the first experiment are shown in Table 1. From these results, we can conclude that for high accuracy, the distance between sensors and objects should be more than 15 cm. Also, if we want to detect all objects in front of the robot, its maximum turning angle should be 30°. Minimum errors in sensor outputs and the best detection are obtained in the straight direction (0°). Figure 4 shows the percentage of errors in the outputs of the USS3 sensor for different distances. It is shown that for low distances, the error is high. The maximum error was at 15 cm and equals 5.49%. By increasing the distance, the amount of
Table 1 Results of first experiment.* φ 0 10 20 30 40
15 +
20 + +
30 + + + + +
40 + + + + +
50 + + + + +
d 60 + + + +
70 + + + +
80 + + + +
90 + + +
100 >100 + + + +
Distance unit is cm and angle unit is degrees, + sign means that detection occurred at that position.
*
122
Sensors and Materials, Vol. 24, No. 3 (2012)
Outputs Error (% )
6 4 2 0 -2
0
-4
50
100
150
200
250
Actual Distance (cm)
-6 Fig. 4. Errors of USS3 ultrasonic sensor outputs for different distances.
error decreased and reached 0% in about 100 cm, but for more than 100 cm, the error increased again, and for more than 210 cm, it increased very much.
3.2 Second experiment
From this experiment, we used the results for the determination of the number of ultrasonic sensors around the robot. Figure 5 shows the detection area of the USS3 ultrasonic sensor for the flat and round surface objects. The maximum widths of the detection area were 17.15 and 33.20 cm for the flat and round surfaces, respectively. Therefore, the distance of the two sensors on the robot chassis should be less than 33.20 cm. Since the dimensions of the robot are 60×90 cm2, two ultrasonic sensors are therefore needed for the front and rear of the robot and three of them are needed for its left and right sides.
3.3 Third experiment
Figure 6 shows a sample of the ultrasonic sensor output before and after noise removal. The noise of the ultrasonic sensors is random, so the best method for removing it is to use a median filter. From this figure, one can see that this filter can remove noise very well. Using this filter will result in about a 0.5 s time delay in the final output of the sensors, which has a bad effect on the exact guidance of the robot in a desired path at high speed. Fortunately, the speed of the robot is low during operation in greenhouses, so this delay does not have much effect on the exact guidance of the robot. Figure 7(a) shows the carrier positions determined from the ultrasonic sensor outputs and its actual positions determined from the total station data. We can see that the averaging algorithm can be used to calculate the position well from the corrected outputs of the sensors. Because of the time delay in the sensors’ final output, there is also a 0.5 s time delay in the positions. The maximum error is 3 cm with a root mean square error (RMSE) of 0.714 cm. The results of Singh et al.(4) showed an average RMSE of about 2.5 cm for aisles with 61 cm width. The amount of RMSE here is less than that in the results of Singh et al.(4) because they used only one sensor at each side of the robot but we used
123
Sensors and Materials, Vol. 24, No. 3 (2012)
Fig. 5. Detection area of USS3 ultrasonic sensor for flat (left) and round (right) surface objects.
Distance (cm)
Actual output of ultrasonic sensor Corrected output of ultrasonic sensor
Time (s)
Fig. 6. USS3 ultrasonic sensor outputs.
four sensors at each side. We can conclude that if more sensors are used, we will have more accuracy in determining the robot’s position, but it will increase the cost of the system. Therefore, we should select the number of sensors according to the required accuracy and amount of available money. Figure 7(b) compares the orientation from ultrasonic sensors and the actual orientation from the FOG sensor. It is shown that the averaging method can be used to calculate the orientation from the corrected outputs of ultrasonic sensors. Because of the time delay in the sensors’ final output, there is also about a 0.5 s time delay in orientation, so we should try to decrease this time delay. The maximum error of orientation was 11.23° and its RMSE was 4.04°.
124
Sensors and Materials, Vol. 24, No. 3 (2012)
(a)
Distance (cm)
Angle (Deg)
Headingerror errorfrom from ultrasonic sensors (Deg) Lateral ultrasonic sensors (cm) heading from fromsurveying FOG (Deg) Actual position instrument (cm)
Time (s)
Time (s)
(b)
Angle (Deg)
Heading error from ultrasonic sensors (Deg) Actual heading from FOG (Deg)
Time (s)
Fig. 7. (a) Position from ultrasonic sensors and actual position from total station. (b) Orientation from ultrasonic sensors and actual orientation from FOG.
4.
Discussion
The best distances for using the USS3 sensor are 15–200 cm, and at distances of more than 210 cm, we should change its predefined internal parameters. Fortunately, the common aisle width in greenhouses is 40–200 cm, so we can use the USS3 sensor in the greenhouse robot without changing the amounts of internal parameters. According to the results of the second experiment, if we want to detect all the spaces around the robot, the distance between two sensors on each side should be between 17 and 33 cm. Therefore, the sensors will be installed 30 cm from each other. By having three sensors on the left and right sides and two sensors on the front and rear sides, the surrounding area of the robot will be detected completely. In total, 10 USS3 sensors are needed for guidance signal production and obstacle detection. Thus, the final configuration of the sensors
Sensors and Materials, Vol. 24, No. 3 (2012)
125
Fig. 8. Final setup location of ultrasonic sensors around the robot.
around the robot is as shown in Fig. 8. From the results of this experiment, we can see that the accuracy of ultrasonic sensors in determining position is very good and sufficient for greenhouse applications, but the results for orientation are not accurate. Thus, for distances less than 15 cm and angles more than 30°, it should be used from auxiliary sensors. By fusing the results of orientation from ultrasonic sensors and the output of extra angle sensors, we can determine the exact orientation of the robot.
5. 1. 2. 3. 4.
Conclusions The main objective of this research was to build a mobile robot for greenhouse applications. From the experiment results in this study, we can conclude that: It is possible to use ultrasonic sensors for guidance signal production of a robot, and we can determine the position and orientation of the robot from ultrasonic sensor output by the averaging method. The best configuration of the ultrasonic sensors around the robot was found from the detection area of the ultrasonic sensor. The maximum turning angle of the robot with selected internal parameters of the sensor is 30°. Minimum error in the ultrasonic sensor output and the best detections are attained in the straight direction (0°).
126
Sensors and Materials, Vol. 24, No. 3 (2012)
Acknowledgements The authors thank the Vice-President for Research and Technology of Shahid Chamran University of Ahvaz and the University of Tehran, Iran, for financial support of this project. Sincere appreciation also goes to the staff of VeBots Laboratory, Graduate School of Agriculture, Hokkaido University, Japan, for providing facilities and kind participation in this research.
References 1 S. I. Cho and N. H. Ki: Trans. ASAE 42 (1999) 1137. 2 M. Toda, O. Kitani, T. Okamoto and T. Torii: J. Agric. Eng. Res. 72 (1999) 299. 3 M. Iida and T. F. Burks: Automation Technology for Off-Road Equipment Conference Proceedings, Chicago, Illinois, USA, 26–27 July 2002 (ASABE, St. Joseph, 2002) p. 221. 4 S. Singh, T. F Burks and W. S. Lee: Trans. ASAE 48 (2005) 2355. 5 B. Shin and S. Kim: ASAE Paper 011193 (2001) p. 97. 6 N. D. Tillett: J. Agric. Eng. Res. 50 (1991) 167. 7 L. R. Parish and C. E. Goering: Trans. ASAE 13 (1970) 523. 8 M. A. Grovum and G. C. Zoerb: Trans. ASAE 13 (1970) 565. 9 M. B. Widen and J. R. Blair: J. Agric. Eng. Res. 17 (1972) 10. 10 D. J. Hilton and A. A. W. Chestney: Agric. Eng. Autumn 28 (1973) 102. 11 K. Masayuki: Agricultural Mechanization in Asia, Africa, and Latin America (AMA) 6 (1975) 83. 12 A. V. Kaloev and Z. B. Liberfarb: Mechanization and Electrification of Socialist Agriculture 4 (1976) 17. 13 K. Kawasaki, N. Itokawa and S. Ito: Bull. Shikoku Agric. Exp. Station 37 (1981) 143. 14 G. O. Harries and B. Ambler: J. Agric. Eng. Res. 26 (1981) 33. 15 N. Kawamura and K. Namikawa: Research Report on Agricultural Machinery 14 (Kyoto University, 1984). 16 G. Lawson: Grower 10 (1985) 24. 17 I. Shmulevich, G. Zeltzer and A. Brunfield: Trans. ASAE 32 (1989) 425. 18 K. W. Gray: Obstacle Detection and Avoidance for an Autonomous Farm Tractor, M.Sc. Thesis in Electrical Engineering (Utah State University, Logan, Utah, USA, 2000). 19 J. F. Reid and S. W. Searcy: Trans. ASAE 31 (1988) 1624. 20 Q. Zhang, J. F. Reid and N. Noguchi: UILU-ENG-99-7013 (1999). 21 E. Morimoto, M. Suguri and M. Umeda: Agric. Eng. Int.: CIGR J., PM 01 009 IV (2002). 22 T. Bell: Comput. Electron. Agric. 25 (2000) 53. 23 M. W. Veal, S. E. Taylor, T. P. McDonald, D. K. McLemore and M. R. Dunn: Trans. ASAE 44 (2001) 1903. 24 B. Thuilot, C. Cariou, P. Martinet and M. Berducat: Auton. Robots 13 (2002) 53. 25 F. Rovira-Más, S. Han, J. Wei and J. F. Reid: The ASAE Meeting Presentation, Paper Number: 051156 (2005). 26 Anonymous: USS3 Ultrasonic Sensor, www.besttechnology.co.jp (accessed 2008).