goods (Olowolayemo, Martin and Raymond, 1993; Hudson and Vertin, 1985; ...... 1981; Berthiaume et al., 2006; Comerford, Harpster, and Baumer, 2001; Myers ...
Determining Consumer Perceptions of and Willingness to Pay for Appalachian Grass-fed Beef: An Experimental Economics Approach Jason R. Evans Dissertation submitted to the Davis College of Agriculture, Forestry, and Consumer Sciences at West Virginia University in partial fulfillment of the requirements for the degree of Doctor of Philosophy in Natural Resource Economics Gerard E. D’Souza, Ph.D., Chair Cheryl Brown, Ph.D. Alan Collins, Ph.D. Edward B. Rayburn, Ph.D. Mark Sperow, Ph.D.
Agricultural and Resource Economics Program Division of Resource Management Morgantown, WV 2007
Keywords: experimental economics, grass-fed beef, experimental auctions, willingness to pay
ABSTRACT Determining Consumer Perceptions of and Willingness to Pay for Appalachian Grass-fed Beef: An Experimental Economics Approach Jason R. Evans The U.S. market for commoditized beef is a dynamic one that has, over the last 30 years, seen decreases in per capita consumption and an increased reliance on large, integrated feedlot facilities that focus on efficient weight gain and producing carcasses deemed desirable according the USDA quality grading system. Because of the problems inherent in the conventional production system and the existence of farm-to-retail price spreads that do not favor primary cow-calf producers, analyses of alternative beef production and marketing strategies that facilitate enhanced profitability and simultaneously address surging consumer demand for specialty food products are necessary. To that end, focus of the current study was on the market potential for grass-fed beef products in the Appalachian region, given that these products embody observed, experience, nutritional, and process attributes that may appeal to a large consumer base. Specifically, a variant of the Becker-DeGroot-Marschack experimental auction mechanism was employed in grocery stores in Morgantown, WV and Pittsburgh, PA in order to determine consumer preferences and willingness to pay for grass-fed steak and ground beef products. A majority of beef consumers sampled preferred the grass-fed products in both steak and ground beef experiments and were willing to pay a price premium in order to obtain them. Via cluster analysis, target market segments were identified and it was concluded, in general, that consumers would respond positively to the availability of these products in the retail sector, based largely on their superior nutritional content and core observed attributes.
Acknowledgements I would like to thank, first and foremost, my committee chair Dr. Gerard D’Souza for allowing me to work on this project since my admittance to WVU and for granting me significant freedoms in the research that has been completed to this point. While always providing useful guidance, his willingness to listen to new ideas and to include me in decisionmaking processes has encouraged my ambitious academic pursuits. I must also thank Dr. Cheryl Brown, Dr. Alan Collins, Dr. Edward Rayburn, and Dr. Mark Sperow for agreeing to be a part of this dissertation committee and for always being available for discussion. I admire each of their individual talents and attribute the ultimate success of this project to their collective efforts. A special word of thanks is due to Dr. Brett Kenney, who contributed a significant amount of his personal time to helping process the meat samples used in this study. In fact, this project would not have gotten off the ground without his selfless dedication. Thanks are also due to the students and faculty in the animal processing facility at the Preston County Educational Center who did an excellent job in ensuring that meat samples were processed and packaged correctly. Also, I must thank my good friends, Phil Griffith and Chris Bouquot, for donating their time to this project. Actual in-store experimental sessions would not have been possible without the help of my talented undergraduate assistants, Anna Harris, Jodi Smith, Andrea Young, and Tanya Nickerson. Further, I appreciate the guidance that I received from Dr. Susan Duckett of Clemson University in designing this experiment. My personal thanks goes to Melanie Jimmie, Ellen Hartley-Smith and Lisa Lewis for making my tenure here at WVU pleasant and problem-free. Finally, I wish to extend my gratitude to my parents, Alex and Florence Evans, who brought me up on a working cattle farm and instilled in me the desire to learn and the importance of hard work. This dissertation is dedicated to them.
iii
Table of Contents Abstract…………………………………………………………………………………… Acknowledgements……………………………………………………………………….. List of Tables and Figures……………………………………………………………….. Chapter I: Introduction 1.1. Background…………………………………………………………………... 1.1.1. The U.S. Market for Commodity Beef……………………………... 1.1.2. Grass-fed Beef: Production Principles and Product Attributes…….. 1.2. The Current Study……………………………………………………………. Chapter II: Review of Literature 2.1. Experimental Economics…………………………………………………….. 2.1.1. Experimental Auctions: Background………………………………. 2.1.2. Experimental Auctions: Tests of Theoretical Predictions………….. 2.1.3. Experimental Auctions: Applications in Beef Marketing Research.. 2.2. Market Segmentation………………………………………………………… Chapter III: Methodology 3.1. Conceptual Framework……………………………………………………….. 3.2. Experimental Procedures……………………………………………………... 3.3. Statistical Procedures…………………………………………………………. 3.3.1. Modeling Participant Preferences for Grass-fed and Grain-fed Prod.. 3.3.2. Modeling Participant Bidding Behavior…………………………….. 3.3.3. Cluster Analysis……………………………………………………... Chapter IV: Results 4.1. Survey Summary Statistics…………………………………………………… 4.2. Participant Preferences, Palatability Ratings, and Bidding Behavior………… 4.3. Statistical Models and Cluster Analysis………………………………………. Chapter V: Conclusions 5.1. Summary and Implications of Results………………………………………... 5.2. Study Limitations and Considerations for Future Research………………….. References………………………………………………………………………………... Appendices Appendix A. Advertisement for Participant Solicitation………………………….. Appendix B. Survey Instrument…………………………………………………… Appendix C. Sample Information Card…………………………………………… Appendix D. Palatability Rating Sheet……………………………………………. Appendix E. Preference/Bid Sheet………………………………………………… Appendix F. Probit Model Results for Steak Preference………………………….. Appendix G. Probit Model Results for Ground Beef Preference…………………. Appendix H. Censored Regression Model Results for Steak Bidding……………. Appendix I. Censored Regression Model Results for Ground Beef Bidding…….
iv
ii iii v 1 1 27 47 49 51 57 65 75 79 81 91 92 103 108 111 117 131 145 151 154 170 171 174 175 176 177 178 179 180
List of Tables Table 1-1. Percent of U.S. Beef Cow Inventory by Operation Size……………………… Table 1-2. Number of Small and Large Beef Cow Operations, 1993-2006……………… Table 1-3. Average Fed Cattle Slaughter Weights, 1965-2006…………………………... Table 1-4. Usage of Selected Inputs by U.S. Feedlot Operations (1999)………………… Table 1-5. USDA Beef Quality Grade Definitions and Frequencies……………………... Table 1-6. Real National Average Retail Beef Prices (2000 & 2007)……………………. Table 1-7. Mean Values for Performance Traits Across Days Fed………………………. Table 1-8. Summary of Fatty Acid Analyses……………………………………………... Table 2-1. Coppinger, Smith, and Titus (1980) Study Results…………………………… Table 3-1. Steak Experimental Treatments……………………………………………….. Table 3-2. Ground Beef Experimental Treatments……………………………………….. Table 3-3. Variable Definitions……………..…………………………………………….. Table 4-1. Experiment Venues……………………………………………………………. Table 4-2. Survey Summary Statistics……………………………………………………. Table 4-3. Survey Shopping Preferences/Behavior Summary Statistics…………………. Table 4-4. Participant Numbers for Experimental Treatments…………………………… Table 4-5. Within-Treatment Variable Means……………………………………………. Table 4-6. Stated Preferences…………………………………………………………….. Table 4-7. Stated Preferences by Treatment……………………………………………… Table 4-8. Steak Participant Preferences for USDA Quality Grade……………………… Table 4-9. Steak Palatability Ratings…………………..…………………………………. Table 4-10. Steak Palatability Rating Ranges…………….……………………………….. Table 4-11. Participant Bidding Behavior (Steak)………………………………………... Table 4-12. Participant Bidding Behavior (Ground Beef)………………………………... Table 4-13. Probit Model Results for Steak Preference…………………………………… Table 4-14. Probit Model Results for Ground Beef Preference…………………………… Table 4-15. Censored Regression Model Results for Steak Bidding Behavior…………… Table 4-16. Censored Regression Model Results for Ground Beef Bidding Behavior…… Table 4-17. Censored Regression Model Results for Steak Bidding (Grass-fed)…………. Table 4-18. Censored Regression Model Results for Ground Beef Bidding (Grass-fed)…. Table 4-19. Identified Clusters and Cluster Centers………………………………………
v
3 4 7 12 14 16 30 38 58 85 87 98 111 113 114 117 118 118 118 123 124 125 127 130 132 133 138 139 140 141 142
List of Figures Figure 1-1. Total Feedlot Placements by Month, 2006…………………………………… Figure 1-2. 20-Year Monthly Corn Price Averages………………………………………. Figure 1-3. U.S. Monthly Commercial Slaughter Average Live Weight………………… Figure 1-4. Heavyweight Cattle Price as a Percentage of Lightweight Cattle Price vs. Real Corn Price, 1975-2006………………………………………………….. Figure 1-5. U.S. Per Capita Beef Consumption, 1963-2006……………………………… Figure 1-6. U.S. Per Capita Chicken Consumption, 1963-2006………………………….. Figure 1-7. Beef Attributes……………………………………………………………….. Figure 1-8. Total Fat Content of Various Meat Products………………………………… Figure 1-9. Relationship of Omega-3 Content to Days on Feed…………………………. Figure 3-1. Flow Diagram of Experimental Protocol…………………………………….. Figure 4-1. Mean Participant Rankings of Beef Attribute Importance…………………… Figure 4-2. Responses to “Grass-fed” Definition Question………………………………. Figure 4-3. Primary Reasons for Grain-fed Preference, Steak……………………………. Figure 4-4. Primary Reasons for Grass-fed Preference, Steak……………………………. Figure 4-5. Primary Reasons for Grain-fed Preference, Ground Beef……………………. Figure 4-6. Primary Reasons for Grass-fed Preference, Ground Beef……………………. Figure 4-7. Cumulative Distribution for “Overall” Palatability Rating (Choice)…………. Figure 4-8. Cumulative Distribution for “Overall” Palatability Rating (Standard)……….. Figure 4-9. Cumulative Distribution for “Overall” Palatability Rating (Select)…………... Figure 4-10. Dispersion of Bids for Steak…………………………………………………. Figure 4-11. Cumulative Bid Distribution for Steak………………………………………. Figure 4-12. Dispersion of Bids for Ground Beef…………………………………………. Figure 4-13. Cumulative Bid Distribution for Ground Beef……………………………….
vi
5 9 9 11 17 17 22 36 37 90 116 116 119 119 120 120 125 126 126 128 129 130 131
CHAPTER I Introduction 1.1. Background As part of a USDA grant-funded multidisciplinary, multi-institutional research project aimed at assessing the biological and economic feasibility of grass-fed beef production systems in the Appalachian region, this study will focus on consumer perceptions of and willingness to pay for grass-fed beef products as determined through an in-store experimental auction mechanism. In order to put the research problem into perspective, this section (1.1) provides an overview of current conditions in the U.S. market for beef and addresses trends in the sector toward value-added production and consumer-driven quality differentiation. Attention will first be focused on the structure and implications of the conventional beef production process prevalent in the U.S. that involves cow-calf and feedlot operations. Next, the nature and determinants of the demand for commodity beef will be discussed, followed by an in-depth overview of forage-based cattle finishing systems and the attributes of grass-fed beef products that may influence consumer appeal. Specific study objectives will be addressed in Section 1.2. Ultimately, results from this analysis should elucidate the consumer and product characteristics that influence demand for grass-fed beef and the overall market potential for these specialty products.
1.1.1. The U.S. Market for Commodity Beef Beef Supply. Although far removed from the sentimental imagery of transient Texas Longhorn herds and the worn cowboys that accompanied them from one booming cow town to the next, the modern American cattle industry is a dynamic one, ever adapting to growing world demand for beef and widely varied consumer tastes. With the U.S. cattle inventory valued at an
1
estimated $33 billion ($70 billion retail equivalent) (USDA/ ERS,2007), changes in demand for beef and the supply risks inherent in agriculture have the potential to affect producer incomes and rural economies. The U.S. beef sector has seen the formation of massive feeding and packing conglomerates but still thrives on the primary production of small scale cow-calf operations, often family-owned and maintained as sources of secondary income or simply for the allure of “country” living (USDA/NASS, 2007). Each level of the production chain depends upon and reacts to the actions of the others while simultaneously facing the uncertainty posed by natural factors and reliance on numerous input markets. By the time the beef product reaches the dinner plate, its live form has passed through multiple distinct markets over a significantly longer period than is required for other agricultural commodities. An overwhelming majority of the live cattle slaughtered daily in the country originate from domestic sources (USDA/FAS, 2007). Generally, the animals are products of cow-calf operations where herds of adult females are maintained for breeding purposes. The prevalence of relatively small firms in this sector of the beef complex is reflective of the nature of livestock production—i.e., each cow-calf unit requires several acres worth of grazed or harvested forages (2-5 acres with adequate rainfall, up to 150 acres without)(Jones, 2001). In many areas of the country, topography and forest cover make having large expanses suitable for grazing or hay harvest practically impossible without significant investments in cultivation. In some regions where flat grazing acreage is abundant, drought and poor soil conditions severely limit stocking density potential and therefore require land holdings out of reach of the beginning entrepreneur or even the current producer wishing to expand his or her production capacity.
2
Table 1-1 illustrates that the sheer quantity of small firms in the sector makes their contribution to the supply chain much more relevant than that of the largest producers. In 2006, 85% of all productive beef cows in the U.S. were held by operations of less than 500 head and nearly half were on farms of less than 100 head (USDA/NASS, 2007). Table 1-2 indicates, however, that many small scale cattle producers exit the industry each year, with total small scale operations decreasing by over 18% from 1993 to 2006. In the same period, the number of large operations (100+ head) grew by approximately 9%, perhaps implying fundamental changes in the industry that necessitate large capacities for acceptable economic performance. This trend, however, is not unique to the beef industry. In fact, the Bureau of Labor Statistics of the U.S. Department of Labor has projected that the number of people engaged in small-scale farming enterprises of any sort will drop by over 13% from 1.3 million in 1998 to 1.1 million by 2008, the largest projected job loss among all occupations for that time period (Kawaai, 2001).
Table 1-1. Percent of U.S. Beef Cow Inventory by Operation Size (2006) No. Beef Cows/Operation
1-49 50-99 100-499 500+
% of Total U.S. Inventory
27.6% 18.6% 38.7% 15.1%
Source: USDA/NASS, 2007
Although a large proportion of cow-calf operators practice year-round, continuous calving, many U.S. cow herds are bred in the late summer for spring calving so as to avoid births in harsh weather and to assure abundant, high quality forage for the calves and their dams early in the growth process (Chicago Mercantile Exchange, 2004). Calves are generally weaned at 6-8 months of age at weights that vary according to genetic potential, milk quality, weather conditions, supplemental feeding regimens, and a host of other animal characteristics and 3
production decisions. A portion of the heifers from each calf crop may be retained for herd expansion or replacement of cows culled because of low productivity, old age, etc.
Table 1-2. Number of Small and Large Beef Cow Operations, 1993-2006 Year 1993 1994 1995 1996 1997 1998 1999 2000 2001 2002 2003 2004 2005 2006 % CHG
No. Herds with 1-49 Head 721,950 720,150 716,150 703,850 692,400 678,350 666,850 654,750 639,150 633,660 620,050 601,950 596,950 590,550 -18.2%
No. Herds with 100+ Head 72,110 73,990 76,050 75,720 76,210 75,710 76,270 76,580 76,480 76,120 75,745 77,330 78,180 78,580 +9.0%
Source: USDA/NASS, 2007
After weaning, calves not retained are marketed through one of several channels (predominantly auctions) and subsequently enter either the stocker phase in which they are grazed on summer grass, winter wheat, or some harvested forage up to end weights of 600-800 pounds or directly enter the finishing phase in a feedlot (National Research Council, 2003). Feedlots are formally classified according to the U.S. EPA as “Animal Feeding Operations” (AFOs), or, “lots or facilities where animals have been, are, or will be stabled and confined and fed or maintained for a total of 45 days or more in any 12 month period, and where crops, vegetative forage growth, or post harvest residues are not sustained in the normal growing season over any portion of the lot or facility” (National Research Council, 2003). The trend toward intensive grain feeding in feedlots began after World War II, when the post-war surplus of grain allowed cattle feeders to inexpensively fatten cattle with high energy inputs (McCluskey
4
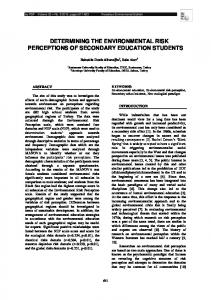
et al., 2005). By the early 1970s, beef from grain-fattened cattle was prevalent in supermarkets across the country, and consumers became conditioned to the flavor, juiciness, and tenderness of these feedlot-finished products (Schupp, Binder, and Clark, 1980). In 2006, nearly 81% of all steers and heifers slaughtered at commercial facilities in the U.S. were fed to finish weights in feedlots (USDA/NASS 2007). Large feedlots typically have continual movement of feeder cattle in and finished cattle out, with seasonal highs and lows in occupancy. Since the major input for cattle feeding firms are the feeder calves themselves, seasonal peaks and troughs in feedlot inventories are dictated by the production timing of individual cow-calf producers. Since, as mentioned earlier, many calf producers choose spring calving, feedlot inventories rise each year as the spring calf crop is weaned or as stocker cattle come off of summer pasture (USDA/NASS, 2007). Figure 1-1 illustrates this trend. As is clear, placements peak in August through October for the reasons mentioned above and also increase in mid-spring when stockers in the west are pulled off winter wheat pastures.
Figure 1-1. Total Feedlot Placements by Month, 2006 3000
2000 1500 1000 500
DECEMBER
NOVEMBER
OCTOBER
SEPTEMBER
AUGUST
JULY
JUNE
MAY
APRIL
MARCH
FEBRUARY
0 JANUARY
1,000 Head
2500
Month
5
Across the U.S., approximately 98% of all feedlots hold less than 1,000 head at any given time (USDA/NASS, 2007). However, only 18% of all feedlot-finished cattle come from these small operations, while 57% are finished in feedlots with capacities of 16,000 head or more (USDA/NASS, 2007). Since 1996, the number of feedlots with less than 1,000 head capacity has decreased by 16.5%, while the number of 32,000+ capacity operations has increased by 14.5% (USDA/NASS, 2007). Twenty-five years ago, cattle industry experts thought that a 25,000-head feedlot would maximize cost savings from economies of scale and that larger holdings would prove too costly (Public Broadcasting Service, 2002). The industry soon learned that those self-imposed limitations were nowhere near the truth—in today’s feedlot sector, there are a number of 100,000+ head operations and commentators agree that inventories have yet to be pushed to the point that economies of scale end (Public Broadcasting Service, 2002). Space allocations per animal in feedlots of all sizes generally range between 70 and 500 square feet, and animals are housed outside in pens that are largely unpaved (approximately 85% of each pen’s surface is earthen) (National Research Council, 2003). Most cattle enter the feedlot weighing less than 800 lbs., with the 700-799 lb. group dominating in all quarters except October-December (4th quarter) when lighter cattle (500 lbs.) prices as a percentage of prices received for lighter (500 lbs.) Cattle Price as a Percentage of Lightweight (