International Multilingual Journal of Science and Technology (IMJST) ISSN: 2528-9810 Vol. 1 Issue 4, November - 2016
Determining patterns in the EEG signals during sugar abstinence across a heuristic technique Guillermo Alfonso De la Torre-Gea and Gabriela García-Manzo Institute for Research and Technology Development GARMAN A.C., Av. Andamaxei 64-40, Corregidora, Qro., Mexico. C.P. 76910.
[email protected] Abstract— Today it is known that the brain waves behave abnormally significant in episodes of anxiety and depression, however, it is not yet known whether there is a pattern of dependencies between different EEG frequencies during the sugar abstinence. Brain oscillations are often underestimated as compared to slower oscillations. Mean power spectra of scalp EEG signals exhibit distinct peaks emerging from the general decrease in power with increasing frequency, suggesting the existence of characteristic dependence oscillatory modes in cortical field potentials. The interactions between peaks in different frequency bands, within and between cortical EEG sources, are not well understood. The reviewed evidence supports the theory that, in some circumstances, intermittent access to sugar can lead to behavioral and neuro chemical changes that resemble the effects of a substance of abuse. This study was to address this problem by focusing on Bayesian Networks (BN) to describe the relationship between the EEG frequencies in sugar abstinence epicedium. We obtained a model with 96.1% to accuracy, in which shows the relations between each EEG signals. The dependency probability distribution was calculated, according to the signal amplitude behavior. An EEG signal is the result of the sum of distinct signals at different frequencies, which are serially interconnected and dependent of the Delta signal. Further studies are needed to understand the differences between sugar and their subsequent effects on behavior. However, Bayesian Networks has been show to an excellent tool of EEG signal Analysis. Keywords— Bayesian Networks, Machine Learning, Data Mining. I.
Brain,
INTRODUCTION
Neural systems that have evolved to motivate and reinforce food intake are present in addictions. This raises the possibility that some foods can also cause addiction. Many people say they feel the need to eat sweets, similar in some respects to food, as an alcoholic might feel compelled to drink. According to Colantuoni et al. [1], the manifestation of anxiety signals is common and
measurable during the sugar abstinence depressive behavior [2], as well as signs in the musculoskeletal system, such as cross-sensitization, from both drug and sugar abuse [3 – 4].
A feature of drugs is its ability to cause intermittent increases in extracellular dopamine in the nucleus accumbens [5]. This same effect it is present with excessive consumption of sugar, with the identical way as the effect of most drugs [6 – 7]. This leads to changes in the expression or availability of dopamine receptors [8]. The neurochemical adaptations in response to sugar intake imitate the effects of opiate's abstinence. Food deprivation is enough to cause similar signs of opiate abstinence. This state involves abstinence manifestations of at least two neurochemicals. First, a decrease in extracellular dopamine in the nucleus accumbens, and second is the release of acetylcholine from interneuron accumbens [9]. Dopaminergic effects, cholinergic and opioid may be present caused by the excessive consumption of sugar, on a smaller scale that psycho stimulants and opiates. These effects are known as dependence [10]. Today it is known that the brain waves behave abnormally significantly in episodes of anxiety and depression; On the other hand, Disorder Attention Deficit Hyperactivity Disorder can be determined by calculating the Theta / Beta ratio, which has allowed developing protocols used as therapy. However, it is not yet known whether there is a pattern of dependencies between different EEG frequencies during the sugar abstinence. Due the brain does not have constant energy reserves, a continuous supply of energy substrates is central to all the processes that maintain the functionality of nervous cells. The EEG signal is usually a signal predictable because only indicates that the cells are active, thus neural chemistry is not very expected, since even, you can see how oxygen and glucose are changing, cannot be sure what the
www.imjst.org IMJSTP29120065
157
International Multilingual Journal of Science and Technology (IMJST) ISSN: 2528-9810 Vol. 1 Issue 4, November - 2016
likely causes of these variations. In addition, there is a strong possibility that signs of EEG glucose-oxygenoperate in a closed-loop system [11]. Although quantitative EEG is a very powerful tool for the detection and treatment of mental disorders, today is still impossible to understand the mechanism of the relationship between the different frequencies, due to the complex anatomy and function of the brain [12]. Moreover, with classical statistical tools, it is only possible to analyze several variables simultaneously. Therefore, it is necessary to use new analysis techniques to incorporate a greater number of frequencies at once. Bayesian networks are techniques that enable analysis of many variables immediately [13]. The aim of this study is to determine and deduct the dependencies between EEG signals during withdrawal of sugar by Bayesian networks. II.
THEORY
BN models are knowledge representation used in the field of Artificial Intelligence for approximate reasoning [14]. According to Correa [15], the nodes of a BN acyclic graph correspond to concepts or variables and its links correspond to relationships or functions. Functional relationships describe causal inferences expressed in terms of conditional probabilities in which variables are defined in a discrete or qualitative domain. n
P(x1,…,xn) =
i1
P(xi |parents (xi))
space of directed acyclic graph respecting this enumeration order [17]. III. MATERIALS AND METHODS To propose of this work, Intel Core-i7 equipment is used with 8 GB of RAM and Windows 8 operating systems. The data is discretized in two intervals by Elvira software v 0.162, to be used in the development of the Bayesian network model that describes the relationships between all signal frequencies. A set of 20 experimental data, which comprised of 46,200 records EEG applied to different people in the same basal conditions in the State Center for Mental Health (CESAM) of Queretaro, Mexico; which provided the data through the file format was obtained the text (txt). Each file became the space delimited text format (CSV) using MS Excel program, organized in 11 columns named as frequencies of the EEG signals in the range of Delta to Gamma signals, which were defined as random variables. Each column was 46,200 measured data value in microvolt (µV) corresponding to the source signal EEG electrode location in Fp2 International 1020 system. BN Elvira's analysis using software version 0.162 in three stages suggested by García-Manzo (2016) was performed: a) Pre-processing, b) Processing, and c) Post-processing. After obtaining the parametric learning network, the calculation of the conditional probabilities for the variables that show relationship or dependence was performed.
(1) IV. RESULTS AND DISCUTION
Hruschka et al. [16], found that a BN could be used to identify previously undetermined relationships among variables. They describe and quantify these relationships even with an incomplete data set. The solution algorithm of BN allows the computation of the expected probability distribution of output variables. The result of this calculation is dependent on the probabilities distribution of input variables. Globally, BN can be perceived as a joint probabilities distribution of a collection of discrete random variables.
P(cj|xi) = P(xi|cj ) P(cj) /
k
P(xi|ck)P(ck)
(2)
The most representative method of Machine learning in artificial intelligence approach is the K2 algorithm. This method is widely use even if it has the drawback to need the specification of an enumeration order on variables. The idea is to maximize the probability of the structure given the data in the search
A BN model with 96.1% accuracy, calculated in the post-learning step by Elvira system, which shows the relations between the variables, was obtained. For each EEG signal, the ratio of the frequencies' different ECG is determined. BN showed the dependency relations between some frequencies, according to the signal amplitude behavior. The relations for the entire signal frequency are directly proportional. The main difference between the conditions of withdrawal of sugar comparing it with the normal condition in the EEG signals, as shown in Figure 1, is that the signal amplitude is greater, especially in signals lower frequencies such as Delta and Theta . Other difference between the signals studied is that the synchronization between the frequency changes, which is most evident between the Delta and Theta frequencies.
www.imjst.org IMJSTP29120065
158
International Multilingual Journal of Science and Technology (IMJST) ISSN: 2528-9810 Vol. 1 Issue 4, November - 2016
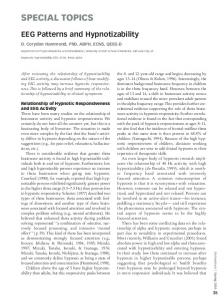
to observe in detail the relationships of dependence and independence between the frequencies (Figure 3). In this way it was possible to observe that the sugar withdrawal condition, the signal often Delta has great influence on all other frequencies; whereas in normal condition, the frequencies B1, B3, B5 and Gamma are independent.
Figure 3. K2 algorithm in sugar abstinence data set, with six discretized intervals.
When analyzing the data obtained from the EEG signals by BN-clustering, we observed that the signal Gamma is the most susceptible or dependent on other frequencies. In this model, we appreciate that changes in timing of signals in the sugar withdrawal condition and normal condition, are few.
V.
CONCLUSION
An EEG signal is the result of the sum of distinct signals at different frequencies, which are serially interconnected and they dependent on each other signals in sugar abstinence condition. Delta frequency showed the main signal that influences synchronization of the other frequencies in sugar abstinence condition. In normal condition, B1, B3, B5, and Gamma signal frequencies are independent. We have found that there are no studies which are designed to analyze these relationships, and we consider being of importance. The BN is a good tool with which we were able to study the relationships between different EEG frequencies of a signal. ACKNOWLEDGMENT The Mexican National Council of Science (CONACYT) supported this research. REFERENCES
Figure 2. BN model obtained by K2 algorithm to A) sugar abstinence, and B) normal condition.
By employing the K2 algorithm (Figure 2), we obtained the main difference between the frequencies abstinence sugar and the normal condition is that the frequency influences Delta reversely in Theta synchronization signal; both signals together with Beta 1 influenced the behavior of the Beta 2 signal. We increase the number of intervals in the discretization of the data sets to six intervals, in order
[1]
Colantuoni, C., Rada, P., McCarthy, J., Patten, C., Avena, N.M., Chadeayne, A., Hoebel, B.G., 2002. Evidence that intermittent, excessive sugar intake causes endogenous opioid dependence. Obesity Research 10, 478–488.
[2]
Avena, N.M., Long, K.A., Hoebel, B.G., 2005. Sugardependent rats show enhanced responding for sugar after abstinence: evidence of a sugar deprivation effect. Physiology & Behavior 84, 359–362. Avena, N.M., Carrillo, C.A., Needham, L., Leibowitz, S.F., Hoebel, B.G., 2004. Sugar-dependent rats show enhanced intake of unsweetened ethanol. Alcohol 34, 203–209.
[3]
[4]
Avena, N.M., Hoebel, B.G., 2003b. A diet promoting sugar dependency causes behavioral cross-sensitization to a low dose of amphetamine. Neuroscience 122, 17–20.
[5]
Wise, R.A., Newton, P., Leeb, K., Burnette, B., Pocock, D., Justice Jr., J.B., 1995. Fluctuations in nucleus accumbens
www.imjst.org IMJSTP29120065
159
International Multilingual Journal of Science and Technology (IMJST) ISSN: 2528-9810 Vol. 1 Issue 4, November - 2016 dopamine concentration during intravenous cocaine selfadministration in rats. Psychopharmacology (Berl) 120, 10–20.
[6]
Avena, N.M., Rada, P., Moise, N., Hoebel, B.G., 2006. Sucrose sham feeding on a binge schedule releases accumbens dopamine repeatedly and eliminates the acetylcholine satiety response. Neuroscience 139, 813–820.
[7]
Rada, P., Avena, N.M., Hoebel, B.G., 2005b. Daily bingeing on sugar repeatedly releases dopamine in the accumbens shell. Neuroscience 134, 737–744.
[8]
Colantuoni, C., Schwenker, J., McCarthy, J., Rada, P., Ladenheim, B., Cadet, J.L., Schwartz, G.J., Moran, T.H., Hoebel, B.G., 2001. Excessive sugar intake alters binding to dopamine and mu-opioid receptors in the brain. Neuroreport 12, 3549–3552.
[9]
Spangler, R., Wittkowski, K.M., Goddard, N.L., Avena, N.M., Hoebel, B.G., Leibowitz, S.F., 2004. Opiate-like effects of sugar on gene expression in reward areas of the rat brain. Molecular Brain Research 124, 134–142.
changes in both oxygen and glucose in the brain. ISSC, NUI Maynooth, June 2012,28-29. [12] García-Manzo, G., De la Vega-Flatow, J. N., Martínez-Alcaráz, S. L., Quijada-López, R. M., Rodríguez-Reyes, C. S., & De la Torre-Gea, G. A. Determination of relationship patterns in EEG and BVP signals using the K2 learning algorithm. T. D., Ortíz-Vázquez, I. C., García-Manzo, G., & De la torre-Gea, G. A. (2015). A Multivariable Computational Fluid Dynamics Validation Method Based in Bayesian Networks Applied in a Greenhouse. International Journal of Agriculture Innovations and Research, 4(1), 67-71.
[13] Espinoza-Huerta,
[10] Colantuoni,
C., Rada, P., McCarthy, J., Patten, C., Avena, N.M., Chadeayne, A., Hoebel, B.G., 2002. Evidence that intermittent, excessive sugar intake causes endogenous opioid dependence. Obesity Research 10, 478–488.
[11] Valente,
[14] Gámez,
J. A., Mateo J L, Puerta, J. M. Learning Bayesian networks by hill climbing: efficient methods based on progressive restriction of the neighborhood, Data Min. Knowl. Discov, 22, (2011) 106.
[15] Correa,
M., Bielza, C., Paimes-Teixeira, J., Alique, J. R. Comparison of Bayesian networks and artificial neural networks for quality detection in a machining process, Expert Syst Appl, 36 (3) (2009) 7270.
[16] Hruschka E, Hruschka E, Ebecken N. F. F. Bayesian networks for imputation in classification Problems, J Intell Inform Syst, 29 (2007) 231.
[17] Guoliang
S., Ringwood, J., Mangourova, V., and Lowry, J. Investigation of events in the EEG signal correlated with
L, Knowledge Discovery with Bayesian Networks, Ph. D. thesis, National University of Singapore, Singapore, 2009.
www.imjst.org IMJSTP29120065
160