Michael Kirby, Colorado State University, Colorado,USA. Abstract. The paper describes a nonlinear approach for constructing color conversions based on radial ...
Developing a Computational Radial Basis Function (RBF) Architecture for Nonlinear Scattered Color Data Yue Qiao, Larry Ernst, IBM Printing Systems Division, Colorado,USA Michael Kirby, Colorado State University, Colorado,USA
Abstract The paper describes a nonlinear approach for constructing color conversions based on radial basis functions (RBFs). The RBF is embedded in a two-layer structure that uses a linear transfer function for the output units and a nonlinear transfer function for the hidden units. RBFs are popular for interpolating scattered data as the associated system of linear equations is guaranteed to be invertible under very mild conditions on the locations of the data points. In particular, RBFs do not require that the data lie on any sort of regular grid. The purpose of using RBFs in color conversion is to improve the accuracy, efficiency, and performance of optimization and interpolation for high-dimensional non-linear scattering data. This approach is practical with color conversions for color devices, which have nonlinear behavior, for example, color printers. Preliminary results have shown that the RBF color mapping technique can be very effective in reducing the maximum errors of color conversions. In one experiment we observed that the maximum error was reduced by half.
Gamut Mapping Algorithms When the input color space is bigger than the gamut of the output color device, then gamut-mapping algorithms are applied. The current gamut mapping process transforms a point in the source gamut to a realizable color inside the gamut of the output device. The form of this transformation can dramatically impact the quality of the reproduced images, especially print images. As such, care needs to be used in the design and implementation of gamut mapping transformations. The current gamut-mapping algorithms map all out-ofgamut points directly to the destination gamut. The most typical gamut mappings are clipping algorithms: to clip of out-ofgamut points to the destination gamut boundary, and scaling algorithms: to scale the input color gamut to output color gamut, i.e., some out-of-gamut points are mapped to inside of the destination gamut, some out-of-gamut points are mapped to the boundary of the destination gamut. However, the direction of the mapping is still an active area of research. The large variability in past color gamut mapping studies suggests that ideal gamut mapping depends on image content, preservation of perceived hue throughout color space, and the extent of the gamut mismatch in various regions of color space. Image dependent and regional-dependent gamut mappings are preferred. However, image dependent gamut mapping algorithms suffer a performance penalty.
Visual tolerance for color difference The color difference models are built based on visual tolerance for color difference, which is visually approved match with a
374
tolerance of observer acceptability for a pair of colors. There are a few CIE perceptual based color difference evaluation equations. The most recent one is CIEDE2000, which calculates the perceptual difference by weighted lightness difference, chroma difference, hue difference, and the interaction between the chroma and the hue difference [6]. However, the CIEDE2000 is developed for the small-size industry color difference, it does not work well for the big-size color difference. The empirical weighted color difference of lightness, chroma, and hue is often used for this case, with higher weighting factors for hue and lightness difference, and lower weighting factor for chroma difference.
Current Practice The current technique of modeling the nonlinear behavior of toner/ink mixture is to divide the color space evenly into fine regions, and linearly interpolate colors within each region. In most cases, the printer profile is a Lookup table from a device independent color space, i.e., CIELAB color space to the printer color space C (cyan), M (magenta), Y (yellow), and K (black). To do so, the device color space cyan, magenta, and yellow are each divided into N linear pieces separately. The color combination of each node point of cyan, magenta and yellow Pi (c, m, y) is printed and measured with the CIELAB value Vi (L, a, b) where Pi is the device color of the ith combination of cyan, magenta, and yellow, 0 < i < N and Vi is the measured CIELAB value of Pi . Tetrahedral linear interpolation is then applied to a cube which is divided into 5 or 6 tetrahedrons [3]. The drawbacks of this approach are (1) it has to generate a large data set that evenly spans the gamut of the device (2) data which are not on the grid of evenly spaced data can not be used, and (3) the local linear assumption is only an approximate model of the data, it may not apply to some of the region which is highly nonlinear. We observe that mappings between the device dependent and independent representations are not invertible. In particular, the color conversion from the device-dependent color space to deviceindependent color is neither injective nor surjective. While clearly every color in the device-dependent color space can be mapped to a color in the device-independent color space, the range of the device-independent color space (gamut) is bigger than the range of the device-dependent color space. Because the mapping from device-dependent color space to device-independent color space is neither injective nor surjective, the color conversion from device-independent color space to device-dependent color space thus can be only achieved by approximation. For most of the color printers, the device color space cyan, magenta, yellow and black toners does not linearly correlate to the perceptual color space, e.g., CIELAB and no trivial equation can describe it.
©2006 Society for Imaging Science and Technology
The Data Fitting Problem
Scattering the functions
In general we seek either a mapping from the device dependent color (CMYK) to the device independent representation (CIELAB), or, a mapping from the device independent representation to the device dependent representation. If we let xi represent the color values in one system and let yi represent the associated color maps in another system we propose to construct the mapping
The algorithm we use for determining centers in this paper is based on clustering and is similar to that employed by [7]. The domain of the data is clustered into Voronoi regions using a global competitive learning algorithm commonly referred to as the LBG Clustering Algorithm [5]. Specifically, a Voronoi region Vi associated with the center ci is the set of points for which ci is the nearest center vector.1 The algorithm proceeds as follows:
yi = f (xi ) over a set of available known input output pairs. While we seek to make the error on the training data small, the actual measure of success of the method is how it interpolates values that are not used in the training problem. The tetrahedral method is based on a linear interpolation between known values while the RBF method described below employs a nonlinear fit.
The Radial Basis Function Technique The RBF is a very popular interpolation algorithm for the scatter data as the associated system of linear equations is guaranteed to be invertible under very mild conditions on the locations of the data points. Originally introduced as an approximating tool in [1], the RBF is embedded in a two-layer structure that uses a linear transfer function for the output units and a nonlinear transfer function for the hidden units. The form of a RBF function representation is described N
f (x) = Ax + a0 + ∑ wk φ (�x − ck �)
(1)
i=1
Here the term Ax represents the linear component of the mapping and the offset a0 allows for the mean of the data to be non-zero. The nonlinear portion of the map is represented by the superposition of vectors weighted by the nonlinear function φ . It is also common practice to include additional algebraic nonlinearities but we have not done so here. The radial basis functions themselves are generally selected so that they satisfy an invertibility condition on the square interpolation problem for the weights[8]. In this study we have found that the multiquadric function
φ (r) =
� r2 + α 2
to be the most accurate for gamut mapping. Other popular functions include the Gaussian RBF
φ (r) = exp(−r2 /α 2 ) and the thin plate spline
φ (r) = r2 ln r These functions have the property that expansions such as those given by Equation (1) represent continuous functions over compact domains. The location of these functions is stipulated by the vector centers {ck } generally scattered over the domain in a manner that reflects the distribution of the data. In this paper we achieve this through a clustering algorithm.
• Select an initial number of centers N randomly from the data. • For each center compute the Voronoi set, i.e., all points in the data closest to this center. • Now update the centers as the mean of the points in the Voronoi set. • Repeat. The purpose of data clustering is to identify the location where basis functions should be placed in the model. There are many ways to do this and we have just presented one from the literature.
Refining the model This clustering algorithm described above can be effectively combined with the Orthogonal Least Squares (OLS) method for center selections originally proposed in [2]. The OLS method serves to identify which of the N centers are most useful in the RBF model and indicates which centers may be deleted from the model and at what expense to accuracy. We will sketch the theory behind this refinement technique in a general setting. The computation of the weight parameters in Equation (1) is an over-determined least squares problem. Thus, we seek a solution to the set of inconsistent equations y = Φw where each column of the matrix Φ is associated with a single center and y does not actually reside in the column space of Φ. The question then becomes which of the columns of Φ is most useful for solving the problem? In general, one associates a quality function to a center. In this case that means measuring the value of a column φi of Φ in solving the least squares problem. One measure is the cosine of angle between y and each column of Φ, yt φi vi = �y��φi � In other words the best center is the one for which vi is as large as possible, i.e., the angle is as small as possible. This solution is indexed by i∗ meaning φi∗ is the solution to the optimization problem. Once the best column (and hence RBF center) of Φ has been determined, the next best center can be computer by projecting the remaining columns along φi∗ . This approach may be iterated to obtain a reduced subset of centers that has acceptable modeling accuracy. 1 Sometimes this is referred to as a first order Voronoi region since only one center is used in its definition.
22nd International Conference on Digital Printing Technologies Final Program and Proceeding
375
Non-uniform data fitting
45 40 35 Maximum Error in dEab
Unlike the traditional way of applying one function to all clusters, functions are optimized and selected for these clustered color data. For the neutral color area, the visual tolerance of these color differences is very small, L1 norm is preferred because it’s least sensitive to the outliers. For the saturated color regions, L∞ norm is used because human visual system is insensitive to the color differences. So we want all these regions perform equally good. When the L∞ norm is applied, the problem is mathematically equivalent to a problem in linear programming. Here a duality theorem can then be applied to solve the problem. In this proceedings paper we restrict our results to the L2 norm case only.
30 25 20 15 10 50
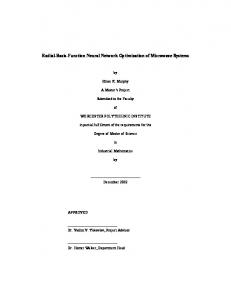
Numerical Experiment We implemented the RBF approach using a variety of basis functions and the measured the approximation error using an L2 norm. For this purpose a set of 625 CMYK patches were generated from a 5x5x5x5 4-dimensional lattice and printed. CIELAB values were also measured for each of the 625 patches. The data were clustered with N = 120 centers. Initial centers were chosen to span the whole color space. Several different RBF functions were used in the construction of the model. To evaluate the color conversion with RBF approach and traditional tetrahedron approach, a test data set consisting of 9x9x9x9 CMYK data points was used generated. The results showed that the multiquadric function gave the best performance for color interpolations. The average interpolation errors are very similar with both approaches. However, the maximum interpolation error with RBF approach is only half of the maximum error with the tetrahedron interpolation error. In each case the mean error is around 1.1 using Euclidian distance in CIELAB. The advantage of using RBF over tetrahedral is most evident in the reduction of the maximum error. The maximum error for the RBF model is around 6.92, and the maximum error of tetrahedral approach is about 11.52. The bigger interpolation errors occur around the yellow color, which is L*= 90.1097 a*= -5.2109 , and b*= 86.2261. The determination of the appropriate number of radial basis functions for a given set of data is an important problem. In particular, one has to be careful to not retain too many basis functions or the error of the representation will actually degrade on the testing set, even though it may improve on the training set. In Figure 1 we see that the maximum error in the testing data decreases as we increase the number of centers until about 90-100. At that point, the error flattens out and actually begins to increase about 250300 centers. A similar behavior is seen in Figure 2 showing the average approximation error for the radial basis function model.
376
50
100
150 200 250 Number of Cluster Centers
300
350
400
Figure 1. The maximum approximation error as a function of the number of centers in the RBF.
14
12
10 Mean Error in dEab
In summary,The RBF approach includes clustering color data, determining the cluster centers, and optimizing the number of centers; optimizing functions for each center; optimizing the norm selection with L-p norm for each center. The purpose of using RBF in color conversion is to improve the accuracy, efficiency, and performance of optimization and interpolation for high-dimensional non-linear scattering data. The approach is practical with color conversions for color devices, which have nonlinear behavior, for example, color printers.
0
8
6
4
2
0 0
Figure 2.
50
100
150 200 250 Number of Cluster Centers
300
350
400
The average approximation error as a function of the number of
centers in the RBF.
Conclusions The preliminary experimental results illustrated that color conversion can be effectively carried out using the RBF approach for constructing nonlinear mappings of data. In our experiment, we observed that RBF approach provides a significant improvement over the traditional tetrahedral approach in reducing the maximum error for color conversions. In future work, we will employ the CIE2000DE model in conjunction with OLS to assist in our refinement of points based on the visual color difference tolerance around each center. For example, about the color L*=90, a*=-2, and b*=50, the human visual system is sensitive to changes of hue, and has bigger tolerance of color difference in the b* direction. Thus, finer grids points can be generated along it hue direction, and coarser grids points generated along its chroma (b*) direction.
References [1] D.S. Broomhead and David Lowe, Multivariable Functional Interpolation and Adaptive Networks, Complex Systems, Vol. 2, 1988, pg. 321. [2] S. Chen, C.F.N. Cowan, and P. M. Grant, Orthogonal Least Squares Learning Algorithm for Radial Basis Function Networks, IEEE Transactions on Neural Networks, VOL 2, No. 2, 1991, pg. 302.
©2006 Society for Imaging Science and Technology
[3] Henry R. Kang, Geometric Data Analysis, Color Technology for Electronic Imaging Devices, SPIE Optical Engineering Press, 1997. [4] Michael Kirby, Geometric Data Analysis, An Empirical Approach to Dimensionality Reduction and the Study of Patterns, John Wiley & Sons, NY, 2001. [5] Y. Linde, A. Buzo and R. Gray, An algorithm for Vector Quantization Design, IEEE Transactions on Communications, Vol. 28, No. 1, 1980, pg. 84. [6] M.R. Luo, G. Cui and B. Rigg, The Development of the CIE 2000 Colour-Difference Formula: CIEDE2000, Color Res. Appl., Vol. 26, 2001, pg. 340. [7] John Moody and Christian Darken, Fast Learning in Networks of Locally-Tuned Processing Units, Neural Comput., Vol. 1, 1989, pg. 281. [8] H. Wendland, Piecewise polynomial, positive definite and compactly supported radial functions of Minimal Degree, Adv. Comp. Math., Vol. 4, 1995, pg. 389. Fast Learning in Networks of Locally-Tuned Processing Units, Neural Comput., Vol. 1, 1989, pg. 281.
Author Biography Yue Qiao is a color scientist/architect at IBM Printing Systems Division, Boulder, CO. She received her master degrees in physics and imaging science from John Carroll University and Rochester Institute of Technology respectively. She has been working on numerous color science and print quality related projects including color management resource architecture, color management systems, and image quality evaluations. She is currently working on her Ph.D in mathematics at Colorado State University.
22nd International Conference on Digital Printing Technologies Final Program and Proceeding
377