Q IWA Publishing 2008 Water Science & Technology—WST | 57.9 | 2008
1301
Developing a framework for continuous use of models in daily management and operation of WWTPs: a life cycle approach Gu¨rkan Sin, Dirk J. W. De Pauw, Stefan Weijers and Peter A. Vanrolleghem
ABSTRACT We developed and evaluated a framework for the continuous use of dynamic models in daily management and operation of WWTPs. The overall aim is to generate knowledge and build in-house capacity for the reliable use of dynamic models in practice (within a regional water authority in The Netherlands). To this end, we have adopted a life cycle approach, where the
Gu¨rkan Sin Dirk J. W. De Pauw Peter A. Vanrolleghem BIOMATH, Ghent University, Coupure Links 653, B-9000 Gent, Belgium E-mail:
[email protected]
plant model follows the different stages that make up the typical lifespan of a plant. Since this approach creates a framework in which models are continuously reused, it is more efficient in terms of resources and investment than the traditional approach where one always makes a new model for the plant whenever it is needed. The methodology was evaluated successfully at a 50,000 PE domestic EBPR plant (Haaren, The Netherlands). It is shown that the continuous use and update of models in a cyclic manner creates a learning cycle, which results in experience and knowledge generation about the plant’s modelling that accumulates and translates into
Stefan Weijers Waterschap De Dommel, P.O. Box 10.001, 5280 DA Boxtel, The Netherlands Peter A. Vanrolleghem modelEAU, De´pt. ge´nie civil, Universite´ Laval, Que´bec QC, G1K 7P4, Canada
improvements into the modelling quality and efficiency. Moreover, a model is now always on-the-shelf for process optimization. Key words
| ASM2d, calibration, dynamic models, efficiency, life cycle, modelling, WWTP
INTRODUCTION During the last decade, discharge legislation has become
utilities, are also starting to incorporate modelling in daily
stricter worldwide, which among others, has caused
management work. One of these organizations, Waterboard
wastewater treatment to become more complex, for
De Dommel (Noord-Brabant, The Netherlands), has taken
instance requiring carbon, nitrogen and phosphorous
such initiative: a project was set up in order to evaluate the
removal in parallel. Understanding of these processes
use of modelling as a support tool for wastewater
became increasingly challenging because of the complex
management.
interactions involved. To this end, mathematical models,
In order to perform reliable modelling work in a
and more specifically, dynamic models are regarded as
company setting, several important requirements need to
useful tools to gain more insight and in-depth under-
be met. Firstly, adequate expertise is required at the level of
standing about the processes involved in wastewater
process knowledge and of modelling methodologies.
treatment (Henze et al. 2000; Gujer 2006).
Secondly, the efficiency of the classical modelling process
So far wastewater treatment plant modelling was
needs to be improved. Generally speaking, there is a lack
primarily performed at the level of universities or consulting
of standardization (i.e. data collection and quality check,
companies (Hulsbeek et al. 2002; Langergraber et al. 2003;
measurement campaign set-up, model calibration, etc.) and
Melcer et al. 2003; Vanrolleghem et al. 2003; Sin et al. 2005).
automation (i.e. dedicated software support). Thirdly, the
However, some other type of companies such as water
obtained model quality needs to be adjusted based on
doi: 10.2166/wst.2008.225
G. Sin et al. | Framework for use of models over wastewater treatment plant life cycle
1302
Water Science & Technology—WST | 57.9 | 2008
the actual goal of the modelling exercise: some decisions
approach to modelling in order to efficiently build, use and
will need a higher quality model than others, e.g. the testing
re-use models.
of a control strategy requires a dynamic model whereas the
The basic idea is to have the modelling process reflect
design of extra volume can probably do with a steady-state
the life cycle of the actual treatment plant. A typical
simulation. Our aim includes model applications that
wastewater treatment plant goes through several phases,
require relatively detailed and accurate models of process
e.g. design, construction, start-up, operation, upgrade.
dynamics. Examples are assessing process performance
Traditionally, for each of these stages, new models are
limitations, process optimization and (model-based) pro-
developed to solve specific questions. However, it would be
cess control including RTC of the wastewater chain. We
better to further use the model developed during the design
present a methodology to facilitate knowledge generation,
stage, at the start-up and during the operation phase of the
capacity building and model quality improvement for the
treatment plant. Obviously, the model will need to be
continuous re-use of models in practice.
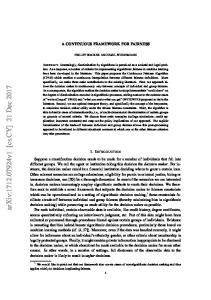
adapted each time the plant moves from one phase to another. However, the required investments will be minimal as previously obtained knowledge and experience can be used. Figure 1 illustrates this procedure for a plant going
METHODS
from a design phase into start-up and normal operation and Continuous model re-use methodology
finally undergoing a significant upgrade. Rather than
The current trend of modelling in practice is oriented
developing a new model for each of these phases, one
towards the one-time development and use of a mathemat-
model is continually used and adapted to the changes in the
ical model. After the model has been developed and used
actual plant.
for a specific purpose it is often forgotten and not used any
In using this life cycle approach, we hope to continu-
further. This is unfortunate since a considerable amount of
ously and systematically gain experience and knowledge, all
time and resources are often spent on its development.
leading to better overall modelling quality and efficiency of
Equally important is that the unique knowledge and
the modelling process itself. Practically speaking, the life
experiences gained during the model development process
cycle modelling approach is performed using the flowchart
often remain undocumented and is also likely to be lost. To
presented in Figure 2. This figure summarises the different
improve on this situation, we propose a new life cycle
steps involved in a typical life cycle of a model:
WWTP design
WWTP startup and operation
WWTP upgrade
Evolution trajectory of a WWTP
Physical reality Virtual reality
Time = t 0
WWTP Model (t0) Figure 1
|
Time = t1
WWTP Model (t1)
Time = ti
WWTP Model (ti)
Time t
Evolution trajectory of a WWTP model
Life cycle concept of modelling: life cycle of the WWTP in the physical world (top) and its life cycle in the virtual world (bottom). t stands for time and 0,1,i … .N stands for different phases in the WWTP’s life-span.
G. Sin et al. | Framework for use of models over wastewater treatment plant life cycle
1303
Water Science & Technology—WST | 57.9 | 2008
increase confidence and or improve the credibility of the START Life cycle of model for each WWTP
i = 1,2, …m
Statement of modeling purpose, [objective]i
model. The inner loop iterations should/can be terminated following a judgement (either management decision or expert judgement) of the model quality in view of meeting
Indicators for evaluation of model quality, [indicators]i Evaluation of model quality, [modelqual]i
the goal of the modelling study. After terminating the inner loop iterations, one will apply the model for its intended purpose. One can then document the experiences gained,
j = 1,2, …n
Outer loop
Inner loop
Calibration [model]j
Validation/model application [model]j No
particularly focusing on the data collection aspects and/or on the calibration protocol itself which is used to guide the process.
Sufficient quality? Yes Practical experiences with measurement campaign Practical experiences with calibration protocol Closure [objective]i New objective? No STOP
|
The Haaren WWTP was used to test and evaluate the proposed modelling framework. The plant, located in Haaren, Noord-Brabant the Netherlands, is of carrousel
Yes
Figure 2
Haaren WWTP
Overview of different steps of the life cycle of a model. See text for explanation.
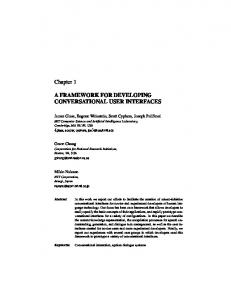
type and serves 50,000 PE with an average dry weather flow rate approximately equal to 10,000 m3/d. The operational SRT is around 22 days. The overall hydraulic retention time of the system is 1.8 days. The virtual lay out of the Haaren plant in the WESTw (MOSTforWATER NV,
1. Modelling purpose/aim: initiates the process of model building for a WWTP 2. Model building: Selection and calibration of model to represent WWTP reality 3. Model application/validation: Confrontation of the model with reality 4. Closure: evaluation of the achievement of the modelling against the purpose.
Kortrijk, Belgium) simulator is shown in Figure 3 bottom. In the plant model, mixing and hydraulics are approximated using the tanks-in-series approach, while an ideal point settler is used for the settlers (see Figure 3 bottom). The ASM2d model presented in Henze et al. (2000) is used to describe the biological nitrogen and phosphorus removal processes in the plant. Three different calibrations of the Haaren model were performed, yielding so-called model 1, model 2 and model 3 respectively. An
Going through these steps, a model-based learning
intensive measurement campaign carried in July 2000 was
cycle is created, which is an accumulation of the experi-
used to develop and calibrate model 1 (see Vanrolleghem
ences and knowledge through the whole cycle. Two
et al. 2003). A measurement campaign done three years
iteration loops are considered: the so-called outer and
later in June 2003 was used to validate model 1, resulting
inner iteration loops. In general, the outer loop iteration
in its slight re-calibration, leading to model 2 (Sin 2004).
relates to tackling the specific purpose or objective
Finally, the model 3 was calibrated using long-term on-line
defined for the modelling work, e.g. process optimization,
measurements of NH4-N and NO3-N in the carrousels
upgrade, design,…
from February 15th till 11th of April 2004 and following
The inner loop is iterated within the outer loop in view
the Monte-Carlo based calibration method (paper in
of improving the quality of a calibrated model in view of its
preparation). The BIOMATH protocol (Vanrolleghem
use at a given WWTP. This is done by first calibrating a
et al. 2003) was used for performing the different modelling
model and then confronting the model with reality, i.e.
steps, i.e. the goal definition, data collection and quality
validation. If necessary, the calibrated model can further be
check, mathematical formulation of plant units/processes,
recalibrated and revalidated using different sets of data to
influent characterisation.
G. Sin et al. | Framework for use of models over wastewater treatment plant life cycle
1304
Water Science & Technology—WST | 57.9 | 2008
Carrousel 1 Surface aerator
Settlers
Anaerobic selector
Influent
Effluent Sludge distribution well
Carrousel 2
Recycle sludge Waste sludge Temp contr
Influent
S_Comb
S1
S2
DO_Control_C4
DO_Control_C1
S3
S4
C1 Recirculation
C2
C3
C4
C5
C6
Q_total_underflow
Settler Buffer
C8
Figure 3
|
Split_Carousel C7 Wastage
Split_QWaste
Effluent
Sludge_Wastage
The Haaren plant: Physical plant (top); virtual plant in WESTw (bottom).
RESULTS AND DISCUSSION
Figure 2). The quality refers to the ability of the model to describe the plant behaviour well and to remain valid over
In this contribution, the framework is evaluated on a full-
longer periods of time (from months to, hopefully, years).
scale plant already in operation – Haaren WWTP. Note
The efficiency concerns the total time it takes to obtain a
that in the mean time Waterboard De Dommel has just
calibrated model.
started the evaluation of the framework from cradle to grave for the recently built 750,000 PE Eindhoven WWTP. This work was commenced using the Waterboard’s own
Inner loop iteration 1: development and validation of
resources and engineers, drawing on the experiences
the Haaren model
obtained from the pilot study on Haaren WWTP. The first dynamic model for the Haaren plant was developed (referred to as model 1 henceforth) and calibrated using the Evaluation of the proposed modelling framework at Haaren WWTP
data collected in July 2000. The BIOMATH protocol (Vanrolleghem et al. 2003) was used. The model’s fine tuning to the data largely relied on an expert-based approach. The
The modelling objective (step 1, Figure 2) was set to reliably
calibration data consisted of daily effluent ortho-phosphate
describe the nitrate and the ammonium dynamics in the
and effluent ammonium data and six days long of on-line
carrousel and the effluent phosphate to 1) improve N
nitrate data. The nitrate predictions of the model (Figure 4)
removal 2) obtain insight in bio-P and 3) check the effect of
were found satisfactory. The model showed that 1) N removal
installing impellers in the alternatingly aerated tanks. The
can be improved 2) there was significant bio-P and 3)
model is ultimately to be used for optimisation of the
installing impellers was beneficial.
aeration control strategy. Model quality and efficiency were
Following the calibration, the validity of the model 1
used as indicators for the evaluation of the modelling (step 2,
was checked (see Figure 2). To this end, data collected three
G. Sin et al. | Framework for use of models over wastewater treatment plant life cycle
1305
Hence, another internal iteration was felt necessary for
25 NO3–model1
20 mgN/l
Water Science & Technology—WST | 57.9 | 2008
NO3–data
improving the model quality.
15 10
Inner loop iteration 2: re-calibration of model 1 and
5 0 17-Jul-00 18-Jul-00 19-Jul-00 20-Jul-00 21-Jul-00 22-Jul-00 23-Jul-00
|
Figure 4
Nitrate predictions by model 1 in the carrousel during the calibration (July 2000).
checking seasonal validity In this iteration, the model 1 was recalibrated to better fit the validation data of June 2003, particularly the phosphate in the selector and the NH4-N measurements in the
years after its calibration was used, as it is felt necessary to provide confidence in the long-term validity of the model. The validation data consisted of a dedicated measurement campaign and on-line ammonia and nitrate sensors. In Figure 5-left, the confrontation of model 1 with the on-line NH4 data is shown. While capturing the general trends in the ammonium profile, it overpredicted the ammonium peaks by up to more than 40%. The model was observed to remain largely valid for nitrate predictions, while it overestimated the phosphate release in the selector (Sin 2004). Overall this long-term model check was still felt encouraging and added confidence in the ability of dynamic models to describe the plant.
carrousel. We learned this was possible by slightly changing a few parameters (Sin 2004). The recalibrated model, called model 2, matched the NH4 data better than model 1 (Figure 5-right). To validate this model 2, built mainly on the basis of the data collected in summer (July 2000 and June 2003), we challenged the model to describe the plant behaviour in winter, significantly different from the calibration conditions. To this end, the model 2 was confronted with the plant influent loading, temperature profile and operational data of February 2004. The validation results for on-line NO3 and NH4-N are shown in Figure 6. The results show a significant deviation from the observations.
The
model
considerably
overestimated
It also confirmed the premise that models that are already
the nitrification and underestimated the denitrification
developed for a plant can be of use for a later stage in the
capacity in the plant. One of the explanations for this
plant’s life cycle.
model mismatch is the implementation of the controller.
Drawing on these conclusions, model 1 was used to
Previously, during anoxic phases surface aerators were
develop optimal settings for the aeration controller. The
operated at a low submersion depth to keep the sludge in
optimisation suggested using impellers instead of surface
suspension. This evidently introduced a significant amount
aerators for providing mixing during anoxic phases. This
of oxygen, hampering denitrification. From a process point
was implemented in practice and the full-scale results were
of view, the inclusion of impellers may have changed the
found to disagree with what the model had forecasted
behaviour of the plant, which was obviously not captured
before (mainly the oxygen supply was found insufficient).
by model 2.
7
NH4_data
6
7
NH4_model1
6
4 3
4 3
2
2
1
1
0 16-Jun-03 Figure 5
NH4_model2
5 mgN/l
mgN/l
5
NH4_data
|
18-Jun-03
20-Jun-03
22-Jun-03
0 16-Jun-03
18-Jun-03
Validation of model 1 three years after its calibration (left); Model 2 (recalibrated model1) (right).
20-Jun-03
22-Jun-03
G. Sin et al. | Framework for use of models over wastewater treatment plant life cycle
1306
25 NO3_model2
15 10 5
0 25-Feb-04 Figure 6
10 9 8 7 6 5 4 3 2 1 0 25-Feb-04
NH4_model2
NH4_data
mgN/l
mgN/l
20
NO3_data
Water Science & Technology—WST | 57.9 | 2008
|
27-Feb-04
29-Feb-04
2-Mar-04
27-Feb-04
29-Feb-04
2-Mar-04
Confrontation of the predictions of model 2 in winter (February 2004).
Inner loop iteration 3: moving from short-term to long-
instance, the short-period calibration of model 1 and model
term calibration periods
2 required approx. 10 person-days of work during which the modeller changed one parameter at a time and checked the
To resolve the above issues, which are especially affecting the
resulting model fits to a 4– 6 day long calibration data set.
proper initialisation of the model (e.g. biomass composition),
Each parameter trial then takes a few minutes to finish. With
one needs to adequately consider the plant’s history and one
the new approach, the size of the calibration data set easily
also needs to move from calibration over short periods (the
increases to several months and the computation time for ach
predominant current practice) to longer periods. The latter
parameter trial becomes prohibitively long for a manual
will ensure that the model captures the long-term dynamic
parameter estimation. For example, it takes around half
behaviour of the plant. Further, the history of the plant, long
an hour on a Pentium IV PC to simulate 4 months of plant
recognised by many to be important, needs to be effectively
time.
coupled to the calibration process. This shift in model
To deal with this, a new partially automated parameter
calibration practice is necessary to achieve a better confi-
fine-tuning procedure was developed, which resulted in a
dence in the model when it is to be used over the life cycle of
dedicated software tool (called MOREsoft). The main
the plant. However, such an approach results in modelling
idea is to use an algorithmic procedure to do the manual
exercises with a significantly higher computational burden.
fine-tuning step in the model building. This new method
These additional computational costs may hamper the
is pragmatic and is based on a Monte-Carlo simulation
manual (and expertise-driven) parameter fine-tuning as
approach that performs a multitude of simulations by
each trial will take considerable calculation time. For
sampling parameter values from a predefined parameter
Figure 7
|
Using a 3-months long data to calibrate the Haaren model 3: the resulting model fits to nitrate (top) and ammonium (bottom): data (black) and model (grey).
1307
G. Sin et al. | Framework for use of models over wastewater treatment plant life cycle
Water Science & Technology—WST | 57.9 | 2008
space and automatically evaluating the model fit. These
validity of the model and one will therefore better use it in
simulations are expected to deliver at least one reason-
practice.
ably good model match to the measurements (paper in preparation).
However, the maintenance of the WWTP models will ask for resources. Improving the modelling efficiency is thus
The method was evaluated successfully to re-calibrate
needed to reduce these resource demands to an acceptable
the model 2 using long-term data from February 2004 till
level and this is what is currently worked on, by providing
April 2004. The resulting model is called model 3 and the
software tools to automate certain tasks.
model fits to the NO3 and NH4 data are shown in Figure 7.
In conclusion, the model re-use framework leads to
One observes that the long-term fits to nitrate and
gradual accumulation of modelling experience and knowl-
ammonium dynamics over a 2.5 month period were in
edge that translates into improvements of the in-house
general good. Sporadically the model deviated from reality.
modelling methodology. The use of a model, always residing
These deviations are believed to be caused by variations of
on the shelf, will increase automatically and support the
the influent load which had to be estimated from the
continuous analysis and optimization of WWTPs during
available weekly measurements at the plant. More detailed,
their whole life.
on-line influent load measurements of COD (using for instance UV/VIS sensors) and ammonium will decrease the uncertainty in the input and are therefore expected to improve model quality. This is currently the focus of ongoing work. Concerning the efficiency of model building, a major part of the time was spent on preparing the input data (influent load, operational data etc). The fine-tuning of the model to the data on the other hand was done automatically by a PC (see above), taking two weeks of PC time for this particular model fitting. This considerably reduced the time of the modeller spent on this task, significantly improving the overall efficiency. Partial automation of the input data preparation will also be considered to further increase the modelling efficiency.
Perspectives and conclusions The presented life cycle approach is expected to allow a plant model to track the history of a plant more efficiently than a set of models built using the traditional one-at-a-time approach. Indeed, the learning cycle helps (i) to systematically record experiences with modelling thereby improving the quality and efficiency, (ii) to better reuse the resources and time invested as the model will be re-used at different stages of the plant’s life cycle and finally (iii) to provide a continuous check and balance on the model. In this way, one gets to better know the boundaries of
REFERENCES Gujer, W. 2006 Activated sludge modelling: past, present and future. Water Sci. Technol. 53(3), 111– 119. Henze, M., Gujer, W., Mino, T. & van Loosdrecht, M. C. M. 2000 Activated Sludge Models ASM1, ASM2, ASM2d and ASM3. IWA Scientific and Technical Report no 9 IWA. London. Hulsbeek, J. J. W., Kruit, J., Roeleveld, P. J. & van Loosdrecht, M. C. M. 2002 A practical protocol for dynamic modelling of activated sludge systems. Water Sci. Technol. 45(6), 127 –136. Langergraber, G., Rieger, L., Winkler, S., Alex, J., Wiese, J., Owerdieck, C., Ahnert, M., Simon, J. & Maurer, M. 2003 A guideline for simulation studies of wastewater treatment plants. Water Sci. Technol. 50(7), 131 –138. Melcer, H., Dold, P. L., Jones, R. M., Bye, C. M., Takacs, I., Stensel, H. D., Wilson, A. W., Sun, P. & Bury, S. 2003 Methods for Wastewater Characterisation in Activated Sludge Modelling. WERF, Alexandria, VA, USA. Sin, G. 2004 Systematic calibration of activated sludge models. PhD Thesis. Faculty of Agricultural and Applied Biological Sciences. Ghent University. pp. 372. Sin, G., Van Hull, S. W. H., De Pauw, D. J. W., van Griensven, A. & Vanrolleghem, P. A. 2005 A critical comparison of systematic calibration protocols for activated sludge models: a SWOT analysis. Water Res. 39, 2459 –2474. Vanrolleghem, P. A., Insel, G., Petersen, B., Sin, G., De Pauw, D., Nopens, I., Weijers, S. & Gernaey, K. 2003 A comprehensive model calibration procedure for activated sludge models. In Proceedings: WEFTEC 2003: 76th Annual Technical Exhibition & Conference. October 11 – 15, 2003, Los Angeles, California U.S.A. (on CD-ROM).