DEVELOPING A NEW STREAM METRIC FOR COMPARING STREAM FUNCTION USING A BANK-FLOODPLAIN SEDIMENT BUDGET: A CASE STUDY OF THREE PIEDMONT STREAMS Edward R. Schenk, Research Ecologist, U.S. Geological Survey, 12201 Sunrise Valley Dr. Mail Stop 430, Reston, VA 20192
[email protected]; Cliff R. Hupp, Research Botanist, U.S. Geological Survey, 12201 Sunrise Valley Dr. Mail Stop 430, Reston, VA 20192
[email protected]; Allen Gellis Research Hydrologist, U.S. Geological Survey, 5522 Research Park Dr. Baltimore, MD 21228
[email protected]; Greg Noe Research Ecologist, U.S. Geological Survey, 12201 Sunrise Valley Dr. Mail Stop 430, Reston, VA 20192
[email protected];
EXTENDED ABSTRACT Suspended sediment is one of the most detrimental pollutants to the Chesapeake Bay.; Streams in the Piedmont Physiographic Province have the highest suspended sediment concentrations in the Bay watershed. The Piedmont region has been heavily impacted by historic land uses including land clearing for agriculture, colonial era riparian sedimentation, low-head dam construction, subsequent reforestation in the 20th century, and presently by urbanization including development near Washington, DC and Baltimore, MD. The Piedmont Physiographic Province is developing at a greater rate than any other portion of the Bay watershed while also contributing the highest sediment yield (Gellis et al. 2009). One of the objectives of our study was to develop a metric for comparing stream function between basins through the quantification of floodplain and bank sediment storage and supply (see Schenk et al. 2013 for the full manuscript). In particular, we developed a floodplain trapping metric to compare streams with variable characteristics and determine the ability of a stream’s floodplain to trap and retain sediment transported during flood events. This objective was accomplished by creating a bank and floodplain sediment budget (hereafter referred to as a “sediment budget”) for three Piedmont streams tributary to the Chesapeake Bay and comparing these estimations to published sediment yields for the same streams. A second objective was to use this floodplain-bank sediment budget to better understand the processes that govern sediment dynamics within relatively small streams in the Piedmont region of the Chesapeake Bay. The watersheds of each stream vary in land use from urban to agricultural but have similar catchment areas and annual stream discharges (Table 1). Linganore Creek (LIN) has the highest amount of agriculture in its watershed (Gellis et al. In Press). Little Conestoga Creek (LCC) is influenced by rapid urbanization from nearby Lancaster, PA as well as current and recent lowhead dams that have influenced floodplain connectivity (Schenk and Hupp, 2009). Difficult Run (DR) has the highest amount of urbanization resulting in a flashier hydrograph than the other two streams (Hupp et al. 2013). Table 1. Watershed characteristics of each studied stream. Sediment yield measurements from each stream are from their respective USGS streamgages except DR where an upstream streamgage collected sediment loads (USGS streamgage 01645704). Sediment loads were collected during Water Years 2008-2011, 2003, and 2009 for LIN, LCC, and DR respectively.
Annual mean discharge m3/s (cfs) Stream streamgage Linganore Creek (LIN) 01642438 1.4 (50) Little Conestoga Creek (LCC) 01576712 1.7 (61) Difficult Run (DR) 01646000 1.8 (62) USGS
Annual sediment yield Mg/km2/yr 43.5 65.1 163.9
Basin Area Land Use (%) 2 Km Agriculture Forested Developed 147 71 22 7 160 68 10 22 141 6 40 54
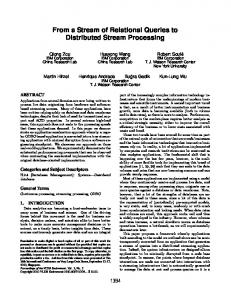
Field measurements included cross-sectional surveys extending from the valley headwall to the opposite bank of the channel (one half of the total floodplain as well as the entire channel). Bank height, channel width, floodplain width, and changes in channel morphology were all noted. Three floodplain transects were established per site per stream. Each transect consisted of 1 to 13 artificial marker horizons (feldspar clay) to determine floodplain deposition rates over time. Five bank transects were established per site with 6 bank pins per transect (3 on each side of the channel at low, middle, and high locations on the bank). Catchment area above each study site, elevation, gradient, width-depth ratio, and sinuosity along the reach at each site were determined from LiDAR imagery (0.03m vertical accuracy), digital elevation models (DEMs), topographic maps, and channel cross sections. Relations between fluvial geomorphic variables and both floodplain deposition and bank erosion were tested for significant correlations using Pearson Product-Moments analysis. Within each watershed, site floodplain deposition and bank erosion rates were related to basin area, channel sinuosity, channel gradient, bank height, channel crosssectional area, and the ratios of bank height to floodplain width, channel width to depth, channel cross-sectional area to floodplain width and channel width to floodplain width. Variables were transformed when necessary to meet the parametric assumptions of the analyses. Net site sediment budgets were best explained by gradient at Difficult Run, floodplain width at Little Conestoga Creek, and the relation of channel cross-sectional area to floodplain width at Linganore Creek. A correlation for all streams indicated that net site sediment budget was best explained by relative floodplain width (ratio of channel width to floodplain width). A new geomorphic metric, the floodplain trapping factor, was used to compare sediment budgets between streams with differing suspended sediment yields. Site sediment budgets were normalized by floodplain area and divided by the stream’s sediment yield to provide a unit-less measure of floodplain sediment trapping. A floodplain trapping factor represents the amount of upland sediment that a particular floodplain site can trap (e.g. a factor of 5 would indicate that a particular floodplain site traps the equivalent of 5 times that area in upland erosional source area). Using this factor we determined that (1) Linganore Creek had the highest gross and net (floodplain deposition minus bank erosion) floodplain trapping factor (107, 46 respectively), (2) that Difficult Run the lowest gross floodplain trapping factor (29), and (3) that Little Conestoga Creek had the lowest net floodplain trapping factor (-14, indicating that study sites were net contributors to the suspended sediment load; Figure 1). The trapping factor is a robust metric for comparing 3 streams of varied watershed and geomorphic character, it promises to be a useful tool for future stream assessments, especially on projects related to stream and floodplain restoration. The trapping factor metric, and the relative floodplain width correlation with net site sediment budgets, is currently being tested at 30 streams in the Piedmont and Valley and Ridge Physiographic Provinces to determine if the metric and geomorphic correlation can be confidently extrapolated to other streams in the Mid-Atlantic region.
Figure 1. A) Mean sediment yields for select Physiographic provinces of the Chesapeake Bay (Gellis et al. 2009) and sediment yields for the study streams from Table 1. B) Mean gross and net floodplain trapping factor by study stream. LIN, LCC, and DR represent Linganore Creek, Little Conestoga Creek, and Difficult Run respectively.
REFERENCES GELLIS AC, HUPP CR, PAVICH MJ, LANDWEHR JM, BANKS WSL, HUBBARD BE, LANGLAND MJ, RITCHIE JC, REUTER JM. (2009). SOURCES, TRANSPORT, AND STORAGE OF SEDIMENT AT SELECTED SITES IN THE CHESAPEAKE BAY WATERSHED: U.S. GEOLOGICAL SURVEY SCIENTIFIC INVESTIGATIONS REPORT 2008-5186, 95 PP.
GELLIS, A.C., G.B. NOE, J.B. CLUNE, M.K MYERS, C.R. HUPP, E. SCHENK, AND G. SCHWARZ. (IN PRESS). SOURCES OF FINE-GRAINED SEDIMENT IN LINGANORE CREEK WATERSHED, FREDERICK AND CARROLL COUNTIES, MARYLAND: 2008 TO 2011. USGS SCIENTIFIC INVESTIGATIONS REPORT 2014-5147. HUPP, C.R., NOE, G.B., SCHENK, E.R., AND BENTHEM, A.J., (2013). RECENT AND HISTORIC SEDIMENT DYNAMICS ALONG DIFFICULT RUN, A SUBURBAN VIRGINIA PIEDMONT STREAM. GEOMORPHOLOGY 180-181:156-169. SCHENK ER, HUPP CR. (2009). LEGACY EFFECTS OF COLONIAL MILLPONDS ON FLOODPLAIN SEDIMENTATION, BANK EROSION, AND CHANNEL MORPHOLOGY, MID-ATLANTIC, USA. JOURNAL OF THE AMERICAN WATER RESOURCES ASSOCIATION 45: 597-606. DOI: 10.1111/J.1752-1688.2009.00308.X SCHENK, E. R., HUPP, C. R., GELLIS, A., AND NOE, G. (2013). DEVELOPING A NEW STREAM METRIC FOR COMPARING STREAM FUNCTION USING A BANK– FLOODPLAIN SEDIMENT BUDGET: A CASE STUDY OF THREE PIEDMONT STREAMS. EARTH SURFACE PROCESSES AND LANDFORMS, 38(8), 771-784.