1 2 3 4 5 6 7 8 9 10 11 12 13 14 15 16 17 18 19 20 21 22 23 24 25 26 27 28 29 30 31 32 33 34 35 36 37 38 39 40 41 42 43 44 45
Developing a Support Vector Machine (SVM) Classifier for Transportation Mode Identification using Mobile Phone Sensor Data
Arash Jahangiri Center for Sustainable Mobility, Virginia Tech Transportation Institute 3500 Transportation Research Plaza, Blacksburg, VA 24061 E-mail:
[email protected] Phone: (540) 200-7561 Hesham Rakha (corresponding author) Center for Sustainable Mobility, Virginia Tech Transportation Institute 3500 Transportation Research Plaza, Blacksburg, VA 24061 E-mail:
[email protected] Phone: (540) 231-1505
Word count: 5,002 + 2,000 (1 Figures + 7 Tables) = 7,002
Submitted for presentation at the 93rd Annual Meeting of the Transportation Research Board and publication in the Transportation Research Record
46 47
TRB 2014 Annual Meeting
Paper revised from original submittal.
2
Jahangiri and Rakha
1 2 3 4 5 6 7 8 9 10 11 12 13 14 15 16 17 18 19 20
ABSTRACT Identifying the transportation mode can offer several advantages in different fields of transportation engineering such as transportation planning and intelligent transportation systems which lead to a broad range of environmental and safety applications. Support vector machine, as a supervised learning method, is adopted in this paper to develop a multi-class classifier to distinguish between different transportation modes including driving a car, riding a bicycle, taking a bus, walking, and running. Data from different mobile phone sensors were trained and tested to evaluate the model. Sensors from which the data were obtained include accelerometer, gyroscope, rotation vector, and Global Positioning System (GPS). A Gaussian kernel was applied as part of the classifier and unlike some ambiguity seen in the literature, a complete model selection is conducted. A small window size of one second was considered, so the model can be useful in a broader range of applications. For the first time, the data from gyroscope and rotation vector sensors were used in experiments based on individual sensor data. The study showed that such data can contribute to high detection rates. It was found that including attributes that have similar behavior among different modes can negatively impacts the detection rates. When using multiple sensors, high average overall accuracies of 98.86% and 97.89% were achieved with and without using the GPS data, respectively. These results offer improvements compared to what is reported in the literature. The bus mode was the most difficult mode to differentiate due to some similarities to the car and the bike mode data. Keywords: transportation mode; support vector machine; mobile phone sensor data; machine learning
21
TRB 2014 Annual Meeting
Paper revised from original submittal.
Jahangiri and Rakha
1 2 3 4 5 6 7 8 9 10 11 12 13 14 15 16 17 18 19 20 21 22 23 24 25 26 27 28 29 30 31 32 33 34 35 36 37 38 39 40 41 42 43 44 45 46 47 48 49
3
INTRODUCTION
Recognizing different types of physical activities using sensor data has been a recent research topic that has received considerable attention [1, 2]. Transportation mode detection can be considered as an activity recognition task in which data from smartphone sensors carried by users are utilized to infer what transportation mode the individuals have used. Micro-electromechanical systems (MEMS), such as accelerometers and gyroscopes are embedded in most smartphone devices [3] from which the data can be obtained at high frequencies. Smartphones, nowadays, are equipped with powerful sensors such as GPS, accelerometer, gyroscope, light sensors, temperature sensors, etc. Having such powerful sensors all embedded in a small device carried in everyday life activities has enabled researchers to investigate new research areas. Other advantages of these smart devices are their ubiquity, their ability to send and receive data through Wi-Fi/cellular network/Bluetooth, and store data as well as to process the data [4]. The knowledge of individuals’ mode of transport can facilitate some tasks and also can be adopted in several applications. Knowing the mode of transportation is an essential part of urban transportation planning, which is usually investigated through questionnaires/travel diaries/telephone interviews [4, 5] . This traditional way of surveying is usually expensive, erroneous, limited to a specific area, and not so up-to-date [6]. As an environmental application, the carbon footprint as well as the amount of calories burnt of individuals can be determined by obtaining the mode of transport. Other applications include providing users with real-time information using the knowledge of speed and transport mode from the users as probes [4, 7], Providing individuals with customized advertisements and messages based on the transportation mode they are using [4], physical activity and health monitoring, tracking the hazard exposure and assessing the environmental impact of one’s activities, and profile based recruitment for distributed data gathering [8]. Many studies have used GPS for classification purposes. However, several limitations are associated with the use of GPS sensors. These limitations include: GPS information is not available in shielded areas (e.g. tunnels) and the GPS signals may be lost especially at high dense locations which results in inaccurate position information. Moreover, the GPS sensor consumes significant power that sometimes users turn it off to save the battery [6, 7]. This paper focuses on developing a classifier using the support vector machine method and data obtained from smartphone sensors including accelerometer, gyroscope, rotation vector, and GPS data. Consideration of multiple sensors is beneficial in that even without using GPS the transportation modes can be identified. The unique contributions of this research effort are: 1. Exploiting data from sensors other than those used in the literature including gyroscope and rotation vector data, 2. Increasing the prediction accuracies with almost real-time prediction (time window of one second), and 3. Developing a complete model selection procedure of support vector machine using Gaussian kernels. The remainder of the paper is organized in the following five sections. Relevant literature is reviewed in the next section followed by the data collection section. Subsequently, the development of the proposed model is discussed using support vector machine techniques. Subsequently, the results of the study are presented and finally the conclusions of the study are presented.
RELEVANT WORK
Table 1 presents a summary of past studies focusing on identifying transportation modes. Almost all studies used data from GPS sensors that have the aforementioned drawbacks. Also, all studies took advantage of Artificial Intelligence (AI) tools such as Fuzzy Expert Systems as in [9] Decision Trees as in [4-8, 10], Bayesian Networks as in [4, 10], Random Forests as in [4], Naïve Bayesian techniques as in [4, 8], Neural Networks as in [11, 12], and Support Vector Machine (SVM) techniques as in [8, 10, 13-16], of which the Decision Tree and SVM methods were used the most. To improve the model performance
TRB 2014 Annual Meeting
Paper revised from original submittal.
Jahangiri and Rakha
1 2 3 4 5 6 7 8 9 10 11 12 13 14 15 16 17 18 19 20 21 22 23 24 25 26 27 28 29 30 31 32 33 34 35 36 37 38 39 40 41 42 43 44 45 46 47 48 49
4
some other techniques were also combined with machine learning methods such as Discrete Hidden Markov Models as in [8] and Bootstrap aggregating as in [17]. Other than AI tools, statistical methods were also applied such as the Random Subspace Method by [18]. Some studies have used additional information from GIS maps as in [4, 9, 19, 20]. However, GIS data is not always available, and also this approach may not be suitable for real-time applications because it mostly relies on the knowledge of the entire trip with respect to the GIS features such as bus stops, subway entrances, and rail lines. The Decision Tree method was identified as the best method by [8, 10] compared to some other methods including SVM. However, when applying SVM, several factors can greatly influence the model performance, which have not been considered in their studies. For example, a linear kernel was used in [8, 10] as part of the method, but generally for a certain type of problems and depending on the size of the available data and features, SVM can produce better results with more advanced kernels such as Gaussian kernel. Also, when applying Gaussian kernel, it was shown that if complete model selection is conducted with Gaussian there is no need to consider the linear kernel [21]. It is also unclear whether feature scaling and regularization were adopted in the most studies using SVM. Feature scaling is used to normalize the range of different features (or attributes), which leads to higher model performance and training speed and the regularization is incorporated into the model to deal with the issue of over-fitting (high variance). Gaussian kernel was only used in three studies; however, [14] did not conduct the complete model selection. In other words, constant values for the regularization parameter and the Gaussian parameter were used. It appears that [15] did not consider regularization parameter, and also they mentioned that Gaussian parameter should be optimized, but the optimized value was not reported. [16] reported the best regularization parameter (or cost parameter) to be 3, but the method by which they obtained this value is unclear. In addition, the value of Gaussian parameter they applied is not stated. Depending on the application of interest, different window sizes have been used for predicting the mode of transport. For example, [12] found that longer monitoring durations lead to higher accuracy. Intuitively, the bigger the window size the easier the prediction becomes since with bigger window sizes more information is available. If the application is only a survey for demand analysis the window size can be as large as trip duration, whereas if the application provides real-time information for environmental or some transit applications, then smaller window sizes are more desirable. The size should be as small as possible for some safety applications (e.g. crash prevention/mitigation). A study [13] used 200-meter and 150-second segments in their experiment. Whereas another study [6] used 10-second time windows to separate walking from non-walking segments and then applied a maximum size of 2 minutes. Other than the window size, the overlaps of two consecutive windows have also been considered. Reference [7] obtained the best window size and overlap to be 10.24 seconds and 50%, respectively. The entire trip duration appears to be considered in [5, 9, 11, 16, 20]. Table 1 presents different classes, the data, and the overall accuracy of the prediction models for different studies; however, the overall accuracy was not reported in some of them for which the averages of the reported values are considered in here. Also, it should be noted that, high detection rates were achieved for some of the classes (not all), as such, accuracy of 98% and 92% were obtained by [18] for bicycle and walk classes, respectively. Also, the reported values by [12] are for a 10-minute window size and one ping every 2-minutes. The studies showed higher accuracies were achieved by increasing these two parameters. Higher accuracies are achieved by increasing the window size as shown in [12]. Since the focus of the present study is on small window sizes, in order to ensure a fair comparison of the various studies only those with window sizes less than a minute are considered, as summarized in Table 2. Thus, the application would include a broader range of applications such as environmental and safety applications. Other than the window size, several factors are shown in Table 2 that also influence the model performance as follows. (1) Number of classes: as the number of classes increases, class differentiation becomes more difficult.
TRB 2014 Annual Meeting
Paper revised from original submittal.
5
Jahangiri and Rakha
Table 1: Summary of Past Efforts
1 Studies Classes [13] 1- Car 2- Walk 3- Bus 4- Bike
[6]
[19]
[4]
[8]
[9]
[18]
2 3 4 5 6 7
1- Walk 2- Bike 3- Motorcycle 4- Car 5- Bus 6- Tram 7- above train 8- subway 1- walk 2- car 3- bus 4- subway 5- commuter rail
1- car 2- bus 3- aboveground train 4- walking 5- bike 6- stationary 1- stationary 2- walk 3- run 4- bike 5- motorized transport 1- Stationary 2- Walk 3- Car 4- Train 5- Tram 6- Underground 7- Bicycle 8- Bus 9- Ferry 10- Sail boat 11 - Aircraft 1- Walk 2- Car 3- Train 4- Tram 5- Metro 6- Bicycle 7- Bus 8- Motorcycle
Data 1- GPS
Window Size 200-meter and 150second segments
Accuracy Studies Classes 83.6ᵃ [7] 1- Bus 2- Metro 3- Walk 4- Bicycle 5- Train 6- Car 7- Still 8Motorcycle 1- GPS 10-second / maximum 75.8ᵃ [11] 1- car 3- Accelerometer data of 2 minutes 2- bus 3- walk
1- GPS-based travel Developed rules to survey identify trip segments 2- GIS data from local agencies
82.6
[12]
1- GPS 2- GIS
30 seconds
93.5
[14]
1- GPS 2- Accelerometer
1 second
93.6
[22]
1- GPS 2- GIS
Entire trip
91.6
[16]
1- GPS 2- Accelerometer
>20 seconds
61.75 /78.8ᵈ
[15]
Data Window Size 1-Accelerometer rate 10.24 seconds , of 25 Hz 50% overlap
Accuracy 82.14
1- GPS data
Entire trip
91.23
1- Car 1- GPS logger highway 2- Car arterial 3- Bus arterial 4- streetcar 5- walk 1- walk 1- Accelerometer 2- bike 3- run 4- car 5- train 6- bus
1/5/10/15/20 minutes
82.2ᵇ
5 seconds , 50% overlap
93.88ᶜ
1- Walk 2- jog/run 3- bike 4- inline skating 5- car 1- walk 2- Car 3- Train 4- Bicycle 5- Bus 6- Tube
1-GPS 2-Accelerometer
Entire trip
97.7
1- GPS
Entire trip
88
4 seconds – 50% overlap
96.9 / 97.3ᵉ
1- Car 1-Accelerometer 2- Train 3Pedestrian
ᵃ the overall accuracy not reported. Here, the average of the reported recall values are used ᵇ the overall accuracy not reported. Here, the average of the reported precision values are used ᶜ it appears that the reported accuracy is for the first four classes ᵈ the overall accuracy not reported. Here, the average of the reported recall values are used. Also first value is for when 8 classes are considered and the second value is for when 6 classes are considered, meaning that classes 3, 4, and 5 are combined as a single class ᵉ 96.9 obtained with the time window of 4 seconds / 97.3 obtained considering ten consecutive windows that leads to window size of 40 seconds
TRB 2014 Annual Meeting
Paper revised from original submittal.
6
Jahangiri and Rakha
1 2 3 4 5 6 7 8 9 10 11 12 13 14 15 16 17 18 19 20 21 22 23 24
(2) Use of accelerometer/GPS/GIS data: the level of model dependency on different sources of data is considered as an important factor. Less dependent models are more desirable as they can be applicable even with limited sources of data. In this case, sensors such as accelerometers and gyroscopes are more reliable since their data are always available. (3) Ability to distinguish between motorized classes: as different motorized classes have similar characteristics such as speed and acceleration, a model capable of differentiating between these modes is of great value. For example, distinguishing the bus mode from the car mode is significantly more difficult than discriminating walking from driving. (4) Sensor positioning: it shows how realistic the experiments are conducted. Positioning the devices at certain locations increases the prediction accuracy because the movements can be monitored in more detail, but may not reflect realistic behavior. Some of the studies required that the participants attach sensors/smartphones to different parts of their body. The highest reported accuracy of 96.9% is achieved by [15] with a window size of 4 seconds. In this approach only accelerometer data were used and they did not rely on GPS and GIS data. Their method is capable of differentiating between motorized modes (car and train) and no specific sensor positioning was applied. Nevertheless, they only considered three classes. The second best accuracy is obtained by [14]. They also used accelerometer data without relying on GPS/GIS data. However, although different motorized modes were mentioned in the paper, it seems that the reported accuracies show only one motorized mode. Also, subjects in their study were asked to keep their device in their pocket of the non-dominant hip while collecting data which is more realistic compared to attaching sensors to the body, but still does not reflect a complete realistic behavior. [8] reported the accuracy of 93.6 which is ranked third in the table. They applied the lowest window size throughout the literature. However, their approach was dependent on data from GPS sensors. Moreover, different motorized classes were not considered.
25
Table 2: Key Features of Studies using a Time Window Less than a Minute Study
Number of classes
accelerometer
GPS
GIS
Different motorized
[4]
6
no
yes
yes
yes
[8]
4
yes
yes
no
no
[7]
8
yes
no
no
yes
[14]
4
yes
no
no
no
[15]
3
yes
no
no
yes
[18]
8/6
yes
yes
no
yes
26 27 28 29 30 31 32 33 34 35 36 37
positioning Not specific requirements Not specific requirements Not specific requirements In pocket of nondominant hip Not specific requirements Not specific requirements
Window size (seconds)
Overall Accuracy (%)
30
93.5
1
93.6
10.24
82.14
5
93.88
4
96.9
>20
61.75/78.8
DATA COLLECTION AND PREPROCESSING
A smartphone application was developed for the purpose of data collection. To collect the data, the transportation mode should be selected before starting the logging process, and then the application stores the data coming from smartphone’s sensors including GPS, Accelerometer, Gyroscope, and Rotation Vector at the highest possible frequency. In order to ensure that the data are gathered at identical sampling rates linear interpolation was applied to the data similar to [7] to produce continuous data sets and finally the data were re-sampled at the desired rate (rate of 100 Hz was applied). Data collection was carried out by three individuals using two different android phones (i.e. Galaxy Nexus and Nexus 4). A total of 7 hours of data were stored and used for training and testing purposes. The data in minutes were comprised of about 50, 20, 270, 15, and 70 for Car, Bus, Bike, Run, and Walk modes, respectively.
TRB 2014 Annual Meeting
Paper revised from original submittal.
7
Jahangiri and Rakha
1 2 3 4 5 6 7 8 9 10 11 12 13 14 15 16 17 18 19 20 21 22 23 24 25 26 27 28 29
MODEL DEVELOPMENT
SVM is known as a large margin classifier, which means when classifying data, it determines the best possible decision boundary that provides the largest possible gap between classes. This characteristic contributes to a higher confidence in solving classification problems. To implement SVM, the LibSVM library of SVMs was applied. For multiclass classification, considering ℎ classes, LibSVM applies oneagainst-one method in which ℎ(ℎ − 1)/2 binary models are built. Among these, LibSVM chooses the parameters that achieve the highest overall performance. Another well-known method is called oneagainst-all which is more intuitive and has similar performance. However, LibSVM takes advantage of one-against-one because of its shorter training time. Using the LibSVM package, a data set can be trained to build a prediction model for classification, and then evaluate the model by testing it on another data set [23]. To construct the model, the following factors are taken into account: using a Gaussian kernel with complete model selection, which entails consideration of the regularization parameter and the Gaussian parameter, applying feature scaling, and examining several features. The accuracy is obtained using three metrics, namely: overall accuracy, precision and recall. These three metrics are used for model evaluation. The entire data set is divided into two groups; one for training and the other for testing or evaluating how well the model is performing. The overall accuracy is calculated by dividing the total number of correct predictions by the total number of test data. The recall is calculated by dividing the total number of true positives by the total number of actual positives. The precision is computed by dividing the total number of true positives by the total number of predicted positives. Equation 1 presents the SVM formulation to solve the classification problem and the associated constraints are shown in Equation 2 and Equation 3 [24]. The objective function is comprised of two terms: minimizing the first term is basically equivalent to maximizing the margin between classes, and the second term consists of an error term multiplied by the regularization (penalty) parameter denoted by 𝐶. The 𝐶 parameter should be determined to provide the relative importance between the two terms. Equation 2 ensures that margin of at least 1 exist with consideration of some violations. The value of 1 was resulted from normalizing 𝑤. Equation 3 restricts the data points to the points that have positive errors. 𝑁
Subject to:
1 min � 𝑤 𝑇 𝑤 + 𝐶 � 𝜉𝑛 � 𝑤,𝑏,𝜉 2 𝑦𝑛 (𝑤 𝑇 𝜙(𝑥𝑛 ) + 𝑏) ≥ 1 − 𝜉𝑛 , 𝑛 = 1, … , 𝑁
30
31 32 33 34 35 36 37 38
Where, 𝑤 𝐶 𝜉𝑛 𝑏 𝜙(𝑥𝑛 )
Equation 1
𝑛=1
𝜉𝑛 ≥ 0 , 𝑛 = 1, … , 𝑁
Equation 2 Equation 3
Parameters to define decision boundary between classes Regularization (or penalty) parameter Error parameter to denote margin violation Intercept associated with decision boundaries Function to transform data from X space into some Z space
Kernels are functions that are adopted to create the features based on the provided attributes in a higher maybe infinite dimensional 𝑍 space. So, basically, for a function 𝜙(𝑥𝑛 ) that transfers data from 𝑋 space into the higher dimensional 𝑍 space, the kernel corresponds to the vector inner products in the 𝑍 space. Different types of kernels exist such as linear kernel, polynomial kernels, and Gaussian kernel. Linear kernel, as applied in [8, 10], is the basic mode which means no kernels are actually taken into account. In other words, vector inner product as appears in the dual formulation of the problem are considered without transforming data into another space. According to our data size and attribute size,
TRB 2014 Annual Meeting
Paper revised from original submittal.
8
Jahangiri and Rakha
1 2 3 4 5 6 7 8
9
10 11 12 13 14 15
16 17 18 19 20 21 22 23 24 25 26 27 28 29 30 31 32 33 34 35 36 37 38
Gaussian kernel was believed to be the most appropriate kernel [25], and as noted earlier, if a complete model selection is carried out, there is no need to test the linear kernel because the results obtained from the Gaussina kernel include the results obtained from the linear kernel. In fact, when using Gaussian kernel, If 𝜎 2 → ∞ and 𝐶 = 𝐶 𝐿 𝜎 2 where 𝐶 𝐿 is fixed then the SVM classifier behaves like an SVM classifier with a linear kernel with regularization parameter 𝐶 𝐿 [21]. In this paper, the 𝜙(𝑥𝑛 ) function which corresponds to the Gaussian kernel has an infinite dimensional space. The formulation of the Gaussian kernel is shown in Equation 4. 𝐾(𝑥, 𝑥′) = 𝑒𝑥𝑝 �− Where, 𝑥, 𝑥′ ‖𝑥 − 𝑥′‖ 𝜎
‖𝑥 − 𝑥′‖2 � 2𝜎 2
Equation 4
n-dimensional vectors Euclidean distance between vectors 𝑥, 𝑥′ Gaussian parameter
n-dimensional vectors are basically vectors of attributes. In other words, each vector is an instance of the available data consisting of different attributes. For example, an instance of the training dataset with only time and acceleration data is a 4-dimentional vector as shown in Equation 5 below.
Where,
𝑡 𝑎𝑥 , 𝑎𝑦 , 𝑎𝑧
) = (𝑡, 𝑎𝑥 , 𝑎𝑦 , 𝑎𝑧 ) 𝑥𝑡𝑟𝑎𝑖𝑛 = (𝑥𝑡𝑟𝑎𝑖𝑛 , 𝑥𝑡𝑟𝑎𝑖𝑛 , 𝑥𝑡𝑟𝑎𝑖𝑛 , 𝑥𝑡𝑟𝑎𝑖𝑛 1 2 3 4
Equation 5
The timestamp at which the data are stored Accelerations along the 𝑥, 𝑦, 𝑧 axes
Attribute Selection
At first glance, the velocity seems to be a feature by which transportation modes can be easily identified. However, traffic conditions and weather conditions can greatly influence the speed in a way that similar speed values are observed from different modes. Also, driving on local roads and riding on bicycle on the same routes may have similar velocities [17]. Features are basically generated by the kernel function using the training data set. In other words, every single data point is used by the kernel function to create a new feature. Different data attributes (also called features/indicators) such as speed, acceleration, etc. are introduced to the model for feature creation. Attributes are basically used to differentiate between transportation modes. Some attributes are considered to be basic/traditional attributes (e.g. mean speed), which are more intuitive to be influential and are widely used in the literature and some are considered to be more advanced attributes (e.g. heading change rate) as presented by [13]. Some methods have been applied to select the most relevant attributes to use such as ANOVA tests used in [16], correlation based feature selection (CFS) used in [8], and Chi Squared and Information gain methods applied in [4]. A similar approach to what [15] applied was used in our study. While preprocessing the data [15], for each time window, computed the standard deviation, the maximum value, the norm, and the number of sign changes of the cumulative acceleration values (𝑎𝑥 + 𝑎𝑦 + 𝑎𝑧 − 𝑔) , where 𝑎𝑥 , 𝑎𝑦 , 𝑎𝑧 are accelerations along the 𝑥, 𝑦, 𝑧 axes and 𝑔 is the gravitational acceleration. The total acceleration values of each time window
(�𝑎𝑥 2 + 𝑎𝑦 2 + 𝑎𝑧 2 − 𝑔) were also used to create sets of attributes, and finally the combination of all sets
of attributes was also examined. In this paper, however, instead of adding acceleration values, individual values were considered to account for the individual effects. The total acceleration was also included without gravity acceleration because the linear acceleration sensor was used from which the gravity force
TRB 2014 Annual Meeting
Paper revised from original submittal.
9
Jahangiri and Rakha
1 2 3 4
is already excluded. A similar procedure was applied to data obtained from the gyroscope, rotation vector, and GPS sensors. To see the effects of individual sensors, the set of attributes computed for each sensor was examined by itself and finally the entire sets of attributes were examined. Table 3 presents the sets of attributes.
5
Table 3 sets of attributes from different sensors set 1 - Accelerometer
set 2 - Gyroscope
set 3 - Rotation Vector
set 4 - GPS
𝑎𝑥 ���
𝑔𝑥 ���
𝑟𝑣𝑥 ����
𝑣̅
𝑎𝑦 ��� 2
𝑎𝑧 ���
𝑔𝑦 ��� 2
���𝑥 + ��� 𝑎𝑦 + ��� 𝑎𝑧 �𝑎 𝑟𝑎𝑛𝑔𝑒(𝑎𝑥 )
2
���𝑥 + ��� 𝑔𝑦 + ��� 𝑔𝑧 �𝑔 𝑟𝑎𝑛𝑔𝑒(𝑔𝑥 )
2
2
𝑟𝑎𝑛𝑔𝑒(𝑣) 2
����𝑥 + ����� 𝑟𝑣𝑦 + ���� 𝑟𝑣𝑧 �𝑟𝑣 𝑟𝑎𝑛𝑔𝑒(𝑟𝑣𝑥 )
𝑟𝑎𝑛𝑔𝑒�𝑔𝑦 �
𝑟𝑎𝑛𝑔𝑒�𝑟𝑣𝑦 �
𝑠𝑡𝑑𝑣�𝑎𝑦 �
𝑠𝑡𝑑𝑣�𝑔𝑦 �
𝑠𝑡𝑑𝑣�𝑟𝑣𝑦 �
𝑠𝑡𝑑𝑣(𝑎𝑧 ) 𝑖𝑞𝑟(𝑎𝑥 ) 𝑖𝑞𝑟�𝑎𝑦 � 𝑖𝑞𝑟(𝑎𝑧 )
𝑛𝑢𝑚𝑏𝑒𝑟 𝑜𝑓 𝑠𝑖𝑔𝑛 𝑐ℎ𝑎𝑛𝑔𝑒𝑠(𝑎𝑥 )
7 8 9 10 11 12 13 14 15 16 17 18 19 20
2
𝑟𝑣𝑧 ����
𝑟𝑎𝑛𝑔𝑒�𝑎𝑦 � 𝑟𝑎𝑛𝑔𝑒(𝑎𝑧 ) 𝑠𝑡𝑑𝑣(𝑎𝑥 )
6
2
𝑔𝑧 ���
𝑟𝑣𝑦 �����
𝑛𝑢𝑚𝑏𝑒𝑟 𝑜𝑓 𝑠𝑖𝑔𝑛 𝑐ℎ𝑎𝑛𝑔𝑒𝑠�𝑎𝑦 � 𝑛𝑢𝑚𝑏𝑒𝑟 𝑜𝑓 𝑠𝑖𝑔𝑛 𝑐ℎ𝑎𝑛𝑔𝑒𝑠(𝑎𝑧 )
𝑟𝑎𝑛𝑔𝑒(𝑔𝑧 ) 𝑠𝑡𝑑𝑣(𝑔𝑥 ) 𝑠𝑡𝑑𝑣(𝑔𝑧 ) 𝑖𝑞𝑟(𝑔𝑥 ) 𝑖𝑞𝑟�𝑔𝑦 � 𝑖𝑞𝑟(𝑔𝑧 )
𝑛𝑢𝑚𝑏𝑒𝑟 𝑜𝑓 𝑠𝑖𝑔𝑛 𝑐ℎ𝑎𝑛𝑔𝑒𝑠(𝑔𝑥 )
𝑛𝑢𝑚𝑏𝑒𝑟 𝑜𝑓 𝑠𝑖𝑔𝑛 𝑐ℎ𝑎𝑛𝑔𝑒𝑠�𝑔𝑦 � 𝑛𝑢𝑚𝑏𝑒𝑟 𝑜𝑓 𝑠𝑖𝑔𝑛 𝑐ℎ𝑎𝑛𝑔𝑒𝑠(𝑔𝑧 )
2
𝑠𝑡𝑑𝑣(𝑣) 𝑖𝑞𝑟(𝑣)
𝑟𝑎𝑛𝑔𝑒(𝑟𝑣𝑧 ) 𝑠𝑡𝑑𝑣(𝑟𝑣𝑥 ) 𝑠𝑡𝑑𝑣(𝑟𝑣𝑧 ) 𝑖𝑞𝑟(𝑟𝑣𝑥 ) 𝑖𝑞𝑟�𝑟𝑣𝑦 � 𝑖𝑞𝑟(𝑟𝑣𝑧 )
𝑛𝑢𝑚𝑏𝑒𝑟 𝑜𝑓 𝑠𝑖𝑔𝑛 𝑐ℎ𝑎𝑛𝑔𝑒𝑠(𝑟𝑣𝑥 )
𝑛𝑢𝑚𝑏𝑒𝑟 𝑜𝑓 𝑠𝑖𝑔𝑛 𝑐ℎ𝑎𝑛𝑔𝑒𝑠�𝑟𝑣𝑦 � 𝑛𝑢𝑚𝑏𝑒𝑟 𝑜𝑓 𝑠𝑖𝑔𝑛 𝑐ℎ𝑎𝑛𝑔𝑒𝑠(𝑟𝑣𝑧 )
RESULTS
The data gathered were divided into a training set (70 percent of the data) and a testing set (30 percent of the data). The distinction between the training and testing set was conducted randomly across all five modes of travel. Six scenarios were assessed based on the set of attributes used. Table 4 presents the overall accuracy as well as other key factors associated with each scenario. These results are obtained for the testing set. Scenarios 1 through 4 accounts for attributes obtained from the accelerometer, gyroscope, rotation vector, and GPS sensors, respectively, and evaluate the individual sensor effects. Scenario 5 and 6 reflect combined effects of using multiple sensors. Scenario 6 uses data from all sensors, while scenario 5 uses accelerometer, gyroscope, and rotation vector sensors excluding the data from the GPS sensor. Scenario 6 clearly achieved the best accuracy while scenario 5 also reached accuracies close to scenario 6. The advantage of scenario 5 is that it does not rely on data from the GPS sensor and thus requires less power since considerable battery usage is associated with GPS sensors. For these preliminary results, constant values of 1 and 0.01 are considered for the regularization and the Gaussian parameter, respectively.
TRB 2014 Annual Meeting
Paper revised from original submittal.
10
Jahangiri and Rakha
1 2
3 4 5 6 7 8 9 10 11 12 13 14 15 16 17 18 19
Table 4: overall accuracy and key points of different scenarios, constant values of regularization and Gaussian parameters considered Scenarios
attributes
Number of classes
Accelerometer/ gyroscope / rotation vector
GPS
GIS
Different motorized
1
set 1
5
yes
no
no
yes
2
set 2
5
yes
no
no
yes
3
set 3
5
yes
no
no
yes
4
set 4
5
yes
yes
no
yes
5
set 1,2,3
5
yes
no
no
yes
6
set 1,2,3,4
5
yes
yes
no
yes
Positioning No specific requirements No specific requirements No specific requirements No specific requirements No specific requirements No specific requirements
Window size (seconds)
Overall Accuracy
1
83.46
1
80.45
1
75.02
1
83.40
1
88.66
1
93.92
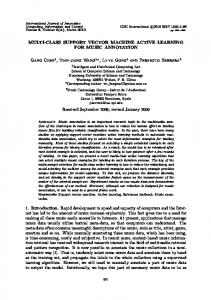
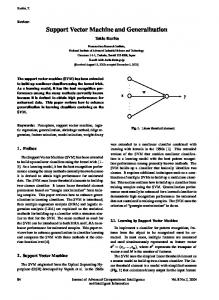
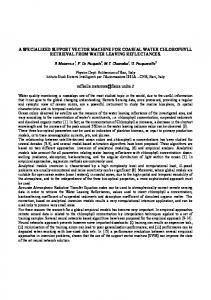
Even higher accuracies were achieved by conducting the complete model selection. In order to complete the model selection, the regularization parameter (parameter 𝑐 ) as well as the Gaussian parameter should be optimized. The Gaussian kernel formulation used in libSVM is slightly different 1 from Equation 1; in their formulation, the parameter 𝑔𝑎𝑚𝑚𝑎 was used instead of 2. Figure 1 presents 2𝜎 contour plots that illustrate how different values of the regularization (𝑐) and the Gaussian (𝑔𝑎𝑚𝑚𝑎) parameters impact the performance of the models used in scenario 5 and 6, respectively. The optimal values for (𝑔𝑎𝑚𝑚𝑎, 𝑐) were found to be (0.63, 63.1) and (0.4, 63.1) for scenarios 5 and 6 that led to the high overall accuracies of 98.23% and 98.78%, respectively. Parameter 𝑐 deals with the issues of over fitting and under fitting. Choosing a too large/too small value for the regularization parameter results in under fitting/over fitting. In other words, the model will suffer from high bias if too small values of the regularization parameter are applied, and on the other hand, if too large values of the regularization parameter are used the model will suffer from high variances. The Gaussian parameter also impacts bias and variance seen in the model. With small values of 𝑔𝑎𝑚𝑚𝑎 (or large values of 𝜎), features can vary more smoothly leading to higher bias and lower variance. Also, when using large values of 𝑔𝑎𝑚𝑚𝑎, features can vary less smoothly which results in lower bias and higher variance.
20 21
TRB 2014 Annual Meeting
(a) Scenario 5
Paper revised from original submittal.
11
Jahangiri and Rakha
1 2
(b) Scenario 6
3 4
Figure 1: Impacts of the Regularization and the Gaussian Parameters on Model Accuracy for Scenarios 5 and Scenario 6
5 6 7 8 9 10 11 12 13 14
Table 5 presents confusion matrices for scenarios 5 and 6, which shows the detection rates (i.e. true positives and true negatives in percentage based on actual values) for each mode as well as the misclassification rates (i.e. false positives and false negatives in percentage based on actual values). Since true positives are reported in percentages based on actual values, they are essentially the recall values. The highest recall of more than 99% was obtained for the bike mode in both scenarios. Moreover, the model predicts the other modes with high recalls. However, the lowest accuracy, as expected, was for the bus mode. In scenario 5, more than 7% of the time the bus mode were misclassified as bike and car modes. In scenario 6, more than 7% of the time the bus mode was misclassified as the car mode, which was the highest misclassification rate. Similarly, high precision accuracies of different modes show that the models performed very well.
15
Table 5: Confusion matrices in percentage for scenarios 5 and 6
16 17 18 19 20 21 22 23 24 25 26
Actual Bike
Car
Walk
Run
Bus
Precision
Scenario 6
Actual Bike
Car
Walk
Run
Bus
Precision
Bike
99.30
0.50
4.47
0.52
3.56
98.63
Bike
99.68
0.37
1.35
1.04
1.62
99.48
Car
0.06
98.38
0.00
0.00
3.88
98.13
Car
0.00
97.63
0.00
0.00
7.77
97.02
Walk
0.60
0.25
95.45
1.04
0.97
96.84
Walk
0.28
0.00
98.40
1.56
0.65
98.40
Run
0.00
0.00
0.00
98.44
0.32
99.47
Run
0.00
0.00
0.00
97.40
0.32
99.47
Bus
0.04
0.87
0.08
0.00
91.26
96.58
Bus
0.04
2.00
0.25
0.00
89.64
92.95
Recall
99.30
98.38
95.45
98.44
91.26
Recall
99.68
97.63
98.40
97.40
89.64
Predicted
Predicted
Scenario 5
The features used in scenario 5 were a subset of features used in scenario 6. When using additional information obtained from the GPS sensor (as in scenario 6) the recall values of the walk and run modes increased by more than 3%. In addition, the recall value of the bus mode improved by slightly more than 1% and there were minor improvements in the recall values of the bike and the car modes (less than 1%). These changes make sense since the additional features, which are all speed related variables, are better indicators for distinguishing between the walk and run mode from the other modes due to the obvious speed differences, but they may not be good indicators to distinguish between the bus and car modes due to their similar speeds. It should be noted that in general, the improvement obtained by including the GPS data was not significant (1.78% change in average recall value and almost no change in average precision value).
TRB 2014 Annual Meeting
Paper revised from original submittal.
12
Jahangiri and Rakha
1 2 3 4 5 6 7
The entire training and testing procedures were conducted ten more times using the optimal values obtained from the model selection task for scenarios 5 and 6 to show the robustness of the model. In this case 70 percent of the data were used for training and the remaining 30 percent were used for testing procedures. These 70 and 30 percent were randomly selected for each of the repetitions. Standard deviation or the recall values is applied as an indicator to show how the accuracies vary in different runs as shown in Table 6. The small values of the standard deviation shows that the models in both scenarios are extremely robust.
8
Table 6: Robustness of the Developed Model Scenario 5
Scenario 6
Bike
Car
Walk
Run
Bus
Average
Bike
Car
Walk
Run
Bus
Average
base
99.30
98.38
95.45
98.44
91.26
96.57
99.68
97.63
98.40
97.40
89.64
96.55
1
99.22
96.88
95.03
96.88
89.64
95.53
99.56
96.00
98.65
97.92
91.26
96.68
2
99.18
97.75
94.95
92.71
89.97
94.91
99.74
96.88
98.90
99.48
92.23
97.45
3
99.18
97.63
96.29
94.79
89.00
95.38
99.64
98.50
98.90
97.92
91.26
97.24
4
98.98
97.00
95.20
93.75
90.29
95.04
99.60
97.63
98.99
98.44
91.91
97.31
5
98.74
96.75
95.96
96.88
86.73
95.01
99.72
99.72
99.16
98.44
90.29
97.46
6
99.12
98.38
96.29
95.31
89.32
95.68
99.62
98.13
98.48
97.92
87.06
96.24
7
99.00
96.75
95.70
92.71
89.64
94.76
99.56
97.38
98.23
97.92
90.94
96.80
8
98.98
97.00
95.11
92.19
87.06
94.07
99.50
98.25
99.33
97.92
90.94
97.19
9
99.30
98.38
95.45
98.44
91.26
96.57
99.58
97.63
98.90
98.44
89.64
96.84
10
99.20
96.63
96.97
93.75
89.32
95.17
99.64
97.75
98.65
97.40
89.97
96.68
Average
99.11
97.41
95.67
95.08
89.41
95.34
99.62
97.77
98.78
98.11
90.47
96.99
Standard Deviation
0.17
0.71
0.64
2.29
1.45
0.65
0.07
0.94
0.33
0.58
1.42
0.40
9 10 11 12 13 14 15 16 17 18
Higher accuracies were obtained when comparing the present study with similar studies as listed in Table 2. The study carried out by [8] was considered to be the most similar research effort for the sake of a fair comparison since their study was the only one that chose a one-second time window as done in our study. This comparison is shown in Table 7. Also, only scenario 5 is presented in this table to show that even without using data from the GPS sensor, a higher accuracy was achieved. Furthermore, as mentioned earlier, [8] did not consider differentiating between motorized modes and their method also relied on GPS data. Other than the accelerometer, the present study took advantage of data from the gyroscope and rotation vector sensors. It should be noted that they used a larger dataset collected from 16 users.
19
Table 7: Comparison with the Most Relevant Study
20 21 22 23 24 25
studies
Number of classes
Accelerometer/ gyroscope / rotation vector
GPS
GIS
Different motorized
[8]
4
yes
yes
no
no
Present Study
5
yes
no
no
yes
positioning Not specific requirements Not specific requirements
Window size (seconds)
Overall Accuracy
1
93.60
1
95.34
CONCLUSIONS A classifier was developed using the support vector machine learning technique to identify different transportation modes including bike, car, walk, run, and bus. To train and test the classifier, data were obtained from smartphone sensors such as accelerometer, gyroscope, rotation vector, and GPS sensors. This effort is the first application to use gyroscope and the rotation vector sensors for the purpose of
TRB 2014 Annual Meeting
Paper revised from original submittal.
Jahangiri and Rakha
13
1 2 3 4 5 6 7 8 9
transportation mode detection. Individual experiments showed that both of them are significant indicators for distinguishing different modes. A Gaussian kernel was applied to create features from different sets of attributes coming from different sensors. When using multiple sensors simultaneously, a complete model selection was conducted to obtain the optimal regularization parameter and the optimal Gaussian parameter resulting in very accurate and extremely robust models. A time window of one second was chosen, so the model can fit in a broader range of applications. Comparing to the only study in which a time window of one second was used, higher accuracies were achieved. The focus of the future work will be on error analysis to identify any patterns that lead to misclassifications, and then to incorporate that knowledge into the prediction model for obtaining even higher accuracies.
10 11 12
ACKNOWLEDGEMENTS This research effort was partially funded by the Mid-Atlantic University Transportation Center (MAUTC) and the Connected Vehicle Initiative UTC (CVI-UTC).
13 14 15 16 17 18 19 20 21 22 23 24 25 26 27 28 29 30 31 32 33 34 35 36 37 38 39 40 41 42 43 44 45 46 47 48 49 50
REFERENCES 1. Bao, L. and S.S. Intille, Activity recognition from user-annotated acceleration data, in Pervasive Computing, Proceedings, A. Ferscha and F. Mattern, Editors. 2004. p. 1-17. 2. Kwapisz, J.R., G.M. Weiss, and S.A. Moore, Activity recognition using cell phone accelerometers. SIGKDD Explor. Newsl., 2011. 12(2): p. 74-82. 3. Susi, M., V. Renaudin, and G. Lachapelle, Motion Mode Recognition and Step Detection Algorithms for Mobile Phone Users. Sensors, 2013. 13(2): p. 1539-62. 4. Stenneth, L., et al. Transportation mode detection using mobile phones and GIS information. in 19th ACM SIGSPATIAL International Conference on Advances in Geographic Information Systems, ACM SIGSPATIAL GIS 2011, November 1, 2011 - November 4, 2011. 2011. Chicago, IL, United states: Association for Computing Machinery. 5. Yu, X., et al. Transportation activity analysis using smartphones. in Consumer Communications and Networking Conference (CCNC), 2012 IEEE. 2012. 6. Widhalm, P., P. Nitsche, and N. Brandie. Transport mode detection with realistic Smartphone sensor data. in 2012 21st International Conference on Pattern Recognition (ICPR 2012), 11-15 Nov. 2012. 2012. Piscataway, NJ, USA: IEEE. 7. Manzoni, V., et al., Transportation mode identification and real-time CO2 emission estimation using smartphones. 2010, Technical report, Massachusetts Institute of Technology, Cambridge. 8. Reddy, S., et al., Using Mobile Phones to Determine Transportation Modes. Acm Transactions on Sensor Networks, 2010. 6(2). 9. Biljecki, F., H. Ledoux, and P. van Oosterom, Transportation mode-based segmentation and classification of movement trajectories. International Journal of Geographical Information Science, 2013. 27(2): p. 385-407. 10. Zheng, Y., et al., Learning transportation mode from raw gps data for geographic applications on the web, in Proceedings of the 17th international conference on World Wide Web. 2008, ACM: Beijing, China. p. 247-256. 11. Gonzalez, P.A., et al., Automating mode detection for travel behaviour analysis by using global positioning systems-enabled mobile phones and neural networks. Iet Intelligent Transport Systems, 2010. 4(1): p. 37-49. 12. Byon, Y.J., B. Abdulhai, and A. Shalaby, Real-Time Transportation Mode Detection via Tracking Global Positioning System Mobile Devices. Journal of Intelligent Transportation Systems, 2009. 13(4): p. 161-170. 13. Zhang, L., M. Qiang, and G. Yang, Mobility transportation mode detection based on trajectory segment. Journal of Computational Information Systems, 2013. 9(8): p. 3279-3286. 14. Nham, B., K. Siangliulue, and S. Yeung, Predicting mode of transport from iphone accelerometer data. 2008, Tech. report, Stanford Univ. 15. Nick, T., et al. Classifying means of transportation using mobile sensor data. in Neural Networks (IJCNN), The 2010 International Joint Conference on. 2010: IEEE.
TRB 2014 Annual Meeting
Paper revised from original submittal.
Jahangiri and Rakha
1 2 3 4 5 6 7 8 9 10 11 12 13 14 15 16 17 18 19 20 21
14
16. Bolbol, A., et al., Inferring hybrid transportation modes from sparse GPS data using a moving window SVM classification. Computers, Environment and Urban Systems, 2012. 17. Zheng, Y., et al., Understanding transportation modes based on GPS data for web applications. ACM Transactions on the Web (TWEB), 2010. 4(1): p. 1. 18. Nitsche, P., et al., A strategy on how to utilize smartphones for automatically reconstructing trips in travel surveys. Procedia-Social and Behavioral Sciences, 2012. 48: p. 1033-1046. 19. Gong, H., et al., A GPS/GIS method for travel mode detection in New York City. Computers, Environment and Urban Systems, 2012. 36(2): p. 131-139. 20. Lester, J., et al., MobileSense-Sensing modes of transportation in studies of the built environment. UrbanSense08, 2008: p. 46-50. 21. Keerthi, S.S. and C.-J. Lin, Asymptotic behaviors of support vector machines with Gaussian kernel. Neural computation, 2003. 15(7): p. 1667-1689. 22. Troped, P.J., et al., Prediction of activity mode with global positioning system and accelerometer data. Medicine and Science in Sports and Exercise, 2008. 40(5): p. 972-978. 23. Chang, C.-C. and C.-J. Lin, LIBSVM: a library for support vector machines. ACM Transactions on Intelligent Systems and Technology (TIST), 2011. 2(3): p. 27. 24. Hsu, C.-W. and C.-J. Lin, A comparison of methods for multiclass support vector machines. Neural Networks, IEEE Transactions on, 2002. 13(2): p. 415-425. 25. Hsu, C.-W., C.-C. Chang, and C.-J. Lin, A practical guide to support vector classification. 2003.
TRB 2014 Annual Meeting
Paper revised from original submittal.