MATEC Web of Conferences 164, 01031 (2018) https://doi.org/10.1051/matecconf/201816401031 ICESTI 2017
Indonesian Stock Prediction using Support Vector Machine (SVM) Murtiyanto Santoso1, Raymond Sutjiadi2, and Resmana Lim1,*1 1
Electrical Engineering Department, Petra Christian University, Jl. Siwalan Kerto 121-131, Surabaya, Indonesia 60236 Informatics Department, Institut Informatika Indonesia, Jalan Pattimura No.3, Sonokwijenan, Surabaya, Indonesia 60189
2
Abstract. This project is part of developing software to provide predictive information technology-based services artificial intelligence (Machine Intelligence) or Machine Learning that will be utilized in the money market community. The prediction method used in this early stages uses the combination of Gaussian Mixture Model and Support Vector Machine with Python programming. The system predicts the price of Astra International (stock code: ASII.JK) stock data. The data used was taken during 17 yr period of January 2000 until September 2017. Some data was used for training/modeling (80 % of data) and the remainder (20 %) was used for testing. An integrated model comprising Gaussian Mixture Model and Support Vector Machine system has been tested to predict stock market of ASII.JK for l d in advance. This model has been compared with the Market Cummulative Return. From the results, it is depicts that the Gaussian Mixture Model-Support Vector Machine based stock predicted model, offers significant improvement over the compared models resulting sharpe ratio of 3.22. Keywords: GMM, Indonesian stock prediction, support vector machine.
1 Introduction Recently, the Support Vector Machine (SVM) [1, 2] is a common method in stock price predictions. However, as the stock market is affected by many factors, i.e. economic, political, financial, social factors and noises, stock prices may have different pattern and behaviour over different time horizons. But few studies have introduced the price features into the SVM to make price predictions. Zhang, et. al. [3] used the Ensemble Empirical Mode Decomposition (EEMD) to analyze fundamental features of petroleum price series over different time horizons and pointed out that the decomposed terms can be introduced into the SVM to make predictions. But the EEMD has some limitations in the analysis of stock price series. The EEMD can not effectively extract noise from the price prediction, but the impact of noise is prevalent in the stock market. Therefore, the EEMD can not catpure this feature well. To make predictions more accurate, we use the Gaussian Mixture Model (GMM) [4, 5] to decompose stock price series into the terms of trend. Then introduce these terms by combining the technical indicators data into the SVM to make price predictions. In voice recognition applications, GMM has been successfully used to mark speakers and channels using the eigenvoices and eigenchannels method [6]. They combine the latest results in the SVM method with the GMM supervisor concept. In this paper, we combine the SVM method with the GMM concept to predict stock trends.
2 Material and methods 2.1 Gaussian mixture models [5] Gaussian Mixture Models is the type of density model with some components of Gaussian functions. This algorithm is good enough to support stock trends extraction process since it has the reliability on the existence of noise on stock data. With this algorithm, every stock value (ie. close price) in a stock data is modelled into K of Gaussian distribution. In this case, K is the number of used Gaussian distribution model from 3 to 5. Every Gaussian model represents the different of stock trends (ie. Bullish, Stong-Bullish, Bearish, Strong-Bearish, and Sideways). 1*
Corresponding author:
[email protected];
[email protected]
© The Authors, published by EDP Sciences. This is an open access article distributed under the terms of the Creative Commons Attribution License 4.0 (http://creativecommons.org/licenses/by/4.0/).
MATEC Web of Conferences 164, 01031 (2018) https://doi.org/10.1051/matecconf/201816401031 ICESTI 2017 The choosing on number of used model depends on the consideration of stock volatililty, the performance of computer system, and complexity of stock price movement. More number of model on every stock value can cause more adaptive trends extraction process since more trends can be modelled into every stock value. However, it must be compensated with system resource that will be used, especially when stock data is big enough. In other words, this algorithm will model every stock data at one time t {X1,..., Xt} on stock data frame that is modelled into Gaussian distribution K by using the same initialization parameter. Probability from stock value based on the previous condition can be formulated as follows [7, 8]:
P(X t ) iK1 w i,t * (X t , i,t , i,t )
(1)
Where P(Xt) = Probability of trends value at time t. K = Number of Gaussian distribution on every value. Wi,t = Estimation on weight from i-th Gaussian distribution at time t.
i,t
= Mean value from i-th Gaussian distribution at time t.
i,t
= Covariance matrix from i-th Gaussian at time t.
= Function of Gaussian probability density. With the formula of function of Gaussian probability density as follows [9]:
(X t , , )
(2 )
1 e n/2 1 / 2
1 X 2 t
t
T 1(X t t )
(2)
And the covariance matrix is assumed in forms of [7]:
k,t k
2
(3)
For the next data frame, every stock value is combined with every K of of Gaussian distribution model on the same corresponding value, starting from the distribution model with the largest to the smallest probability. A stock value is determined to be suitable with one of Gaussian distribution models when it belongs to the range 2.5 of deviation standard. On the other hand, when a stock value has the value instead of 2.5 of deviation standard, it is stated to be unsuitable with that Gaussian distribution model. [7, 10]. μk − 2.5 *σk < Xt < μk + 2.5 *σk
(4)
Where Xt = stock value (Close price) at time t. μk = Vector of mean value from k-th Gaussian. σk = Value of deviation standard from k-th Gaussian. If a stock value is suitable with one of Gaussian distribution models, the parameter of Gaussian model will be updated. To update the weight value, the following formula is used [7]: ωk,t = (1 - α) ωk,t-1 + α (Mk,t)
(5)
Where = Weight from k-th Gaussian at time t. ωk,t α = Learning rate. Mk,t = The value is 1 for the suitable model and 0 for other model. After updating the weight value, do the normalization to make the total weight from K of Gaussian distribution model = 1. To update the mean value, the following formula is used [7]: μt = (1 – ρ) μt-1 + ρXt
(6)
where ρ = αȠ (Xt | μk, σk)
2
MATEC Web of Conferences 164, 01031 (2018) https://doi.org/10.1051/matecconf/201816401031 ICESTI 2017 The value of deviation standard needs periodic update when there is pixel value that is suitable with distribution. The following formula is used for the update [7]: σt2 = (1 - ρ) σ2t-1 + ρ (Xt – μt)T (Xt – μt)
(7)
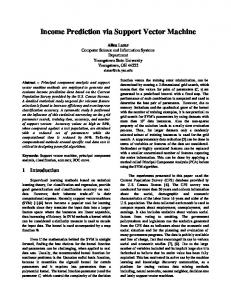
If a stock value is not suitable with all Gaussian distribution models on corresponding value, the Gaussian model with the smallest probability will be removed and replaced with Gaussian model for the new stock value. The new Gaussian model will be initialized with mean value based on the vector value, high variant value, and low weight value. 2.2 Use of technical indicators [9] A technical indicator is a series of data points that are derived by applying a formula to the price data of a security. The combination of price data, for example open, high, low or close can be used as data point over a period of time. Some indicators may use only the opening and/or closing prices, while others incorporate several price data into their formulas. The price data is entered into the formula and a data point is produced. For example, the average of 3 closing prices is one data point ((28 700 + 27 670 + 27 560)/3 = 27 976.66). However, in most cases one data point does not offer much information. To enable better analysis, a series of data points over a period of time is required to create valid reference points. By creating a time series of data points, a comparison can be made between present and past levels. For analysis purposes, technical indicators are usually used for smoothening the data points and shown in a graphical form above or below a security's price chart [9]. In literature many technical indicators can be found such as moving averages, price adjustments, volatility indicators, momentum indicators, trend indicators, market trend indicators, special indicators etc. For more smoothening the dataset and prediction few technical indicators such as simple moving average (SMA), exponential moving average (EMA), triangular moving average (TMA) and modified moving averages (MMA), Williams %R, true strength index (TSI), relative strength index (RSI), average true range (ATR), and volatility ratio (VR) are used in the experiement [9]. 2.3 Proposed GMM-SVM stock predicting model The proposed stock market analysis model is shown in figure 1. This model works in three phases. In phase 1, first the price trends (bullish, bearish, sideway) is evaluated using Gaussian Mixture Model, and class label is identified. Later the dimension of dataset is increased by adding technical indicators by using Close, High, Low, SMA, RSI, SAR, ADX and MFI. The combination of technical indicators being used is depending upon the requirement. After application of technical indicators data sets are regenerated and the data points are normalized and mapped within range (0 to 1). In phase 2, dataset is divided into two parts, one part is used for training (using 80 % of data) and other for testing (20 % of data). The model is trained using SVM classifier. In phase 3, testing data is classified using SVM. Output of SVM is either +1 or −1 indicated as p, which represents price-up or price-down. This value of p is compared with class label y to compute accuracy of the model. Then we accumulate the result of the predicted price-up or price-down resulting a Strategy Cummulative Return. We compute a performance indicator which is called sharpe ratio. Sharpe ratio = (Strategy Cummulative Return - Market Cummulative Return)/Strategy Cummulative Return.
3 Results and discussions The price of Astra International Inc. (ASII.JK) stock data was modelled. The data used taken during 17 yr period of January 2000 until September 2017. Some data was used for training/modeling (80 % of data) and the remainder (20 %) was used for testing to perform strategy cummulative return.
3
MATEC Web of Conferences 164, 01031 (2018) https://doi.org/10.1051/matecconf/201816401031 ICESTI 2017
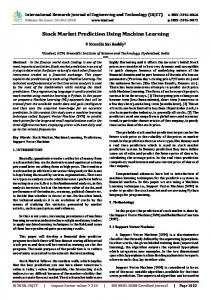
Fig. 1. The price movement of ASII.JK Astra International Inc.
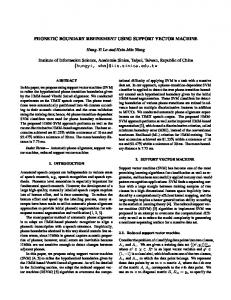
Fig. 2. The strategy cummulative return using GMM-SVM.
This strategy works on some stocks (i.e. ASII.JK—Astra International Inc. Resulting sharpe ratio of 3.22) but doesn’t work on others, which is the case with most prominant other strategies. There are a few reasons why the algorithm did work consistently and the author will list some of them here: i) No autocorrelation of returns; ii) No Support Vector hyper parameter optimization; iii) No error propagation; and iv) No feature selection. The autocorrelation of the returns have not checked yet, which would have increased the predictability of the algorithm. The returns column was shifted by one and passing it as feature set. The result will increase the sharpe ration by 5 %.
4
MATEC Web of Conferences 164, 01031 (2018) https://doi.org/10.1051/matecconf/201816401031 ICESTI 2017
4 CONCLUSION An integrated model comprising GMM and SVM system has been proposed to predict stock market of ASII.JK for l d in advance. This model has been compared with the market cummulative return. From the results, it is clearly depicts that the GMM-SVM based stock analysis model, where training with SVM offers significant improvement over the compared models and also the prediction capability has been improved for Indonesian stock market datasets. The authors would like to thank the Indonesian Directorate General of Research and Higher Education, which provided the funds (No: 08/SP2H/PDSTRL-PEN/LPPM-UKP/V/2017) for the research project.
REFERENCES H. Ince, T. Trafalis. Int. J. Gen. Syst., 37(6):677‒687 (2008). http://www.tandfonline.com/doi/abs/10.1080/03081070601068595?journalCode=ggen20 2. S. Madge. Predicting Stock Price Direction using Support Vector Machines. Independent Work Report Spring. (2015). https://www.cs.princeton.edu/sites/default/files/uploads/saahil_madge.pdf 3. S. Ying, Z. Fengting, Z. Tao. China Journal of Management Science. 03(6):35‒39 (2013). http://en.oversea.cnki.net/kcms/detail/detail.aspx?QueryID=13&CurRec=6&dbCode=CJFD&filename=ZGGK2 01303007&dbname=CJFD2013 4. Zhang Xuegong. Acta Automatica Sinica, 01:36‒46 (2000). http://en.cnki.com.cn/Article_en/CJFDTOTALMOTO200001005.htm 5. S. Rostianingsih, R. Adipranata, F.S. Wibisono. Jurnal Teknik Informatika. 9(1):68‒77 (2008). [in Bahasa Indonesia]. https://media.neliti.com/media/publications/105037-ID-none.pdf 6. W.M. Campbell, D.E. Sturim, D.A. Reynolds. IEEE Signal Processing Letters, 13(5):308‒311 (2006). http://ieeexplore.ieee.org/document/1618704/ 7. Y. Huang, K.B. Englehart, B. Hudgins, A.D. Chan. IEEE Transactions on Biomedical Engineering, 52(11): 1801‒1811 (2005). http://ieeexplore.ieee.org/stamp/stamp.jsp?arnumber=1519588 8. P. KaewTra Kul Pong, R. Bowden. An improved adaptive background mixture model for real-time tracking with shadow detection. Proc.2nd European Workshop on Advanced Video Based Surveillance Systems (September 2001). Video-Based Surveillance Systems. Boston: Springer, pp 135‒144 (2002). https://link.springer.com/chapter/10.1007/978-1-4615-0913-4_11#citeas 9. E. Kristensen, S. Østergaard, M.A. Krogh, C.J. Enevoldsen. J. Dairy Sci. 91(2):620‒631 (2008). https://www.ncbi.nlm.nih.gov/pubmed/18218749 10. Nasrabadi, N. M. Journal of electronic imaging, 16(4), 049901 (2007). https://www.spiedigitallibrary.org/journals/Journal-of-Electronic-Imaging/volume-16/issue-4/049901/PatternRecognition-and-Machine-Learning/10.1117/1.2819119.short?SSO=1 1.
5