Extended abstract submitted to AIChE Annual Meeting 2006, Session #457 - Pharmaceutical Technology Poster Session (15009), Paper 457g
Developing a Systematic Design Approach to Tailor Crystal Size Distribution for Mixing-Sensitive Crystallization Processes Xing Yi Woo1, 2, Reginald B. H. Tan2, 3, Richard D. Braatz1 * 1
Department of Chemical and Biomolecular Engineering, University of Illinois at Urbana-Champaign 2 Department of Chemical and Biomolecular Engineering, National University of Singapore 3 Crystallization and Particle Science Group, Institute of Chemical and Engineering Sciences * Corresponding author. Email:
[email protected] Phone: 217-333-5073 Fax: 217-333-5052 Abstract The design of crystallization processes becomes more complicated when mixing affects the final crystal product quality (e.g., crystal size distribution and polymorphic form). Such mixing effects are more apparent in antisolvent and reactive crystallizations, which involve the blending of different fluids, and in large-scale crystallizers, where homogeneity cannot be easily achieved. In this paper, we present the use of an integrated algorithm, which couples macromixing and micromixing models with the population balance equation, to model antisolvent crystallization in a stirred vessel and impinging jet crystallizers. The dependency of the crystal size distribution on the mixing speed and scale for a stirred vessel and the effects of jet velocity on the crystal size distribution and polymorphic form for an impinging jet crystallizer are numerically investigated. Eventually, the development of such computational tools would enable us to understand the interactions between hydrodynamics and the kinetics of crystallization in order to develop systematic design methodologies for crystallization processes. specific size range would depend on the region of the human respiratory tract where the drug is targeted (Shekunov and York, 2000; Nagao et al., 2005).
1. Introduction In the pharmaceutical industry, both company internal and regulatory authorities impose stringent requirements on the product quality, which includes crystal size distribution, of active pharmaceutical ingredients (APIs) obtained from crystallization processes (Paul et al., 2005). In addition, the development of the crystallization process for a given API includes the design of control strategies to ensure the crystal product meet the demands of the drug administration method and the bioavailability, as well as the required physical attributes for the efficiency of downstream processes (e.g. filtration and drying) (Braatz, 2002; Fujiwara et al., 2005). In particular, a narrow particle size distribution is especially important for inhalation drugs, in which the
Antisolvent crystallization is used widely in the pharmaceutical industry. This process enables the crystallization of thermally sensitive molecules without introducing large temperature changes (Wey and Karpinski, 2002). The process is usually carried out in semibatch mode in stirred tanks, and in continuous or semi-continuous mode in impinging jets. Various experimental studies have investigated the effects of the operating conditions on the product quality, such as crystal size distribution and polymorphic form (see Woo et al., 2006a, b, and references therein).
1
the industrial scale. In addition, the use of numerical simulations to design crystallization processes would significantly reduce the amount of API required for experiments.
The development of the antisolvent crystallization process for a particular pharmaceutical compound usually requires numerous experiments to identify and optimize the required operating conditions to give the desired crystal product quality. Moreover, these conditions usually need to be changed upon scale-up due to the sensitivity of the kinetics of crystallization on the crystallizer hydrodynamics which are not preserved on scale-up. However, the limited amount of API available during the early stage of drug development can limit the number of experiments. The long experimental procedures can also prolong the time needed to bring the drug to the market.
2. Macromixing-Micromixing-Population Balance Algorithm This section describes the integrated model that couples the macro- and micro-scale mixing effects with the crystallization kinetics to predict their effects on the crystals size distribution in antisolvent crystallization processes. The different models are combined and solved with a single solver, which eliminates the need for communication between different simulation codes. More details on this approach are provided by Woo et al. (2006a).
Development of systematic design procedures requires a thorough understanding of the process, in particular, the interactions that occur between hydrodynamics and the crystallization kinetics. Numerous simulation studies have been carried out based on this motivation (see Woo et al., 2006, and references therein). Here, an integrated algorithm that couples macromixing and micromixing models with the full solution of population balance equations is developed for detailed modeling of crystallization processes. The significance of this coupled code is that it takes into account the different scales of mixing as well as computing the entire crystal size distribution.
2.1 Macromixing. The macromixing that affects the distribution of the solute and solvents in the crystallizer was modeled with Reynolds-averaged Navier-Stokes (RANS) and scalar transport equations, and a turbulence closure model, computed by commercial CFD software (Fluent 6.2, Fluent Inc.). The equations are summarized as follows; the reader is referred to the software documentation for the nomenclature (Fluent 6.2 User’s Guide, 2005). ∂ρ + ∇ i(ρv ) = 0 ∂t Momentum conservation equation:
In this paper, the integrated algorithm was applied to model antisolvent crystallization in a stirred vessel and in a impinging jet crystallizer. We investigate the dependency of the crystal size distribution on the mixing speed, addition mode, and scale for a stirred vessel, and the effects of jet velocity on the crystal size distribution and polymorphic form for an impinging jet crystallizer.
Continuity equation:
(1)
∂ (ρv ) + ∇i(ρv v ) = −∇p + ∇ i( τ ) + ρg ∂t k -ε equations:
(2)
∂ (ρk ) + ∇i(ρkv ) ∂t ⎡⎛ μ ⎞ ⎤ = ∇i ⎢⎜ μ + t ⎟ ∇ik ⎥ + Gk − ρε, σ k ⎠ ⎣⎝ ⎦ ∂ (ρε) + ∇i(ρεv ) ∂t 2 ⎡⎛ μ ⎞ ⎤ = ∇i ⎢⎜ μ + t ⎟ ∇iε ⎥ + C1ε ε Gk − C2ε ρ ε σε ⎠ k k ⎣⎝ ⎦
The goal of such computational tools is to enable the numerical determination of the crystal size distribution and polymorphic form for a wide range of operating conditions for a given set of crystallizer designs and control schemes. Subsequently, the mixer(s), vessel internal design, and operating conditions which result in the desired crystal size distribution and polymorph form could be determined. This systematic design approach would especially be useful for scale-up, where the product quality must be maintained at
2 where μt = ρCμ k ε Scalar transport equation: ∂ (ρφk ) + ∇i(ρv φk − ρ( Dm + Dt )∇ iφ k ) = Sφk ∂ μ where Dt = t ρSct
2
(3)
(4)
Table 1. Micromixing terms for equations (5) and (6) (Fox, 2003). Model n Gs, Msn variables G, M p1 −γ p1 (1 − p1 ) γ s p3
2.2 Micromixing. The micromixing was modeled by a three-environment presumed-PDF model, which approximates the fluctuations of the species concentrations on the subgrid scale (Fox, 2003). Environment 1 and 2 represent the saturated solution and the antisolvent respectively, and Environment 3 is a mixture of the two fluids resulting in a supersaturated solution where crystallization occurs. The equations, which are coupled with the CFD algorithm, are ∂p + ∇ i(vp − Dt ∇ ip ) = G + G s ∂t ∂ s n + ∇i(v s n − Dt ∇i s n ) ∂t
p2
−γ p2 (1 − p2 )
γ s p3
p3
γ [ p1 (1 − p1 ) + p2 (1 − p2 ) ]
−2 γ s p3
s
γ ⎡⎣ p1 (1 − p1 ) φ 1 + p2 (1 − p2 ) φ 2 ⎤⎦ −γ s p3 ( φ 1 + φ εξ γ= 2 p1 (1 − p1 )(1 − ξ 3 ) 2 + p2 (1 − p2 ) ξ 3
3
(5)
γs =
ξ'
= M n + M sn + pn S n s
n
≡ pn φ
(7)
n
where p is the volume fraction vector, φ
n
f w, j = ρ c k v
is the =
mean composition vector in environment n, and s n is the weighted composition vector. The is also represented by equation (6). The micromixing terms, M n and M sn , in the righthand-side of the equations are given in Table 1 and S n is the source term (e.g., reaction, crystallization) for the scalars, which is a function of φ n .
3
∂xi
r j +1 2
r j −1 2
2 3
r 3 f j dr
( (r
j +1 2 )
4
− (r j −1 2 )
4
)
(9)
For S > 1 d f w, j + ∇i(vf w, j − Dt ∇i f w, j ) dt ρk = c v ⎡ (r j +1 2 ) 4 − ( r j −1 2 ) 4 ⎤ × ⎦ 4Δr ⎣ ⎧⎪ ⎫⎪ Δr Δr ⎡ ⎤ ⎡ ⎤ ( f r ) j ⎥ + G j −1 2 ⎢ f j −1 + ( f r ) j −1 ⎥ + B ⎬ ⎨−G j +1 2 ⎢ f j + 2 2 ⎣ ⎦ ⎣ ⎦ j =0 ⎭⎪ ⎩⎪
The scalar dissipation rate ( εξ ), described in detail by Pope (1985), is expressed as: 1 ε Cφ ξ '2 2 k
3
)
where ρc is the crystal density and kv is the crystal volume shape factor. For the well-micromixed case, the scalar transport equation for fw,j with size-dependent growth is
transport equation for the mixture fraction, ξ 3 ,
εξ =
∫
ρc kv f j 4
∂xi
2
= p1 (1 − p1 ) − 2 p1 p3 ξ 3 + p3 (1 − p3 ) ξ
2
(6)
∂ ξ3∂ ξ
2 Dt (1 − ξ 3 ) 2 + ξ
2
For S < 1
(8)
d f w, j + ∇i(vf w, j − Dt ∇i f w, j ) dt ρk = c v ⎡ (r j +1 2 ) 4 − ( r j −1 2 ) 4 ⎤ × ⎦ 4Δr ⎣
with the appropriate kinetic expressions inserted into the term S n . Equations (5) and (6) were solved as user-defined scalar transport equations by the CFD solver (Fluent 6.2 UDF Manual, 2005).
⎧ Δr Δr ⎡ ⎤ ⎡ ⎤⎫ ( f r ) j +1 ⎥ + G j −1 2 ⎢ f j − ( fr ) j ⎥ ⎬ ⎨−G j +1 2 ⎢ f j +1 − 2 2 ⎣ ⎦ ⎣ ⎦⎭ ⎩
(10)
2.3 Population Balance. To compute the crystal size distribution in the crystallizer, the transport equations in the macromixing-micromixing model are coupled to the spatially-varying population balance equation which is discretized along the crystal growth axis using a high-resolution finitevolume method (Kurganov and Tadmor, 2000). With fj denoting the cell-averaged population density between size rj −1 2 and rj +1 2 , the cell-
where (fr)j is the derivative approximated by the minmod limiter,59 the supersaturation is S = c/c*, c and c* are the solution and saturated concentrations respectively, G is the growth or dissolution rate, and B is the nucleation rate. To include the effects of micromixing, equation (10) is written in the form of equation (6), with the right-hand-side of equation (10) inserted into the
averaged crystal mass, fw,j, is written as
3
chemical source term in equation (6), and solved with the CFD solver.
( ξ 3 → 0.5 ). This mixing sequence results in a drop in antisolvent composition, supersaturation, and thus nucleation and growth rates, in the mixed environment, which then slowly increases with time. This is followed by the supersaturation going through a maximum (at t = 440 s for 500 rpm) and decreasing due to consumption of solute for crystal growth after substantial amount of nuclei has formed.
3. Mixing Effects in Stirred Tank Crystallizers The coupled algorithm is used to simulate the mixing effects in stirred-tank crystallizers operated in semibatch mode for the antisolvent crystallization of paracetamol from acetone-water. Simulation details and kinetics are presented in Woo et al. (2006a). 0.01 s
10 s
440s
800 s
0.01 s
10 s
440 s
800 s
Figure 2 Spatial distributions of the nucleation rate B (#/L-s) in Environment 3 at 500 rpm for various times.
Figure 1 Spatial distributions of supersaturation Δc (kg solute/kg solvents) in Environment 3 at 500 rpm for various times.
Figure 4 shows the evolution of CSD during the first few minutes and throughout the entire batch at 500 rpm. Due to the initial micromixing effects, small amounts of crystals are formed, with lower agitation speeds resulting in more crystals due to slower micromixing (plot not shown). The nucleation and growth rates at the inlet drop quickly during the first seconds (see Figures 2 and 3), after which the crystals grow with increasing growth rate (see first plot in Figure 4). Such crystals formed during the initial contact of the solution and the antisolvent have been observed in some experiments (Mullin, 1989) and do not represent the detection of a metastable limit for the overall solution. It is not surprising to observe
3.1 Effects of Agitation Rate. The initial mixing has small regions of mixed solution (Environment 3) with equal proportions of the solution and the antisolvent ( ξ 3 = 0.5 ), with localized regions of high supersaturation and rapid nucleation and growth rates (see Figures 1 to 3, refer to Woo et al., 2006a for other plots illustrating the mixing effects). Subsequently, the mixed environment extends throughout the vessel, with its major proportion being the initial solution in the vessel ( ξ 3 → 0 ). The amount of antisolvent in Environment 3 increases throughout the batch
4
measured under an optical microscope. It can be seen from Figure 6 that larger crystals were obtained at higher agitation rate, consistent with the simulation results shown in Figure 5.
higher growth rates at the impeller region due to higher turbulence and reduced mass transfer limitations to crystal growth (Figure 3). Higher growth rates are observed for higher agitation rates (plot not shown), due to the reduction of mass transfer limitations on crystal growth. Consequently, the faster desupersaturation at higher agitation results in lower overall nucleation rates (plot not shown). This explains the final CSD (at the end of one hour) for different agitation rates, in which fewer and slightly larger crystals are obtained with higher agitation rates (see Figure 5). 0.01 s
10 s
440 s
800 s
Figure 4 Evolution of the volume-averaged CSD at 500 rpm. 5
average f (#/μm-L)
2
Figure 3 Spatial distributions of the mean growth rate Gmean (μm/s) in Environment 3 at 500 rpm for various times.
200 rpm 500 rpm 800 rpm
1.5
1
0.5
0
A recent publication on the paracetamol-acetonewater system by Yu et al. (2005) reports that the mean particle (crystals and agglomerates) size increases and subsequently decreases with mixing speed. However, no direct comparison with the crystal size distribution can be made due to the high degree of agglomeration at the lower mixing speeds and higher antisolvent addition rates. The authors of that paper loaned us the crystal samples from their experiments, and the larger, less agglomerated crystals were sieved out and
x 10
0
50
100 150 crystal size (μm)
200
250
Figure 5 Final volume-averaged CSD for various agitation rates (direct addition).
3.2 Effects of Addition Mode. Reverse addition (addition of saturated solution to antisolvent) is used in the pharmaceutical industry to crystallize small particles (Midler et al., 1994). To the authors’ knowledge, the comparison between the effects of both addition modes has yet to be extensively studied. Here, the reverse addition
5
significantly higher (see Figure 7). This is a result of the dependence of the nucleation and surface integration rates on solvent composition. In the paracetamol-acetone-water system, the nucleation and the surface integration rates increase with increasing antisolvent composition. During the reverse addition, a high antisolvent composition is achieved, which results in the formation of a larger number of nuclei and slower mean growth rates (see Figure 7). Consequently, the final CSD for the reverse addition mode, shown in Figure 9, has more crystals of significantly smaller size.
mode was modeled with the same volumes of saturated solution and antisolvent as the direct addition case. This simply involved switching the concentrations in Environments 1 and 2. 80 400 rpm
70
600 rpm
60
800 rpm
# crystals
50 40 30 20 10
00 19
00
00
00 18
17
16
00
00 15
14
00
00
00 13
12
11
0
00
90
10
0
0
0 80
70
60
50
0
0
Crystal size (μm)
Figure 6 Crystal size distribution of paracetamol crystals obtained from Yu et al. (2005) for an antisolvent addition rate of 2 g/min for various agitation rates. The larger and less agglomerated crystals were obtained by sieving (600 μm sieve) and the length of the longest axis of the single crystals (200 crystals total) were measured under an optical microscope (Olympus BX51).
80 70 60 -3 10
0
10 time (s)
4
10
Average B in E3 (#/L-s)
5
8
x 10
6 4 2 0 -3 10
0
10 time (s)
4
10
0.04
Direct addition Reverse addition
0.02
Figure 8 Evolution of volume-averaged CSD at 500 rpm for reverse addition.
0 5
-0.02 -3 10
0
10 time (s)
7
4
10
5 0 -5 -10 -15 -3 10
0
10 time (s)
x 10
Direct addition Reverse addition
6 average f (#/ μm-L)
Average Δ c in E3 (kg solute/kg solvents)
90
Average Gmean in E3 (μm/s)
Average w in E3 (%)
100
4
5 4 3 2
10
1
Figure 7 Volume-averaged antisolvent mass% (w), supersaturation (Δc), nucleation rate (B), and mean growth rate (Gmean) in Environment 3 (E3) at 500 rpm for direct and reverse addition modes.
0
0
50
100 150 crystal size (μm)
200
250
Figure 9 Final volume-averaged CSD at 500 rpm for direct and reverse addition modes.
The time profiles of the average antisolvent composition, supersaturation, and nucleation and growth rates in Environment 3 during the initial contact of the feed solution and the antisolvent are the same as the direct addition case (see Figure 7). Subsequently, during reverse addition the excessive dilution of the saturated solution by the antisolvent results in the undersaturation and dissolution of the crystals formed at the initial contact (see Figure 8). For most of the crystallization, the supersaturation at longer times during reverse addition is not as high as in direct addition, while the peak nucleation rate is
3.3 Effects of Scale-Up. The scale-up of crystallizers has long been a challenge for the pharmaceutical industry. The coupled algorithm enables the investigation of the effects of scale-up. Here, the one-liter vessel was scaled-up to 125 L while maintaining its geometric similarity. The impeller speed, based on 500 rpm for the small scale, was scaled up according to two common scale-up rules: (i) constant tip speed (100 rpm) and (ii) constant power per unit volume (171 rpm) (Kresta and Brodkey, 2004). The simulations for the scale-up studies for direct addition were
6
can affect the crystal product quality, the design and scale-up of crystallizers to meet a desired product specification can be carried out in a more systematic way, which is a challenging problem in industrial crystallization. This can reduce the number of laboratory experiments required, especially when a pharmaceutical drug is only available in small quantities in the early drug development stage, and shorten the time required to develop the manufacturing process. In this section, we have shown how agitation rate and addition mode can be adjusted to produce a specified crystal size distribution and what scaleup rules can be used to maintain the desired crystal size distribution during scale-up.
performed for 20 minutes of batch time, after which the change in CSD was minimal due to slow growth for the rest of the batch. 5
2.5
x 10
500 rpm 1L 100 rpm 125L (constant Ut)
average f (#/μm-L)
2
171 rpm 125L (constant P/V)
1.5 1 0.5 0
0
50
100 150 crystal size (μm)
200
250
Figure 10 Volume-averaged CSD at 20 minutes after scale-up.
4. Mixing Effects in Impinging Jet Crystallizers To study the mixing effects in impinging jet crystallizers, the coupled algorithm is applied to simulate the antisolvent crystallization of lovastatin and l-histidine in a confined impinging jet crystallizer designed by Johnson and Prud’homme (2003). Details of simulations and kinetics are described in Woo et al. (2660b).
The dispersion of the feed solution is less effective on a larger scale for both scale-up criteria (refer to Woo et al., 2006a for plots). By comparing the spatial plots for the 1 L-scale with both scale-up cases for the 125 L-scale (not shown) at the time of highest supersaturation (t = 440 s), somewhat higher inhomogeneities in the antisolvent composition, the supersaturation, and the nucleation rate can be observed for the large vessel. The difference in spatial variation of the growth rate is a consequence of the spatial distribution of the turbulent energy dissipation not being preserved after scale-up. The CSD obtained at the end of 20 minutes is shown in Figure 10, with the scale-up based on constant power per unit volume giving a better match with the CSD of the small scale. Nevertheless, no significant change in the crystal size distribution was observed on scale-up, which is consistent with experimental findings by Torbacke and Rasmuson (2004), where the reactor size was observed to have no influence on the product mean size. More drastic differences in the CSD are expected after scale-up for the crystallization systems where secondary nucleation, aggregation, and breakage are important.
v = 1.0 m/s
v = 6.0 m/s
Figure 11 Supersaturation (c/c*) of lovastatin in the mixed environment along the symmetry plane of the mixing chamber of the confined impinging jet (left inlet: lovastatin saturated in ethanol, right inlet: water).
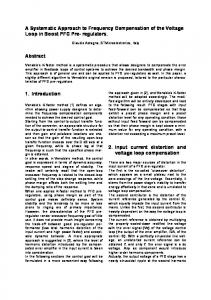
4.1 Effects of Jet Velocity. The crystallization of lovastatin from methanol-water was simulated to compute the crystal size distribution at the outlet for different jet velocities. High supersaturation is achieved in the regions of high antisolvent composition where the solubility of lovastatin is low (Figure 11). The spatial inhomogeneities of the supersaturation for different inlet velocities are
3.4 Design of Stirred Tank Crystallizers. The examples were chosen to show the effects of different operating conditions and scale on the crystal size distribution for a model system, and can be extended to other systems which crystallization kinetics are known. While gaining insights into how different operating parameters
7
the inlet velocity. It is primarily the longer residence time at lower inlet velocity that results in higher overall nucleation and growth of crystals, since the spatial averages of the nucleation and growth rates over the crystallizer are of similar magnitudes for different inlet velocities (see Figures 12 and 13). The longer residence time for the lower inlet velocities allow more time for crystals to grow, hence broadening the crystal size distribution. The simulation results agree with the experimental observations reported in Mahajan and Kirwan (1996) for the same lovastatin system.
coincident with the spatial distribution of the nucleation and growth rates (see Figures 12 and 13), due to their dependency on supersaturation. Based on the supersaturation values in Figure 11, it can be concluded that nucleation in the impinging jet crystallizer was dominated by the primary homogeneous mechanism. v = 1.0 m/s
v = 6.0 m/s
5
average f (no./μm-ml)
10
Figure 12 Nucleation rates (#/s-m3) of lovastatin in the mixed environment along the symmetry plane of the mixing chamber of the confined impinging jet (left inlet: lovastatin saturated in ethanol, right inlet: water). v = 1.0 m/s
v= v= v= v= v= v=
4
10
1 m/s 2 m/s 3 m/s 4 m/s 5 m/s 6 m/s
3
10
0
10
20
30 40 50 crystal size (μm)
60
70
80
Figure 14. Crystal size (longest dimension) distributions of lovastatin obtained from the confined impinging jet crystallizer for different inlet velocities.
v = 6.0 m/s
4.2 Effects on Polymorphic Systems. The polymorphic crystallization of l-histidine (stable form A and metastable form B) in a water-ethanol mixture in a confined impinging jet was simulated. The supersaturation and nucleation rates and growth rates of form A and B in the mixed environment for the inlet velocity of 6 m/s are shown in Figures 15 to 17. Overall, the supersaturation is lower and the nucleation rates are slightly higher for polymorph B, but the growth rates are comparable for both polymorphs. The crystal size distribution at the outlet is shown in Figure 18. The higher nucleation rates for polymorph B is consistent with the larger number of form B crystals produced. The shape of the crystal size distributions for each polymorph is similar due to the similar growth rates of the polymorphs, under these process conditions. Here, the Ostwald’s rule of stages is not entirely satisfied since both stable and metastable polymorphs are nucleated simultaneously, which is consistent with the experimental data reported
Figure 13 Growth rates (μm/s) of lovastatin in the mixed environment along the symmetry plane of the mixing chamber of the confined impinging jet (left inlet: lovastatin saturated in ethanol, right inlet: water).
Figure 14 shows the crystal size distribution at the outlet of the impinging jet for different inlet velocities. The crystal size distribution is much broader with much higher crystal numbers and mass produced with relatively small reduction in
8
Polymorph A
in Kitamura et al. (1994) and Roelands et al. (2006). Polymorph A
Polymorph B
Figure 17 Growth rates (μm/s) of L-histidine in the mixed environment along the symmetry plane of the mixing chamber of the confined impinging jet for the inlet velocity of 6 m/s (left inlet: L-histidine saturated in water; right inlet: L-histidine saturated in water and ethanol in a 3:2 volume ratio).
Figure 15 Supersaturation (c/c*) of L-histidine in the mixed environment along the symmetry plane of the mixing chamber of the confined impinging jet for the inlet velocity of 6 m/s (left inlet: L-histidine saturated in water; right inlet: L-histidine saturated in water and ethanol in a 3:2 volume ratio).
7
10
Polymorph B
average f (no./ μm-ml)
Polymorph A
Polymorph B
v= v= v= v=
6
10
2 m/s, 2 m/s, 6 m/s, 6 m/s,
Form Form Form Form
A B A B
5
10
4
10
0
0.5
1
1.5 2 2.5 crystal size (μm)
3
3.5
4 -3
x 10
Figure 18 Crystal size distributions of polymorphs A and B of L-histidine obtained from the confined impinging jet crystallizer for different inlet velocities. 0.5
Figure 16 Nucleation rates (#/s-m3) of L-histidine in the mixed environment along the symmetry plane of the mixing chamber of the confined impinging jet for the inlet velocity of 6 m/s (left inlet: L-histidine saturated in water; right inlet: L-histidine saturated in water and ethanol in a 3:2 volume ratio).
v = 2 m/s v = 6 m/s
XA
0.45
0.4
0.35
As illustrated in Figure 18, the variation of the crystal size distribution with inlet velocity is consistent with the observations for the lovastatin system in the previous section. The fraction of polymorph A, on the basis on number density, can vary with crystal size and is dependent on the inlet velocity (see Figure 19).
0
0.5
1
1.5 2 2.5 crystal size (μm)
3
3.5
4 -3
x 10
Figure 19 Fraction of polymorph A ( X A = f A ( f A + f B ) ) obtained from the confined impinging jet crystallizer for different inlet velocities.
9
Note that in initial stages of process development, the pharmaceutical compound is usually available in very small amounts. This makes it difficult to carry out numerous trial-and-error experiments to determine the operating conditions that give a desired crystal size distribution. Simulation tools could provide a technological advancement to industrial crystallization and process development in the pharmaceutical industry, by making it possible to design crystallizers in-silico to give the desired crystal size distributions or the desired polymorph. The development of a crystallization process would be done in the following steps:
4.3 Design of Impinging Jet Crystallizers. The above consistencies between simulation and experiments indicate that the CFD-micromixingpopulation balance model is a promising approach to simulate the crystal size distribution for antisolvent crystallization in impinging jet crystallizers. From the industrial point of view, Figure 14 are already accurate enough to guide the selection of operations of a confined impinging jet towards a desired crystal size distribution, which depends on the method of drug administration and its dissolution requirements. Similar plots as Figure 14 could be computed for different 3D geometries for the confined impinging jet (for example, geometries with different amounts of space above the confined jets, or with different diameters for the inlet and outlet pipes), and used to guide the design of the geometry to achieve a particular desired CSD. In the case where polymorphs are present for the system, Figures 18 and 19 indicate that it is possible to tailor the crystal size distribution and polymorph ratio, by adjusting the inlet velocity, for achieving the desired crystal size distribution as well as designing a more efficient solventmediated transformation process in the subsequent step.
1. For a given antisolvent-solvent-solute crystallization system, hydrodynamicsindependent crystallization kinetics would be first determined by using small amounts of the pharmaceutical compound, for example, with the use of microfluidic devices. Many designs for microfluidic devices have been developed to mix fluids in very short times, so that the system is not transport-limited (Squires and Quake, 2005). 2. With a validated macromixing-micromixing model and the estimated crystallization kinetics, the CFD-micromixing-population balance model is used to simulate the crystal size distribution for a wide range of operating conditions. The simulation results then can be used to identify the set of operating conditions that produces the crystal size distribution that meets the bioavailability requirements.
5. Conclusions In this paper, the capability of the CFDmicromixing-population balance algorithm is demonstrated by modeling the full crystal size distribution for antisolvent crystallization in stirred tanks and impinging jets. For the effects of mixing speed in the stirred tank and effects of jet velocity of the impinging jets, the simulation results agrees well with published experimental data. The simulation method enables an investigation into the variation of other operating variables (e.g., addition rate for stirred tanks, inlet concentrations for impinging jets), and design variables (impeller type for stirred tanks, distance between jet outlets in impinging jets) to determine their effects on the crystal size distribution and the ratio of polymorphs. This coupled algorithm can be further coupled with multiphase models to achieve a better accuracy for the particle flow field. Other crystallization process, if significant for a particular system, such as secondary nucleation, aggregation, and breakage, can be easily included into the simulation code.
This design strategy would allow a crystallizer and its operations to be designed in a systematic engineering manner. The feasibility of various control strategies can also be accessed in the simulations. In addition, it would reduce the use of pharmaceutical compound to a minimum, and with the availability of faster computers, this process design would be done in shorter times. Acknowledgements The authors acknowledge the Institute of Chemical and Engineering Sciences (ICES, Singapore) and the National Center of Supercomputing Applications (NCSA) for the computational resources.
10
science and regulation in pharmaceutical inhalation drug products. Crystal Growth & Design 5(6): 2261-2267. Paul, E. L., Tung, H. H. and Midler, M. (2005). Organic crystallization processes. Powder Technology 150(2): 133-143. Roelands, C. P. M., Jiang, S., Kitamura, M., terHorst, J. H., Kramer, H. J. M. and Jansens, P. J. (2006). Antisolvent crystallization of the polymorphs of L-histidine as a function of supersaturation ratio and of solvent composition. Crystal Growth & Design 6(4): 955-963. Shekunov, B. Y. and York, P. (2000). Crystallization processes in pharmaceutical technology and drug delivery design. Journal of Crystal Growth 211(1-4): 122-136. Squires, T. M. and Quake, S. R. (2005). Microfluidics: Fluid physics at the nanoliter scale. Reviews of Modern Physics 77(3): 9771026. Torbacke, M. and Rasmuson, A. C. (2004). Mesomixing in semi-batch reaction crystallization and influence of reactor size. AIChE Journal 50(12): 3107-3119. Wey, J. S. and Karpinski, P. H. (2002). Batch Crystallization. Handbook of Industrial Crystallization. A. S. Myerson. Boston, Butterworth-Heinemann: 231-248. Woo, X. Y., Tan, R. B. H., Chow, P. S. and Braatz, R. D. (2006a). Simulation of mixing effects in antisolvent crystallization using a coupled CFD-PDF-PBE approach. Crystal Growth & Design 6(6): 1291-1303. Woo, X. Y., Tan, R. B. H. and Braatz, R. D. (2006b). Modeling and CFD-PBEMicromixing Simulation of Impinging Jet Crystallizers. Submitted to Crystal Growth & Design. Yu, Z. Q., Tan, R. B. H. and Chow, P. S. (2005). Effects of operating conditions on agglomeration and habit of paracetamol crystals in anti-solvent crystallization. Journal of Crystal Growth 279(3-4): 477-488.
References Braatz, R. D. (2002). Advanced control of crystallization processes. Annual Reviews in Control 26(1): 87-99. Fluent 6.2 UDF Manual (2005). Lebanon, NH, Fluent Inc. Fluent 6.2 User's Guide (2005). Lebanon, NH, Fluent Inc. Fox, R. O. (2003). Computational Models for Turbulent Reacting Flows. Cambridge, U. K., Cambridge University Press. Fujiwara, M., Nagy, Z. K., Chew, J. W. and Braatz, R. D. (2005). First-principles and direct design approaches for the control of pharmaceutical crystallization. Journal of Process Control 15(5): 493-504. Johnson, B. K. and Prud'homme, R. K. (2003). Chemical processing and micromixing in confined impinging jets. AIChE Journal 49(9): 2264-2282. Kitamura, M., Furukawa, H. and Asaeda, M. (1994). Solvent effect of ethanol on crystallization and growth-process of Lhistidine polymorphs. Journal of Crystal Growth 141(1-2): 193-199. Kresta, S. M. and Brodkey, R. S. (2004). Turbulence in Mixing Applications. Handbook of Industrial Mixing. E. L. Paul, V. A. Atiemo-Obeng and S. M. Kresta, Ed. Hoboken, N. J., John Wiley & Sons, Inc.: 1988. Kurganov, A. and Tadmor, E. (2000). New highresolution central schemes for nonlinear conservation laws and convection-diffusion equations. Journal of Computational Physics 160(1): 241-282. Mahajan, A. J. and Kirwan, D. J. (1996). Micromixing effects in a two-impinging-jets precipitator. AIChE Journal 42(7): 18011814. Midler, M., Paul, E. L., Whittington, E. F., Futran, M., Liu, P. D., Hsu, J. and Pan, S.-H. (1994). Crystallization Method to Improve Crystal Structure and Size. Merck & Co., Inc. U. S. Patent 5,314,506. Mullin, J. W., Teodossiev, N. and Sohnel, O. (1989). Potassium-Sulfate Precipitation from Aqueous-Solution by Salting-out with Acetone. Chemical Engineering and Processing 26(2): 93-99. Nagao, L. M., Lyapustina, S., Munos, M. K. and Capizzi, M. D. (2005). Aspects of particle
11