Hindawi Journal of Sensors Volume 2017, Article ID 9781307, 11 pages https://doi.org/10.1155/2017/9781307
Research Article Developing a Tile-Based Rendering Method to Improve Rendering Speed of 3D Geospatial Data with HTML5 and WebGL Seokchan Kang and Jiyeong Lee Department of Geoinformatics (GSE), University of Seoul, 163 Seoulsiripdae-ro, Dongdaemun-gu, Seoul, Republic of Korea Correspondence should be addressed to Jiyeong Lee;
[email protected] Received 26 April 2017; Accepted 6 September 2017; Published 19 October 2017 Academic Editor: Lei Zhang Copyright © 2017 Seokchan Kang and Jiyeong Lee. This is an open access article distributed under the Creative Commons Attribution License, which permits unrestricted use, distribution, and reproduction in any medium, provided the original work is properly cited. A dedicated plug-in has been installed to visualize three-dimensional (3D) city modeling spatial data in web-based applications. However, plug-in methods are gradually becoming obsolete, owing to their limited performance with respect to installation errors, unsupported cross-browsers, and security vulnerability. Particularly, in 2015, the NPAPI service was terminated in most existing web browsers except Internet Explorer. To overcome these problems, the HTML5/WebGL (next-generation web standard, confirmed in October 2014) technology emerged. In particular, WebGL is able to display 3D spatial data without plug-ins in browsers. In this study, we attempted to identify the requirements and limitations of displaying 3D city modeling spatial data using HTML5/WebGL, and we propose alternative ways based on the bin-packing algorithm that aggregates individual 3D city modeling data including buildings in tile units. The proposed method reduces the operational complexity and the number and volume of transmissions required for rendering processing to improve the speed of 3D data rendering. The proposed method was validated on real data for evaluating its effectiveness in 3D visualization of city modeling data in web-based applications.
1. Introduction Most three-dimensional (3D) spatial information services have been developed as desktop applications and require installing specialized plug-ins for visualizing 3D spatial data in web environments (e.g., Internet Explorer (IE) uses ActiveX, while Chrome, Safari, and Firefox use NPAPI). The advantages of plug-ins include (1) high service convenience, which enables easy cooperation of websites that use the same plug-in, and (2) limitless expansion of web browser functions, which is available by installing a variety of plugin applications. However, the plug-in method has some disadvantages: (1) unnecessary duplication of applications owing to different technologies used by different browsers, (2) frequent installation errors, (3) limited support for crossbrowsers and cross-platforms, and (4) security vulnerability owing to the possibility that malware is distributed along with the plug-in. Consequently, the reliance on the plug-in technology, which does not comply with the standard and
is problematic, has been increasingly diminishing. In the end, Netscape Plug-In Application Programming Interface (NPAPI) was discontinued in September 2015, and Windows 10 started to provide Edge browser, which does not support ActiveX since July 2015. According to the technological trends to reject nonstandards, web technology has also started developing to enable a variety of functions in compliance with the standard. Because it provides various functions without requiring extra plugins, HTML5 has been determined as a web standard since 2014, and WebGL technology that enables displaying 3D graphics in web browsers has been adopted in areas that utilize 3D technology. Many studies have been conducted to develop methods to provide 3D spatial data services utilizing WebGL technology. Most existing researches focus on developing display methods, including methods to express 3D spatial data using WebGL or methods to identify graphic display performance of WebGL. Although WebGL can be used to display 3D data,
2 it suffers from the problem of slow rendering when largeamount and large-capacity data need to be expressed. The problem of slow speed can be divided into two subproblems. First, WebGL technology is characterized by a relatively slow operation speed for script-based operations compared with native technology (plug-in methods). The difference may not be significant when simple and low-capacity 3D objects are displayed, but most 3D spatial data have large volume, which results in a significant difference in the operation speed for rendering. Second, repeated transmission of large amounts of data on the web suffers from traffic load and transmission delays, which affects the rendering speed. Although WebGL can control graphics processing unit (GPU) acceleration in browsers, there are limitations on processing, such as problems with software when considering the characteristics of the web. In order to improve the rendering speed of 3D spatial data by accounting for the technological characteristics of WebGL and web environment, we propose a tile-based rendering method that aggregates individual 3D modeling data into tile unit-based data. Most 3D data are provided in the format of tile maps for fast data service. Modeling data, however, are composed of object units, so that multiple objects exist in a single tile. In addition, individual rendering processing is computationally expensive and timeconsuming. To overcome these problems, we propose an alternative approach in which data are organized in tile units, which significantly reduces the computational complexity and the volume of transmissions required for rendering, consequently increasing the speed of rendering. The remainder of this paper is organized as follows. In Section 2, we review the existing researches on improving the rendering speed of 3D spatial data, focusing on the characteristics and limitations of rendering methods of HTML5 and WebGL. In Section 3, we present how to aggregate data in tile units for improving the rendering speed of 3D spatial data. We describe a method for data organization in tile units, which amounts to first dividing the face that forms the modeled data and then rearranging the divided face according to the tiles. For rearrangement with tile units, we use the bin-packing loading technique for lightening. In Section 4, the data that are rearranged in tile units and that in object units are compared in terms of their rendering speed, to confirm that the former method yields a faster rendering speed than the latter. In Section 5, we discuss the limitations of the proposed method and some future research directions.
Journal of Sensors this has been widely used in most 3D spatial information services. Some disadvantages of frustum culling include its computational complexity, because in this approach equations of all planes need to be satisfied. One of the tree data structures, quad-tree, has four child nodes. It enables fast search of spatial information in cases of extensive topography. Octree, a type of volume modeling presented in the early 1980s [2], is useful for fast searches of spatial information in dense regions, including indoor environments. On the other hand, the disadvantage of both the quad-tree and octree approaches is that they require searching all areas included in the border when loading data on a divided border. LOD is a model developed with the rationale that “fewer high-detail features of a distant object are visible” mentioned by James Clark in 1976; it can improve the rendering speed when an object is expressed on a screen with multiple levels of resolution. LOD can be further categorized into static LOD and dynamic LOD, according to the data storage method. The dynamic LOD method calculates and displays LOD whenever a camera is moved, and this approach is not useful for processing large-capacity 3D spatial information. Thus, the static LOD approach is mostly used for 3D spatial information services. The tile map service approach, which provides map data by organizing the data into tile units, efficiently uses storage to service data established in tile units. Storage of map data is served by saving map areas in tile images by scale. The tile map service approach shortens the map production time and improves performance. On the other hand, this approach requires establishing new tiles for refreshing the data and is difficult to manage owing to a number of folders and files composed according to the tile format.
2. Review of Relevant Researches and Technologies
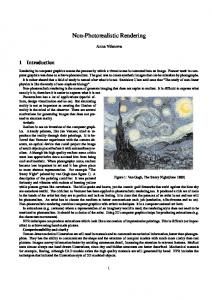
2.2. Methods for Rendering HTML5/WebGL-Based 3D Spatial Data. Being an alternative standard for HTML 4.01, XHTML 1.0, and DOM Level 2 HTML, HTML5 was created to allow easy streaming of various additional functions, including video and audio, and up-to-date multimedia contents in browsers without ActiveX [3]. HTML5 enables various functions without plug-ins. WebGL, a web-based graphic library, can be used with JavaScript programming language, and interactive 3D graphics can be used in compatible web browsers. Hardware acceleration is available without having to install extra plugins, which enables fast-speed rendering of 3D objects (Figure 1); having been made public as standard Application Programming Interface (API), it is available for free and is limitless [4].
2.1. Researches on Improving Rendering Speed of 3D Spatial Data. Various methods have been developed to increase the rendering speed of 3D spatial data, including frustum culling, quad-tree/octree, level of detail (LOD) approach, and tile map services. Frustum culling is an approach in which only visible parts are rendered [1]. Using the frustum culling technique in combination with the quad-tree (or octree) technique enables efficient service of extensive large-capacity 3D spatial data;
2.2.1. Limitations of WebGL Rendering. As for the current status of HTML5/ WebGL-based 3D spatial information services, there have been limited services; some have been served in a single layer by combining topography and building, while others have been served with separated topography and building without texture. As such, the reason underlying limited servicing of 3D spatial data is technological limitations in HTML5/WebGL. For instance, the limitations related to rendering technology are as follows.
Journal of Sensors
3 process of relocation based on tiles, the bin-packing loading technique is used (Figure 2).
WebGL General ggraphic p
Browser
WebGL
OS
Driver
OpenGL
H/W
GPU
Figure 1: Comparison of general graphics and WebGL graphics processing approaches.
First, WebGL creates a bottleneck by using JavaScript. Refreshing speed of a screen is critical for displaying 3D data, but execution of script-based code is slower than that of binary-based (e.g., written in the C language) code. While computers with excellent specifications ensure good speed, computers with low specifications or mobile devices are usually slower. Second, when transmitting large-amount and largecapacity 3D data using the HTTP method in a web environment, delays can occur. Rendering large-capacity mesh and texture data on the web is slower than rendering locally stored data and introduces significant data transmission traffic.
3. Improving the Rendering Speed of HTML5/WebGL-Based 3D Spatial Data 3D data that significantly affect rendering are 3D city modeling data, especially data that describe buildings and bridges. Data modelers use frustum culling, the LOD approach, and other methods, to select rendering targets, and rendering is performed object-by-object even in simplified scenarios. Therefore, the more the target objects for rendering are, the longer the rendering delay is owing to the load on central processing units (CPUs) and GPUs. Here, we present a method for organizing data in tile units, to reduce the abovedescribed load. The data in this study were provided by the V-World project funded by Ministry of Land, Infrastructure, and Transport of South Korea, and individually compromised model data were reorganized in tile units. Modeling data consists of objects and images. The object and the image are separated and reassembled into a tile unit. To reconstruct the modeling data in tile units, the surfaces constituting individual data blocks are separated based on the normal vector. For each object file there is the image file, which includes the coordinates of the surface to be mapped. Then, the separate objects and image files are reassembled based on the tiles. The UV coordinates in the image file are reconfigured by the object basis and are recalculated by tiles. To minimize the amount of memory required in the
3.1. Division of Objects for Aggregation of Modeling Data. To aggregate modeling data in tile units, modeling data need to be divided first. Division of modeling data is for tilebased reorganization. Aggregating modeling data simply in sequence results in the unused space in regions between object faces; thus, it is necessary to reorganize objects to minimize the waste of space. For data division, “Normal Vector-Based Face Division Module” presented in “Advancement of 3D Spatial Information Processing Technology” of “Development of Advanced Technology for Spatial Information Open Platform Infrastructure” was employed. The method of dividing objects separates faces based on normal vectors. By creating a set of triangles with the same normal vector and deciding whether the plane is 3D, division by normal vectors was completed. Algorithm 1 shows the code that combines triangles with the same normal vector by organizing the modeling data into triangular units. All faces of the number of triangles are searched from faces of the modeled object. Later, a normal vector is calculated except for the faces with size. After obtaining the normal vector, the same normal vectors are collected and the coordinates of the actual triangle as well as the UV coordinates of the defined object are saved. The process of separating an object using the source defined in Algorithm 1 is as follows. First, normal vectors for all triangles constituting the object are estimated to collect the object faces and to divide them according to normal vectors. Second, for each triangle the normal vector of the triangle was calculated based on the cross-product of two vectors that constituted the triangle [5]. The normal vector of a triangle points in the direction faced by the corresponding face, and there can be multiple triangular planes with the same directivity on an object. However, because even triangles with the same normal vector cannot be determined to be in the same 3D plane, it is necessary to add variables such as the distance from the origin to the normal vector to decide whether the triangles are in the same plane. In addition, by moving a certain amount toward the actual normal vector according to the normal vector 3D plane based on collected faces, it is possible to identify the list and the number of triangles of the collected faces [5]. According to the face division of an object, the texture should be divided as well. The texture image surrounding a 3D modeling object was mapped in terms of real coordinates, with (0, 0) for the top left corner and (1.0f, 10.f) for the bottom right corner. Therefore, the texture mapping coordinates (UV) of faces divided by the corresponding normal vectors correspond to square areas of the texture image, which makes it possible to separate images in the original data. Furthermore, for each face, the list of vertex coordinates of triangles includes texture mapping coordinates, and separated image areas can be estimated by converting the size and ratio of images for square area where triangular lists include all texture UV coordinates [5].
4
Journal of Sensors Model’s faces Input Modeling object
Separate
Merge
2
function
function
1 3
…
1
2
Output Modeling object
Model’s
3
textures
One tile includes the following: Separate by (i) Modeling: 1, 2, 3, · · ·, n normal vector (ii) Texture: 1, 2, 3, · · ·, n
Bin-packing problem concept
One tile includes the following: (i) Modeling: 1 (ii) Texture: 1
Figure 2: Modeling merge dataflow diagram.
Figure 3: Result of texture image segmentation by face segmentation.
The result of dividing texture according to the object’s face division is shown in Figure 3; it shows that a single texture file is divided into several texture files. 3.2. Organizing Separated Objects into Tile Units. After completing the division of modeling data, the divided objects need to be combined in a single object. For organizing the objects into tile units, the normal vector that was used for dividing the objects was used during this stage. By extracting object faces with the same normal vector, the divided faces of each object are rearranged based on tiling. The UV of texture mapped on the object face is recalculated according to the divided faces, and in the process of creating a single image from the criterion of object to the criterion of tile, UVs of the divided faces are mixed to yield a UV that covers all tiles [6]. For combination of texture, items with sizes over 1024 pixels were downsized to 1024 pixels. The V-World project implemented by a mapping agency in Korea provides 3D object rendering by modifying textures with over 2048 pixels
to 2048 pixels. The reason is that rendering of a region with many high-resolution textures requires significant memory and reduces performance. As the method of tiles yields many more textures compared with the object method, 1024 pixels were applied to prevent texture size from improving. We compare the images expressed using 2048 pixels with those expressed using 1024 pixels. Although the resolutions are different, the two images were deemed the same in terms of their information content. In the process of organizing modeling data into tile units, the tiling of upper levels also included modeling objects. Using the existing object method, modeling data were stored only in Level 15 as seen in Figure 4. For rendering of modeling objects, the map screen should be enlarged to Level 15; it can render only nearby objects. If data are arranged by each level using the object method, large-amount data are rendered, causing a system load; as such, rendering is available only in the lowest level.
Journal of Sensors
5
(1) function DivideFaceNormal(idx, facelist) (2) { (3) //declare variables (4) u16 i0, i1, i2; // triangular’s node Index (5) S3DVertex v0, v1, v2; // triangular’s Vertex (6) vector3df sub0, sub1, sub2; // face’s point (7) vector3df sv; // face(Triangular) (8) vector3df norm; // face’s normal vector (9) float sd; // plane (10) (11) //One face consists of three points. Divide the total number of nodes by 3. (12) for (j=0 to all triangular count) { (13) (14) //Use the value divided by 3, multiply by 3 to obtain the index. (15) i0 = first triangular node; //first node (16) i1 = second triangular node; //second node (17) i2 = third triangular node; //third node (18) (19) //Vertex information is obtained using the node information. (20) v0 = first vertex of node; (21) v1 = second vertex of node; (22) v2 = third vertex of node; (23) (24) //Get triangle information. (25) sub0 = v0 - v1; (26) sub1 = v1 - v2; (27) sub2 = v2 - v0; (28) (29) create norm is normal vector of sub0; //Find the normal vector of the triangle. (30) set 3dplane is (v0 point, norm); //3d plane containing a triangle (31) (32) l = -1; (33) set List = list of norm; //Normal vector list (34) for (k = 0 to List) { (35) //Calculate the normal vector direction value (36) sv = (normal vector of list[k]) - norm; (37) sd = (plane direction of list[k]) - (directoin of 3dplane); (38) (39) if (sv.x is almost to 0 and sv.y is almost to 0 and sv.z is almost to 0) { (40) l=k; (41) add triangular vertex (v0, v1, v2); (42) break; (43) } (44) } (45) } (46) (47) //If the normal vector does not have similar faces, create a new one. (48) if(l == -1) { (49) create NF is New face; //Create new face (50) set NF plane is (v0 point, norm); //input face’s information (51) insert triangular vertex(v0, v1, v2) into NF; (52) insert NF into list; (53) } (54) } Algorithm 1: Computer code for object splitting.
6
Journal of Sensors Table 1: Classification of data by levels. 11
11
12
12
13
133
14
144
15
155
Level 15 14 13 12 11 10
Applicable size All modeling data Diagonal length greater than 50 meters Diagonal length greater than 65 meters Diagonal length greater than 84 meters Diagonal length greater than 109 meters Diagonal length greater than 142 meters
Figure 4: Setting a modeling object per tile. 4
In the process of reorganization into tile units, the upper levels include modeling objects so that distant objects can be rendered (Figure 4). Although the disadvantage of this is redundant arrangement by levels, the number of renderings was reduced by organizing the data into tile units, the size of the data was reduced by limiting the image size to 1024 pixels, and the upper levels now could include data. For composition of modeling by levels, the size of the modeling data was used; the modeling object was applied only to Levels 10–15 as it was considered difficult to identify modeling objects with naked eye for levels above Level 10. As for the division criterion by levels, the diagonal length of the area (polygon) constituting the object was used. The entire modeling was created in Level 15 and modeling with diagonal length over 50 m in Level 14, and a factor of 1.3 was applied to upper levels (Table 1). A single image was created by recombination after dividing multiple texture files based on the normal vectors. By combining several texture files that describe the model data into a single texture file, the volume of data transmission can be reduced.
2
1
2
3 1
2 1
1 4
2 A A
B
B
3 C
C
Figure 5: Schematic of the bin-packing problem for a sample case.
Declare space as an array to organize in tile units
Import objects to load
Select a space in the array to place the objects to be loaded
Place objects in the space
3.3. Application of the Bin-Packing Loading Technique. The bin-packing problem (BPP) amounts to deciding the minimal number bins required for representing all objects when there are bins with the same capacity as finite objects with different sizes. That is, the question is how to pack as many objects with different volumes as possible in a limited space. As shown schematically in Figure 5 for a sample case study, the problem amounts to finding the optimal way to pack different-size objects into the bins A, B, and C, minimizing the empty space. Texture data are the most influenced by rendering when displaying modeling data. For texture reorganization when mapping modeling objects into tile units, we attempted to lighten materials by introducing BPP. This is because even tile images included in other objects in the process of loading data based on tiles should be mixed together and rearranged to minimize wasted space. For tile-based data loading, space is declared in an array to create tile units. Since image files are created in multiples of 2, the entire area is divided into four and space is assigned as an array. Then, space is searched to allocate targets to load and place them in correct positions. A search for overlaps is performed, following which the space is divided, and wasted (empty) space is removed (Figure 6) [6]. Algorithm 2 shows the source code that calculates the UV area of texture and rearranges based on tiles by introducing
Inspect all space overlapping the placed object
Split space overlapping placed objects
Eliminate invalid space (space included in another space or having a negative height or width value)
Figure 6: Tile data loading order.
the concept of BBP. To create the bin-pack operator and load several images in an empty space, information about images needs to be provided (such as coordinates and size). Based on the provided information, the loading space is defined and the images are rearranged. After rearranging, the information on width, length, size, and starting point is loaded to recalculate the loading location based on the empty space and rearrange the images again. Lastly, a remainder that is left without space is defined for further allocation.
Journal of Sensors
7
(1) function TextureBinPack2D(twidth, theight) (2) { (3) // Define BinPack Content. (4) create Content is BinPack2D; (5) (6) // Obtain the total number of divided images. (7) get spiltFaceNum is All count of split face; (8) (9) // Image’s Face Search. (10) for (i = 0 to spiltFaceNum) { (11) ti = texture index of Face; (12) if(ti>-1 and not contain) { // If a texture index exists, it gets the size of the image. (13) set width = width of Image[ti]; (14) set height = height of Image[ti]; (15) (16) //Set Image rect and save the image area. (17) set ss