International Education Journal, 2006, 7(4), 580-597. ISSN 1443-1475 © 2006 Shannon Research Press. http://iej.com.au
580
Developing and validating instruments for measuring democratic climate of the civic education classroom and student engagement in North Sulawesi, Indonesia Sulaiman Mappiasse Flinders University, Australia
[email protected] Using the Rasch Rating Scale model, data collected from 200 ninth grade students in North Sulawesi Indonesia were analysed. This analysis sought to validate instruments developed to measure the Democratic Climate of Civic Education Classrooms (DCCEC) and Student Engagement in Civic Education Classrooms (SECEC). Category used, item and person separation reliability (ISR and PSR), item and person separation index (ISI and PSI), item ordering, person and item fit were examined in the analysis. The results indicated the reliability of items to be used in other studies that involved students from classrooms with similar climates. Civic education, democratic climate, classroom engagement, Rasch rating scale analysis As a new democratic country, Indonesia needs to improve democratic values among young people through its education system. These values could only be nurtured effectively in a context that allowed them to be understood, appreciated and applied. As the classroom is the centre of the learning process in Indonesia, the classroom needs to be democratic and engaging in order to make learning in it meaningful. In order to evaluate both attributes, it is important to have valid instruments for measuring them. This study sought to develop and validate instruments for measuring the degree of democratic climate of the civic education classroom and of students’ classroom engagement. Measures for the democratic climate of classrooms and student engagement were developed based on published literature and operationalised using a descriptive type Likert scale with four categories (0=never; 1=rarely; 2=sometimes; 3=often). Instrument testing involved 200 Grade 9 students (n=200) in North Sulawesi, Indonesia. Before using both instruments in further studies, it was necessary to examine their reliability and validity. For this purpose, responses were analysed using the Rasch Rating Scale model. The analysis involved category used, item and person separation reliability (ISR and PSR), item and person separation index (ISI and PSI), item ordering, person and item fit. LITERATURE REVIEW
Democratic Climate of Classroom Fraser and Walberg (1991) viewed learning environments as social-psychological contexts where learning took place (2001). Johnson and McClure (2004) defined the classroom learning environment as a social atmosphere in which learning took place that was sometimes called the ‘educational environment’ or ‘classroom climate’. Kubow and Kinney (2000) argued that classroom climate was related to how teaching was conducted in the classroom setting. More
Mappiasse
581
specifically, Moos (1979) conceptualised it as a system that had four variables, namely physical environment, organisational aspects, teacher characteristics, and pupil characteristics and the classroom climate was viewed as the mediator between these variables that operated through interactions among class members, teachers and students. This process was influenced by the orientation, the quality and the quantity of interactions and intercommunications between the classroom members (Allodi, 2002). These in turn affected student satisfaction, self-concept and the learning processes that influenced learning outcomes. Research into classroom environments has been carried out over many years. Different studies have been undertaken to investigate a variety of aspects related to the effects of the classroom environment. These studies have ranged from investigating factors influencing learning environments to the students’ perceptions of their classrooms, and the relationship between students’ perceptions of their classrooms and their learning outcomes. These studies have been extended to cover schools and families (Parsons, 2002). In addition, the research workers have conducted studies about the effects of the classroom environment on the learning of different subject matter in different parts of the world. Aikin (1942) studied the effects of democratic processes in the classrooms and the schools in The Eight Year Study in the United States (Morgenstern and Keeves, 1997). Kim, Fisher and Fraser (1999) investigated science classroom environments; Waldrip and Fisher (2003) investigated the differences between urban and country students’ perceptions of their learning environments (Dorman, 2003); and Guthrie and Cox (2001) investigated the school and classroom context that would make students want to engage in reading longer. From learning environment studies, several theories have been developed and used to investigate psychological aspects of learning environments. Those theories are Lewin’s (1951) field theory (Rosch, 2002), Bandura’s (1986) social cognitive theory (Compeau, Higgins and Huff, 1999) and Bronfrenbrenner’s (1977) ecological model of human development, and Watzalawick’s theory of human communication (Allodi, 2002; Watzlawick, Beavin and Jackson, 1968). Kubow and Kinney (2000) developed eight characteristics for a democratic classroom to foster democracy in the classroom. These characteristics were: (a) active participation; (b) avoidance of textbook dominated instruction; (c) reflective thinking; (d) student decision-making and problemsolving choices; (e) controversial issues; (f) individual responsibilities; (g) recognition of human dignity; and (f) relevance. These characteristics would appear to be meaningful and feasible to employ because they represented the nature of civic education. The use of these characteristics made it possible to identify a classroom that was capable of providing students with open, active, and engaging classroom learning experiences.
Student Engagement Research workers in this field have divided engagement in classroom learning into three categories, namely behavioural, cognitive, and emotional engagement. Behavioural engagement consisted of actions, such as, following the rules, adhering to the classroom norms, and the absence of disruptive behaviours, for example, skipping school or getting into trouble, participating in classroom learning and academic tasks, persistence, effort, attention, asking questions, and participating in school-related activities. Emotional engagement included students’ positive and negative affective reactions in the classroom, students’ emotional reactions to the school and the teacher, feeling of being important to the school, and valuing success in schoolrelated outcomes. Cognitive engagement was conceptualised in terms of a psychological investment in learning, a desire to go beyond the requirements of school, and a preference for challenge through being strategic or self-regulating (Fredricks, Blumenfeld, Fiedel, and Paris, 2003; Fredricks, Blumenfeld, and Paris, 2004).
582
Developing and validating instruments for measuring democratic climate
Studies have been undertaken to identify the correlation between behavioural engagement and learning outcomes for elementary and high school students (e.g. Alexander et al., 1993; Alexander et al., 1997; Alvermann et al., 1987a; Alvermann et al., 1987b; Ames, 1992; Ames and Archer, 1988; Conchas, 2001; Finn et al., 1991; Finn et al., 1995; Finn and Rock, 1997; Finn and Voelkl, 1993; Guthrie and Cox, 2001; Guthrie et al., 2001; Guthrie and Wigfield, 2000; Meece, 2003; Miller and Meece, 1997; Miller and Meece, 1999; Voelkl et al., 1999; Walberg, 1979). Other studies have focused on the correlation between discipline problems, behavioural disengagement and achievement across grade levels (e.g. Aikins et al., 2005; Barker and Gump, 1964; Bates et al., 2003; Battistich et al., 2000; Chang, 2003; Chen et al., 2005; Connell et al., 1994; Conrad, 2004; Denham et al., 2003; Finn, 1989; Finn and Pannozzo, 2004; Fredricks and Eccles, 2002; Furrer and Skinner, 2003; Kern et al., 2001; Khine and Fisher, 2004; Ladd et al., 1999; Luster et al., 2004; Meehan et al., 2003; Snyder et al., 2003; Spira and Fischel, 2005; Valeski and Stipek, 2001; Wentzel, 1997). The pronounced finding was that behavioural engagement had long-term effects on student performance. The students who were found showing engagement and interest in their early grade levels were also found to be performing better in their later years (Fredricks et al., 2003). Brown (1997), Turner and Scott (1995) emphasised that social discourse in learning communities was intrinsically motivating. Furthermore, Wentzel (1991, 1997, 2002, 2003), Urdan and Maehr (1995) demonstrated that students’ possession of pro-social goals led to their constructive social behaviours in the classroom. Fredricks, Blumenfeld, Field and Paris (2002) found that there was a unique relation of a challenging and a structured work environment involving students’ affect, behaviour and cognition. Skinner and Belmont (1993) also found that there was a reciprocal relationship between teacher behaviour and student engagement in the classroom. Teacher interactions with students predicted student behavioural and emotional engagement in the classroom, both directly and through their effects on student perceptions of their interactions with teachers. In addition, Kindermann (1993) and Wentzel (2002) argued that there was an association between children peer groups and the amount of engagement the children showed in the classroom. Palinscar (1998) in his analysis of the theory of constructivism claimed that the growing interest in social constructivist perspectives was propelled by recent educational reform efforts encouraging students to assume a more active role in their learning, to explain their ideas to one another, to discuss disagreements, and to cooperate in the solution of complex problems, while teachers participated in the design of these contexts and the facilitation of this kind of activity. From social constructivist perspectives, according to Palinscar, interactions such as those achieved through classroom discussions were thought to provide mechanisms for enhancing higher-order thinking. In addition, discourse was argued to be the primary symbolic, mediational tool for cognitive development. However, to make it an effective context for learning, discourse must be communicative. Ryan and Patrick (2001) reported that there was some research supporting the argument that the social environment of the classroom would be very important for students’ motivation and engagement. Students who felt that they related to schools were more likely to have positive expectancies for success and appreciation of schools (Roeser, Midgley and Urdan, 1996). In addition, compared to traditional formats, classes organised cooperatively would increase efficacy, value, and the goal orientation of students (Turner, Meyer, Cox and Logan, 1998). Ryan and Patrick (2001) also argued that students would feel more efficacious about their ability to learn and to complete activities successfully when they had a greater array of resources on which to draw than if they were only working individually. This emphasised the importance of collaborative learning (Randolph, 2000; Wentzel, 2002).
Mappiasse
583
Greeno (1998) argued that engagement in activities also depended on the interactions of individuals with other people. Belenky (1997) studied activities in which women were supported in their participation in reflective problem solving and planning about themselves. She reported substantial changes in these women becoming more active and confident in their thinking and in their claims to understanding and knowing. Clark, Anderson, Kuo and Kim et al. (2003) also argued that collaborative discussions could facilitate children to engage in reasoned argumentation. Regardless of the distinctions made between different types of engagement, research has indicated the importance of student engagement in the classroom and school for both academic success and discipline. There was also a strong indication that the classroom and school environment played a social and psychological role to facilitate learning among students by providing conducive contexts. Based on these research studies, it is argued to be important to make students engage in learning activities in civic education classrooms in order to provide them with opportunities to obtain deeper understanding of the civic values transmitted through meaningful classroom experiences in order to enable them to implement them critically and responsibly in their social interactions. Even though research has shown that discussions in an open climate fostered civic learning of the students, research studies have not specifically investigated the effect of the democratic climate of classrooms on student civic learning. Furthermore, even though studies have been undertaken into the effects of student engagement on science learning, there has been no study conducted to investigate the effects of engagement on the civic learning of the students. This information becomes even more meaningful when it is linked to civic education programs in Indonesian schools that have sometimes been said to be unproductive in supporting democracy and civic learning. In order to achieve this goal, it is important to develop instruments to measure the Democratic Climate of the Civic Education Classroom (DCCEC) and Student Engagement in Civic Education Classroom (SECEC) for use in Indonesian schools. INSTRUMENT DEVELOPMENT Using the literature on the democratic climate of classroom and student engagement (Fredricks et al., 2002, 2003, 2004; Kubow and Kinney, 2000, Torney-Purta, Oppenheim and Farnen, 1975; Torney-Purta, Lehmann, Oswald, and Schulz, 2001; Torney-Purta, 1984) measures were developed. Eight characteristics of a democratic classroom proposed by Kubow and Kinney (2000) were modified to form seven scales to measure student perceptions of the Democratic Climate of Civic Education Classrooms. In constructing items for those seven scales, some items that were used in the IEA study for Civic Education in 2001 were adapted with some modification. The Student Engagement measures were adapted from the scales developed by Fredricks et al. (2003) that were basically used to assess primary school student engagement. Modification was done on this scale to suit the need for measuring classroom engagement in civic education classrooms for ninth grade students in North Sulawesi, Indonesia.
Democratic Climate of Classrooms This scale was hypothesised to involve seven dimensions: (a) Active participation; (b) Avoidance of textbook dominated instruction; (c) Reflective thinking; (d) Student decision-making and problem-solving choices; (e) Controversial issues; (f) Recognition of the human dignity; and (g)
584
Developing and validating instruments for measuring democratic climate
Relevance. The instrument consisted of 33 items using a Likert four-point scale (0=never, 1=rarely, 2= sometimes, 3= often).
Student Classroom Engagement This scale consists of three hypothesised dimensions.
Behavioural engagement This dimension represented participation in classroom learning and academic tasks such as paying attention, asking questions, participating in classroom activities, and absence of disruptive actions.
Emotional engagement This dimension represented students’ positive and negative affective reactions in civic education classrooms, such as feeling of interest, boredom, happiness, sadness, and anxiety.
Cognitive engagement This dimension represented psychological investment in learning involving self-regulation, or being strategic (Fredricks et al., 2003). These three dimensions were measured by an instrument consisting of 19 items using a Likert four-point scale (0=never, 1=rarely, 2= sometimes, 3= often). Those items were initially written in English and subsequently translated into Bahasa Indonesia because the respondents were Indonesian-speaking students. Unfortunately, no back-translation validation was done to check the accuracy of the initial translation of the items from English into Bahasa Indonesia. INSTRUMENT VALIDATION
Sample The sample consisting of 200 ninth grade students was a convenience sample. They were selected from five different schools with a different number of students in four different regencies in North Sulawesi, Indonesia. The questionnaire was given to the students when they were approaching their final examination to enter Senior High Schools.
Rating Scale In order to test the unidimensionality of the scale, a rating scale model was employed. The rating scale analysis is one of the Rasch measurement model procedures that is similar to the partial credit model. The difference is that it does not allow item format, categories and scale step values to vary across items (Fox and Jones, 1998; Huang and Page, 2002).
Reliability Using the Rasch model, both item separation index (ISR) and person separation reliability (PSR) can also be estimated (Wright and Masters, 1982). Person separation reliability is an estimate of how well a person can discriminate persons on the measured variable. This represents the replicability of person placement across other items measuring the same construct (Bond and Fox, 2001). Reliability is assessed using the Cronbach alpha coefficient. According to Wright and Master, PSR is calculated as
Mappiasse Rp =
585 SA 2 p SD 2 p
where SAp 2 is person variance adjusted for calibration error and SDp 2 is the total observed variance among persons on the measured variable. The expected value that indicates perfect reliability is 1.0 (Fox and Jones, 1998). The interpretation of the person separation reliability suffers from problems when the items fail to work together to define a single variable that leads to the usage of an alternative index called person separation index (PSI). This is calculated as Gp =
SAp SE p
where SAp is the adjusted person standard deviation and SE p is the average measurement error. This concept provides the estimate of the sample standard deviation in standard error units (Wright and Masters, 1982). The person separation index is not bound by 0 and 1 and a higher value is a better index to differentiate persons on the continuum. These indices are useful to compare the use of different scales across different classroom situations (Bond and Fox, 2001; Fox and Jones, 1998). These ideas also apply in the formation of the item separation reliability (ISR) and the item separation index (ISI).
Category Used Originally the instrument was administered using four response categories (0123). It was important to find out the best model for the scoring of the rating scale categories before running further analyses in order to obtain more reliable results and more meaningful interpretation of the data. In addition, it was essential to identify how and to what extent respondents used the rating scale categories (Fox and Jones, 1998, Bond and Fox, 2001). In order to find out an appropriate category scheme, analyses based on the values of the estimated standard deviations, item and person separation reliabilities and item and person indices were compared. Appendix A presents the fit indices for all items at the first run of Rasch analysis and Appendix B presents the list of items examined. There are five alternative scoring schemes with corresponding category meanings. The five schemes, as shown in Table 1, including the original one were constructed to test the quality of the measures. These five category scoring schemes were tested using Quest software (Adams and Khoo, 1993). However, this software did not provide item and person separation indices. As a result, each index was calculated manually using both estimates of standard deviation and adjusted standard deviation provided by Quest using the following formula SA2 i = SDi 2 − MSEi
where MSEi is the mean square calibration error (Wright and Master, 1982, p. 91). The estimates for these different indices are rounded in Table 2. The analysis showed that for the Democratic Climate of Civil Education Classrooms (DCCEC) scale, the preferable schemes are 0012, 0112, and 0011 with person separation reliability (PSR) and person separation index (PSI) (0.76, 3.42), (0.72, 3.37), and (0.70, 2.46) respectively, whereas their item
586
Developing and validating instruments for measuring democratic climate separation reliability (ISR) and item separation index (ISI) are (0.97, 5.43), (0.97, 5.00), and (0.98, 6.71) respectively.
Table 1. Alternative scoring schemes and category meaning
Table 2.
Comparison of fit indices for alternative scoring schemes of the two classroom environment scales
For the SECEC scale, the superior category schemes are the same as DCCEC scale. Their PSR and PSI are (0.83, 2.54), (0.83, 2.27), and (0.67, 2.26), whereas their ISR and ISI are (0.94, 8.90), (0.93, 9.50), and (0.96, 10.60) respectively. ISR and ISI for both scales show superior reliability to PSR and PSI for measured variable. This indicates that item order was more reliable than person order (Fox and Jones, 1998), that are direct consequences of having more persons than items being involved in the measurements made. In running the next analysis, model 0011 (never/rarely, sometimes/often) was selected for the DCCEC scale and Student Engagement in Civil Education Classrooms (SECEC) scale as well. This model showed superiority over the other models. Perhaps the idiosyncratic nature of categories affected respondent styles. Overall, the infit mean square (IMS) for this model stayed stable after deleting misfitting items both for the DCCEC and SECEC scales from 1.00 (0.13) to 1.01 (0.09) and from 0.99 (0.17) to 0.98 (0.11) respectively.
Mappiasse
587
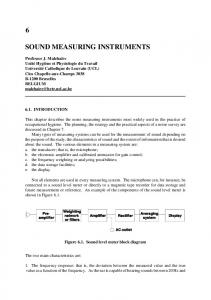
Item Ordering Examining the order of items along the continuum is one of the practices recommended to establish the validity of measures (Fox and Jones, 1998). Figure 1 shows the ordering of the Democratic Climate items and persons on the calibrated scale. The 33 items for DCCEC scale were entered in the analysis using dichotomous scoring (0011=never/rarely, sometimes/often). The threshold is the default representation of item difficulty used by Quest. For an item step, this is the ability level that is required for a person to have a 50 per cent chance of passing the step.
Figure 1. Item ordering for Democratic Climate of the Civic Education Classroom In general, the ordering of items indicates logical meaning. For instance, the extreme location of Item 10, “We do not use a text book for the Citizenship Education class, but we discuss materials from newspapers, magazines, and TV shows,” is consistent with the real situation of the way teaching is conducted in North Sulawesi. Most teachers use the text book as the primary medium of instruction. This, to some extent, precludes teachers from introducing flexibility into the classroom. Figure 1 shows that Item 10 comes together with Items 23, 20, 26, 22, 24 and 27 as the most difficult to agree with. These items involve activities that are less likely to be achieved in the class as long as the text book dominates instruction. Items 31, 9, 19, 32, 33 and 30 make up a group of items in the middle location. These items are related to the relevance of material taught and student decision-making. Items 2, 25, 4, 5 and 17 form the easiest group of items that reflect the conventional situation of school classrooms in North Sulawesi. Teachers are usually willing to
588
Developing and validating instruments for measuring democratic climate
share ideas with students in order to assess student performance. Students are discussing political or social issues related to the materials taught where sharing ideas among class members occurs. Finally students are asked to review their previous lessons at home or in the class. Figure 2 shows the ordering of items and persons of the calculated scale for Student Engagement. Regarding the ordering of items for the SECEC scale, the scale seems to be ordered in a meaningful way. Item 7, “I lead group discussion in the Citizenship Education classroom,” is found to be the most difficult item in the scale because not every student can have this opportunity in every class. Item 4, “I follow the rules in the Citizenship Education classroom” turns to be the easiest item. This reflects the effects of teacher power in the classroom in North Sulawesi, Indonesia on student behaviour.
Figure 2. Item ordering for Student Engagement in the Civic Education Classroom Students tend to obey the classroom rules and are reluctant to protest against the established rules. Figure 2 also shows that the grouping pattern of items makes sense. The item estimate produces four different groups. These groups are Group 1, Items 7 and 15; Group 2, Items 9, 14, 17, 6 and 19; Group 3, Items 18, 2, 13 and 3; and Group 4, Items 10, 8, 12, 4 and 11. This item group configuration is formed in a way that indicates the reality of student engagement style in the Civic Education classroom in North Sulawesi. For example, in Group 2, these items are about being bored, studying Civic Education materials at home when there is no test, checking Civic Education work for mistakes, asking questions in class, and reading extra books about citizenship. When those items come into the second level of item difficulty simply because students in North
Mappiasse
589
Sulawesi can be said to enjoy Civic Education class, but they do not make much effort to learn the subject.
Person and Item Fit In order to examine person and item fit, the Rasch model provides four fit statistics: infit and outfit statistics that are expressed as infit mean square or outfit mean square indices (Huang and Page, 2002; Wright and Masters, 1982). The infit mean square (IMS) index is preferred to the others, because it is found to be less sensitive to the sample size (Fox and Jones, 1998). Infit mean square values in the range of 0.78 to 1.30 are used (Bond and Fox, 2001). Values less than 0.78 generally indicate significant overfit, and values greater than 1.30 indicate significant underfit. Both underfitting and overfitting items are generally considered misfitting. In assessing items, discrimination and differential item functioning (DIF) are also taken into consideration. Item discrimination is the ability of an item to separate respondents into high and low ability. Its values correspond to the steepness of curves, and the greater steepness is preferable. Differential item functioning (DIF) analysis involves examining how different groups of respondents perform on the scale (Adams, 1992; Fayers and Machin, 2002). Three items of the 33 DCCEC scale items were underfitting and eleven items have low discrimination index (