Developing and Validating Simple Indicators of Complementary Food Intake and Nutrient Density for Breastfed Children in Developing Countries Kathryn G. Dewey, Roberta J. Cohen, Mary Arimond, Marie T. Ruel September 2006
Food and Nutrition Technical Assistance Project (FANTA) Academy for Educational Development 1825 Connecticut Ave., NW Washington, DC 20009-5721 Tel: 202-884-8000 Fax: 202-884-8432 E-mail:
[email protected] Website: www.fantaproject.org
This study/report/audio/visual/other information/media product (specify) is made possible by the generous support of the American people though the support of the Office of Health, Infectious Disease, and Nutrition, Bureau for Global Health, United States Agency for International Development (USAID), under terms of Cooperative Agreement No. HRN-A-00-98-00046-00, through the FANTA Project, operated by the Academy for Educational Development (AED). The contents are the responsibility of AED and do not necessarily reflect the views of USAID or the United States Government. Published September 2006 Recommended citation: Dewey, K. G., R. J. Cohen, M. Arimond, and M. T. Ruel. Developing and Validating Simple Indicators of Complementary Food Intake and Nutrient Density for Breastfed Children in Developing Countries. Washington, DC: the Food and Nutrition Technical Assistance (FANTA) Project, Academy for Educational Development (AED), September 2006. Copies of the publication can be obtained from: Food and Nutrition Technical Assistance Project Academy for Educational Development 1825 Connecticut Avenue, NW Washington, D.C. 20009-5721 Tel: 202-884-8000 Fax: 202-884-8432 Email:
[email protected] Website: www.fantaproject.org
CONTENTS Acknowledgments............................................................................................................................ i Acronyms........................................................................................................................................ ii Executive Summary ....................................................................................................................... iii 1. Introduction.................................................................................................................................1 2. Methods ......................................................................................................................................2 2.1 Data sets ............................................................................................................................. 2 2.1.1 Peru ............................................................................................................................ 3 2.1.2 Bangladesh................................................................................................................. 3 2.1.3 Ghana ......................................................................................................................... 3 2.1.4 Honduras .................................................................................................................... 4 2.2 Food composition data and nutrient bioavailability assumptions...................................... 4 2.3 Dietary diversity indicators................................................................................................ 5 2.4 Definition of nutrient adequacy of complementary foods (gold standard used for validation) ............................................................................................................... 6 2.5 Analytical methods ............................................................................................................ 9 2.5.1 Association between dietary diversity and nutrient density adequacy ...................... 9 2.5.2 Association between individual food group consumption and nutrient adequacy .................................................................................................................. 10 2.5.3 Association between feeding frequency and energy intake..................................... 10 3. Results........................................................................................................................................11 3.1 Characteristics of samples: Anthropometry.................................................................... 11 3.2 Characteristics of samples: Breastfeeding ...................................................................... 11 3.3 Characteristics of the sample: Complementary feeding ................................................. 12 3.3.1 Frequency of feeding ............................................................................................... 12 3.3.2 Food groups consumed and dietary diversity .......................................................... 14 3.3.3 Energy and nutrient intakes, and nutrient density adequacy of complementary foods............................................................................................... 18 3.4 Association between dietary diversity and nutrient density adequacy of complementary foods.................................................................................................. 22 3.4.1 Comparison of means .............................................................................................. 22 3.4.2 Correlation analysis ................................................................................................. 27 3.4.3 Sensitivity and specificity analysis .......................................................................... 28 3.5 “Sentinel food groups” as predictors of individual nutrient density adequacies (NDA) and mean nutrient density adequacy (MNDA)............................................... 33 3.6 Association between dietary diversity and energy intake................................................ 41 3.7 Association between frequency of feeding and energy intake......................................... 41
4. Discussion .................................................................................................................................52 4.1 Dietary patterns in the sample populations...................................................................... 52 4.2 The relationship between dietary diversity and mean nutrient density adequacy ........... 53 4.3 “Sentinel” foods groups as predictors of individual nutrient density adequacy and mean nutrient density adequacy ........................................................................... 55 4.4 The relationship between feeding frequency and energy intake...................................... 56 4.5 Strengths and limitations of these analyses ..................................................................... 57 4.6 Conclusions...................................................................................................................... 58 References......................................................................................................................................63 Annexes..........................................................................................................................................65
LIST OF TABLES 1
Types of data available in each data set .................................................................................2
2
Maximum sample sizes (child-days and subjects), by country and age category..................2
3
Food groupings used to derive the dietary diversity indexes .................................................6
4
Energy and nutrient needs from complementary foods for breastfed children with average breast milk intake......................................................................................................8
5
Desired nutrient densities for infants with average breast milk intake ..................................8
6
Percent of child-days when children were stunted or wasted, by country and by age group .........................................................................................................................12
7
Frequency of breastfeeding and breast milk intake, by country and by age group..............13
8
Frequency of meals and snacks, by country and by age group ............................................14
9
Percent of child-days various food groups were consumed, by country and by age group (1-gram minimum).....................................................................................................14
10
Percent of child-days various food groups were consumed, by country and by age group (10-gram minimum)...................................................................................................15
11
Percent of child-days at each food group diversity score, by country (FGI-8: 1-gram minimum) ...................................................................................................17
12
Percent of child-days at each food group diversity score, by country (FGI-8R; 10-gram minimum)...............................................................................................17
13
Peru: Percentage of child-days on which different food groups were consumed, by FGI-8 score (infants 6-11.9 months) ....................................................................................17
14
Median percent desired energy and nutrient intake from complementary foods, by country and by age group ................................................................................................19
15
Median percent desired nutrient density of complementary foods, by country and by age group .........................................................................................................................19
16
Peru: Percent contribution of food groups to intake (from complementary foods) of energy and selected “problem” nutrients (children 6-11.9 months).....................................21
17
Honduras: Percent contribution of food groups to intake (from complementary foods) of energy and selected “problem” nutrients (infants 6-8.9 months) .........................21
18
Ghana: Percent contribution of food groups to intake (from complementary foods) of energy and selected “problem” nutrients (infants 6-11.9 months) ..................................21
19
Bangladesh: Percent contribution of food groups to intake (from complementary foods) of energy and selected “problem” nutrients (children aged 6-11.9 months).............22
20
Relationship between mean nutrient density adequacy (MNDA) and dietary diversity (FGI-8), by country and by age group...................................................................27
21
Relationship between mean nutrient density adequacy (MNDA) and dietary diversity (FGI-8R), by country and by age group ................................................................27
22
Sensitivity/specificity analysis to predict low mean nutrient density adequacy (MNDA < 50%) using selected cutoff points of dietary diversity (FGI-8: 1-gram minimum) ...................................................................................................30
23
Sensitivity/specificity analysis to predict low mean nutrient density adequacy (MNDA < 50%) using selected cutoff points of dietary diversity (FGI-8R: 10-gram minimum)...............................................................................................30
24
Sensitivity and specificity analysis of dietary diversity (FGI-8: 1-gram minimum) to predict better mean nutrient density adequacy (MNDA ≥ 75%) .....................................34
25
Sensitivity and specificity analysis of dietary diversity (FGI-8R: 10-gram minimum) to predict better mean nutrient density adequacy (MNDA ≥ 75%)..........................................34
26
Food groups predictive of nutrient density adequacy, by country .......................................35
27
Sensitivity/specificity analysis to predict low mean nutrient density adequacy (MNDA < 50%), using individual food groups (1-gram minimum)....................................37
28
Sensitivity/specificity analysis to predict low mean nutrient density adequacy (MNDA < 50%), using individual food groups (10-gram minimum)..................................38
29
Sensitivity/specificity analysis of individual food groups (1-gram minimum) to predict better mean nutrient density adequacy (MNDA ≥ 75%)..........................................39
30
Sensitivity/specificity analysis of individual food groups (10-gram minimum) to predict better mean nutrient density adequacy (MNDA ≥ 75%)..........................................40
31
Relationships between energy intake and feeding frequency, by country and by age group .........................................................................................................................44
32
Sensitivity/specificity analysis of frequency of feeding to predict low energy intake from complementary foods........................................................................................48
33
Sensitivity/specificity analysis of feeding frequency to predict with low total energy intake ........................................................................................................................51
LIST OF FIGURES 1
Mean height-for-age Z-score (HAZ), by country and by age group ....................................11
2
Mean food group diversity, by country and by age group (FGI-8: range 0-8, 1gram minimum)....................................................................................................................16
3
Mean food group diversity, by country and by age group (FGI-8R: range 0-8, 10-gram minimum) .............................................................................16
4
Mean Nutrient Density Adequacy (MNDA), by country and by age group ........................20
5
Peru: Mean Nutrient Density Adequacy score (MNDA), by dietary diversity index and child age: for FGI-8 (1-gram minimum) ............................................................23
6
Peru: Mean Nutrient Density Adequacy score (MNDA), by dietary diversity index and child age: for FGI-8R (10-gram minimum)........................................................23
7
Honduras: Mean Nutrient Density Adequacy (MNDA), by dietary diversity index and child age: for FGI-8 (1-gram minimum) ......................................................................24
8
Honduras: Mean Nutrient Density Adequacy (MNDA) by dietary diversity index and child age: for FGI-8R (10-gram minimum) ..................................................................24
9
Ghana: Mean Nutrient Density Adequacy (MNDA), by dietary diversity index and child age: for FGI-8 (1-gram minimum) .............................................................................25
10
Ghana: Mean Nutrient Density Adequacy (MNDA) score, by dietary diversity index and child age: for FGI-8R (10-gram minimum)........................................................25
11
Bangladesh: Mean Nutrient Density Adequacy (MNDA), by dietary diversity index and child age: for FGI-8 (1-gram minimum) ............................................................26
12
Bangladesh: Mean Nutrient Density Adequacy (MNDA), by dietary diversity index and child age: for FGI-8R (10-gram minimum)........................................................26
13
Peru: Sensitivity/specificity analysis to predict low mean nutrient density adequacy (MNDA < 50) using selected cutoff points of dietary diversity (FGI-8).............31
14
Honduras: Sensitivity/specificity analysis to predict low mean nutrient density adequacy (MNDA < 50%) using selected cutoff points of dietary diversity (FGI-8) .........31
15
Ghana: Sensitivity/specificity analysis to predict low mean nutrient density adequacy (MNDA < 50%) using selected cutoff points of dietary diversity (FGI-8) .........32
16
Bangladesh: Sensitivity/specificity analysis to predict low mean nutrient density adequacy (MNDA < 50%) using selected cutoff points of dietary diversity (FGI-8) .........32
17
Honduras: Mean complementary food energy intake, by number of meals and number of feeding episodes...........................................................................................42
18
Peru: Mean complementary food energy intake, by number of feeding episodes ..............42
19
Peru: Total energy intake, by number of feeding episodes .................................................43
20
Peru: Sensitivity and specificity of different cutoff points of number of feeding episodes for predicting low energy intake from complementary foods (infants 6-8.9 months) .........45
21
Peru: Sensitivity and specificity of different cutoff points of number of feeding episodes for predicting low energy intake from complementary foods (infants 9-11.9 months) .......45
22
Honduras: Sensitivity and specificity of different cutoff points of number of feeding episodes for predicting low energy intake from complementary foods (infants 6-8.9 months) ..........................................................................................................46
23
Bangladesh: Sensitivity and specificity of different cutoff points of number of meals (> 10 g of food) for predicting low energy intake from complementary foods (infants 6-8.9 months) ..........................................................................................................46
24
Bangladesh: Sensitivity and specificity of different cutoff points of number of meals (> 10 g of food) for predicting low energy intake from complementary foods (infants 9-11.9 months) ........................................................................................................47
25
Peru: Sensitivity and specificity of number of feeding episodes for predicting low total energy intake (infants 6-8.9 months) ...........................................................................49
26
Peru: Sensitivity and specificity of number of feeding episodes for predicting low total energy intake (infants 9-11.9 months) .........................................................................49
27
Bangladesh: Sensitivity and specificity of number of meals (> 10 g food) when predicting low total energy intake (infants 6-8.9 months) ...................................................50
28
Bangladesh: Sensitivity and specificity of number of meals (> 10 g food) for predicting low total energy intake (infants 9-11.9 months) .................................................50
LIST OF BOXES 1
Example of nutrient density adequacy calculation for folate .................................................9
2
Sensitivity/specificity analysis and considerations in selecting best indicators and cutoff points .........................................................................................................................29 LIST OF ANNEXES
1
Preliminary analyses with varying assumptions regarding breast milk intake ....................60
2
Peru: Summary of food group intake for all child-days and for days food group was consumed (children 6-11.9 months)..............................................................................65
3
Honduras: Summary of food group intake for all child-days and for days food group consumed only (infants 6-8.9 months).......................................................................66
4
Ghana: Summary of food group intake for all child-days and for days food group was consumed (infants 6-11.9 months)................................................................................67
5
Bangladesh: Summary of food group intake for all childrena and for consumers only (children 6-11.9 months)..............................................................................................68
6
Peru: Food group consumption, by food group diversity score (FGI-8, 1-gram minimum) (infants 6-11.9 months) ......................................................................................69
7
Honduras: Food group consumption, by food group diversity score (FGI-8; 1-gram minimum) (infants 6-8.9 months)............................................................................70
8
Ghana: Food group consumption, by food group diversity score (FGI-8; 1-gram minimum) (infants 6-11.9 months)..........................................................................71
9
Bangladesh: Food group consumption, by food group diversity score (FGI-8, 1-gram minimum) (infants 6-11.9 months)..........................................................................72
10
Energy and nutrient intake by country and by age, compared to desired amount from complementary food ....................................................................................................73
11
Analysis of the association between dietary diversity and energy intake ............................74
Developing & Validating Simple Indicators of Complementary Food Intake & Nutrient Density for Breastfed Children in Developing Countries
ACKNOWLEDGMENTS We gratefully acknowledge the other investigators involved in the infant dietary intake studies upon which these analyses were based: Peru: H. Creed de Kanashiro, K. H. Brown, G. Lopez de Romana, T. Lopez, and R. E. Black; Honduras: L. Landa Rivera; Ghana: A. Lartey, A. Manu, J. Peerson, and K. H. Brown; and Bangladesh: J. E. Kimmons, E. Haque, J. Chakraborty, S. J. M. Osendarp, and K. H. Brown.
i
Developing & Validating Simple Indicators of Complementary Food Intake & Nutrient Density for Breastfed Children in Developing Countries
ACRONYMS CF
Complementary foods
FAO
Food and Agriculture Organization
FGI-8
Food group index (8 food groups; no minimum amount criterion)
FGI-8R
Food group index-restricted (8 food groups; 10-gram minimum amount criterion)
HAZ
Height-for-age Z-scores
IOM
Institute of Medicine
MNDA
Mean nutrient density adequacy
NDA
Nutrient density adequacy
PAHO
Pan American Health Organization
RE
Retinol equivalents
RNI
Recommended nutrient intakes
Se
Sensitivity
Spe
Specificity
USAID
United States Agency for International Development
USDA
United States Department of Agriculture
V+
Positive predictive value
WHO
World Health Organization
WHZ
Weight-for-height Z-scores
ii
Developing & Validating Simple Indicators of Complementary Food Intake & Nutrient Density for Breastfed Children in Developing Countries
EXECUTIVE SUMMARY Introduction The overall goal of the research was to initiate a process of developing and validating indicators of diet “quality” and “quantity” from complementary foods during the first two years of life. In this first study, we used four data sets available at the University of California at Davis to validate indicators related to two aspects of complementary feeding: the nutrient density of complementary foods and the complementary food intake of breastfed infants 6-12 months of age. More specifically, the two main research questions addressed were the following: 1. How well can dietary diversity (sum of foods or food groups consumed over a reference period) or sentinel food group (selected nutrient-dense food groups) indicators predict the dietary quality1 of complementary foods for breastfed infants in different populations with varying dietary patterns? 2. How well does the frequency of feeding of complementary foods predict energy intake – either from complementary foods or total energy intake – in different populations with varying dietary patterns? Methods Four data sets with information on dietary intake of breastfed children between the ages of 6-12 months were used for these analyses (from Peru, Bangladesh, Ghana, and Honduras). In total, 1866 child-days of dietary records were included. For each record, nutrient intake from complementary foods was calculated using the best available data on food composition. When converting food intake data into nutrient intake data, the estimated bioavailability of zinc, calcium, and iron from different foods was used to estimate the amount of each nutrient absorbed. Two dietary diversity indexes were used in the analyses: 1) The Food Group Index-8 (FGI-8): this index was based on consumption of foods from each of eight different food groups, with each group counted in the index if at least 1 gram was eaten: a) Grains, roots and tubers; b) Legumes and nuts; c) Dairy products; d) Flesh foods; e) Eggs; f) Vitamin A-rich fruits and vegetables; g) Other fruits and vegetables; h) Fats and oils. 1
Dietary quality is defined in this report as “adequate nutrient density of complementary foods for 9 nutrients.”
iii
Developing & Validating Simple Indicators of Complementary Food Intake & Nutrient Density for Breastfed Children in Developing Countries
2) The Food Group Index-8 Restricted (FGI-8R): this index was similar to the first index (FGI-8), except that the child must have eaten at least 10 g from the food group (except fats and oils) for it to be counted as a point (range 0-8). For the “fats and oils” food group, the cutoff at least 1 g was used. Dietary quality was defined based on how well the complementary food diet met nutrient density recommendations. Nutrient adequacy was based on nutrient density (amount per 100 kcal of complementary food), rather than absolute nutrient intake, because of the variability in breastmilk intake among individual children. The desired nutrient densities were calculated by dividing the required amount of each nutrient from complementary food by the appropriate complementary food energy requirement (for each age group) and multiplying by 100. The percentage of the desired nutrient density fulfilled by the complementary foods consumed that day, termed the “nutrient density adequacy” (NDA) score, was calculated for each of nine “problem” nutrients (vitamins A, B6, and C, riboflavin, thiamin, folate, iron, zinc, and calcium). The overall “mean nutrient density adequacy” (MNDA) was calculated as the average of the nine individual NDA scores for that day, after each was capped at 100%. For all analyses, the unit of analysis was one child-day, corresponding to one 24-hour record of food intake. Bivariate analyses (comparison of means and correlation coefficients) were carried out to test the association between dietary diversity indicators and MNDA for all four data sets. Sensitivity and specificity analysis was also used to compare the performance of the different dietary diversity indicators in differentiating cases with low and higher MNDA, and to identify best cutoff points. Two sets of analyses were completed, one using FGI-8 and the other using FGI-8R as the measure of dietary diversity. For each set of analyses, two cutoff points of MNDA were used, MNDA < 50% and ≥ 75%. For the analysis of feeding frequency, three of the four datasets had sufficient information (all but Ghana). Two of these (Peru and Bangladesh) also had data on breast milk intake, which permitted calculation of total energy intake. Correlation analysis was used to test associations between total energy intake (Peru and Bangladesh) or energy from complementary foods (Peru, Bangladesh, and Honduras) and number of feeding episodes (feeding episodes (meals + snacks), or meals only, if feeding episodes were subdivided). Sensitivity and specificity analysis was also used to assess the performance of the feeding frequency indicators in differentiating children with total energy intake (or energy from complementary foods) above or below their age-specific requirements, and to identify best cutoff points. Results Dietary patterns in the sample populations The diets of infants in the four studies (Peru, Honduras, Ghana, and Bangladesh) reflect a wide range of food intake patterns. The most commonly consumed foods were those categorized into the “grain products, roots and tubers” group, with at least one of these foods being recorded on 92-100% of child-days and consumption of at least 10 g from this food group on 78-99% of child-days.
iv
Developing & Validating Simple Indicators of Complementary Food Intake & Nutrient Density for Breastfed Children in Developing Countries
There was great variability across sites in the consumption of the other food groups. Legumes and nuts were consumed commonly in Ghana (67-70%), occasionally in Bangladesh (18-30%), and rarely in Peru (4-5%) and Honduras (14%). By contrast, dairy products were infrequently consumed in Ghana (12-18%) and Bangladesh (10-21%), but commonly consumed in Peru (4048%) and Honduras (53%). Flesh foods were consumed on 28-58% of child-days in Peru, Honduras, and Ghana, though these percentages dropped to 12-24% when imposing the 10-gram minimum. In Bangladesh, flesh foods were rarely consumed, and none of the infants consumed ≥ 10 g on a given day. Eggs were consumed on 42% of child-days in Honduras, but much less frequently in Peru (11-16%), Ghana (1-3%), and Bangladesh (1-4%). Vitamin A-rich fruits and vegetables were commonly consumed in Peru (60-66%), but infrequently consumed in Honduras (16%), Ghana (5-13%), and Bangladesh (4-12%). Other fruits and vegetables were consumed on half or more of child-days in Peru (49-69%) and Honduras (69%), but on less than half of childdays in Ghana (15-48%) and Bangladesh (27-31%). Fats and oils were consumed occasionally in Peru (13-30%), Honduras (19%) and Ghana (10-44%), but rarely in Bangladesh (4-6%). Mean dietary diversity (using the eight-food group index with no quantity restriction (FGI-8)) was higher in Peru (3.0-3.7) and Honduras (3.3) than in Ghana (2.6-3.4) and Bangladesh (1.72.1). When considering only food groups from which at least 10 g were consumed (using the same index with a 10-gram minimum restriction for each food group except fats and oils (FGI8R)), the mean diversity scores were lower: approximately 2-3 in Peru, Honduras and Ghana and < 2 in Bangladesh. Thus, the diets of most of the children included foods from less than three of the eight food groups on any given day. Nutrient density of the complementary food diet was generally inadequate. The median percentage of desired nutrient density was particularly low for absorbed iron: 5-9% in Bangladesh, 6-10% in Peru, 8% in Honduras, and 13-36% in Ghana. Of the other nutrients, the median percentage of desired nutrient density was low (generally < 60%) in all sites for absorbed zinc and in several sites for absorbed calcium, vitamin A, riboflavin, vitamin B6 and vitamin C. Median nutrient density of folate and thiamin was generally > 60% of desired. As a consequence of the generally low nutrient densities, the mean nutrient density adequacy (MNDA) of the complementary food diet (average of percent desired nutrient density, capped at 100%, for the nine nutrients) was low in all four sites, with means ranging from 35-49% in Bangladesh to 56-63% in Peru, depending on age. MNDA increased with age in the three sites that had more than one age group (i.e., 6-8.9 months and 9-11.9 months). Mean feeding frequency was 3.0-3.6 per day at 6-8.9 months, with 7-24% receiving fewer than the minimum of two feedings per day stipulated for this age range in the Guiding Principles recommendations (PAHO/WHO 2003). At 9-11.9 months, mean feeding frequency was 3.9-4.8 per day, with 18-27% receiving fewer than the minimum of three feedings per day recommended for this age range. Feeding frequency was lower in Bangladesh than in Honduras and Peru for both age groups. Overall, the large majority of the infants in our three samples met the minimum feeding frequency guidelines.
v
Developing & Validating Simple Indicators of Complementary Food Intake & Nutrient Density for Breastfed Children in Developing Countries
The relationship between dietary diversity and mean nutrient density adequacy Mean nutrient density adequacy (MNDA) was used in this study as our indicator of diet quality. Dietary diversity was positively associated with MNDA in all four countries, with MNDA generally 50-60% when only two food groups were consumed, increasing to ~60-70% when at least four food groups were consumed (regardless of the quantity consumed). If a 10-gram minimum quantity was imposed, MNDA generally rose to ~70-80% when at least four food groups were consumed. Thus, a larger number of food groups in the child’s diet is associated with greater dietary quality. The correlations between dietary diversity and MNDA were significant in all sites and age groups, ranging from ~0.4 to ~0.7. Imposing a 10-gram minimum in counting the number of foods groups did not generally improve the correlation. In sensitivity/specificity analyses, imposing the 10-gram minimum did not generally result in reduced misclassification. Because a simple indicator is easier to implement in the field, it is preferable to choose one that does not require collecting information on quantities consumed, unless there is a clear advantage to doing so. Thus, we focus the discussion below on the results using the dietary diversity indicator with the 1-gram minimum amount. Sensitivity/specificity analyses were performed in order to explore the ability of the food group diversity indicator to accurately identify children with low vs. higher MNDA. Findings from our four data sets suggest that to identify children with low nutrient density diet (MNDA < 50%), a cutoff point of ≤ 2 food groups results in the lowest percentage of misclassified children and an acceptable balance of sensitivity and specificity in all four data sets. With this cutoff (using FGI8), sensitivity was 61-88%, specificity was 43-85%, and the percentage misclassified was 2229%, depending on the country. The most consistent cutoff point of dietary diversity to identify children with a better nutrient density diet (MNDA ≥ 75%) was ≥ 4 food groups. In this situation (again using FGI-8), sensitivity was 50-81%, specificity was 61-96%, and the percentage misclassified was 7-36%. While the values for sensitivity and specificity are not as high as one might like in some of the countries, the results indicate that the dietary diversity indicator holds promise at least at the population level, if not at the individual level. Results from analyses using additional data sets from other countries are needed before making conclusive statements about the best indicators of dietary quality. “Sentinel” foods groups as predictors of mean nutrient density adequacy In the sensitivity/specificity analyses using individual food groups as predictors of MNDA, the combined food group for animal source foods and the group for other fruits and vegetables were predictive of MNDA in all four countries. Dairy products were predictive of MNDA in three of the four countries. When compared with the results for dietary diversity (using a cutoff of ≤ 2 food groups for FGI-8 and the 50% MNDA cutoff), the ASF food group yielded similar or better results in three of the four sites (the exception being Peru, in which the dietary diversity indicator gave slightly better results). Sensitivity was 49-93%, specificity was 50-87% and the percentage misclassified was 20-26%, depending on the country.
vi
Developing & Validating Simple Indicators of Complementary Food Intake & Nutrient Density for Breastfed Children in Developing Countries
The relationship between feeding frequency and energy intake Feeding frequency was strongly correlated with energy intake from complementary foods, with correlation coefficients ranging from ~0.5 in Honduras and Bangladesh to 0.66-0.78 in Peru. In the two sites in which meal frequency was also recorded, the correlation with energy intake from complementary foods was higher for meal frequency than for feeding frequency in Bangladesh, but the opposite was true in Honduras. This suggests that there is no consistent advantage in distinguishing meals from snacks, in terms of predicting energy intake from complementary foods. In the two sites in which total energy intake (including energy from breast milk) was measured (Peru and Bangladesh), the correlations with feeding frequency were lower for total energy intake than for energy intake from complementary foods. This is not surprising, given that there is usually a trade-off between energy intake from breast milk and energy intake from complementary foods. Thus, when evaluating indicators that are predictive of the adequacy of energy intake, it is preferable to use total energy intake as the yardstick, rather than energy intake from complementary foods. Otherwise, the risk of misclassification is high (e.g., concluding that a child with a low feeding frequency had low energy intake, when energy intake was actually adequate because of a relatively high breast milk intake). This is particularly true when the average breast milk intake in a given population deviates from the global average breast milk intake upon which the feeding frequency recommendations are based, which was certainly the case for Bangladesh. However, there may be circumstances when an indicator of energy intake from complementary foods may be of use. We performed sensitivity/specificity analyses using both total energy intake and energy intake from complementary foods as the outcome. With the latter option, a cutoff of ≤ 3 feedings at 68.9 months yielded the best results when predicting low energy intake from complementary foods, with sensitivity of 79-87%, specificity of 55-80% and 15-28% of cases misclassified. At 9-11.9 months, a cutoff of ≤ 4 feedings yielded the best results, with sensitivity of 75-81%, specificity of 75% and 18-25% misclassified. With the former option (total energy intake as outcome), the results were not as good (as expected, given the lower correlations between feeding frequency and total energy intake than between feeding frequency and energy intake from complementary foods). The cutoffs that yielded the lowest percentage misclassified were the same as those identified when energy intake from complementary foods was the outcome, and sensitivity was comparable, but specificity was lower (35-59%) and the percentage misclassified was higher (25-35%). In other words, when using total energy intake as the outcome, there was an excess of “false positives,” or children identified by the indicator as having low energy intake who, in fact, had adequate energy intake. Whether this is acceptable depends on the purposes and uses of the indicators.
vii
Developing & Validating Simple Indicators of Complementary Food Intake & Nutrient Density for Breastfed Children in Developing Countries
Conclusions With regard to the two main objectives of these analyses, we conclude the following: 1. Dietary diversity as an indicator of diet quality: a) Diet diversity was associated with diet quality in all samples, for all age groups: mean MNDA increased with increasing dietary diversity, although the relationship was not always linear. All correlation coefficients between dietary diversity and MNDA were statistically significant, and they ranged from 0.37 to 0.74, depending on the age group and country. b) The dietary diversity indicator that included a 10-g minimum restriction did not result in lower percentages of misclassified children or higher sensitivities or specificities than the simpler indicator based on a 1-g limit (for practical purposes, equivalent to “any or none” for consumption), and therefore the simpler one is recommended. c) Best cutoff points varied depending on the diversity indicator and the cutoff point for MNDA used. Additional analyses in other age groups and contexts are required to confirm whether universal cutoff points can be recommended. d) An indicator based on consumption of animal source foods (yes/no) performed as well as or better than the dietary diversity indicator as a predictor of adequacy of nutrient density of complementary foods (when using the MNDA cutoff point of 2,500 g were recruited between July 1982 and June 1984. Intake of breast milk, other liquids, and complementary foods was measured multiple times during the first year of life. Breast milk intake was estimated by daytime 12-hour test-weighing and milk macronutrient concentrations were analyzed. The amounts of other foods and liquids consumed during the same 12-hour period were weighed by an observer in the home. The amounts of foods consumed at nighttime were obtained by maternal recall. Enumerators observed and noted each feeding episode, and snacks were not distinguished from meals. For each child, 3-4 days of records were available for each age interval in these analyses. Nearly all of the children were breastfed at 6 months, but some discontinued breastfeeding at some point during the study. The intake records (child-days) that did not include breast milk were excluded from these analyses (12.5% of all child-days). 2.1.2 Bangladesh Dietary intake data were obtained in 1999 for infants who were between 6 and 12 months of age in nine rural villages in Matlab Thana, located 55 kilometers southeast of Dhaka (Kimmons et al. 2004). The Matlab Health and Demographic Surveillance System supplied information on the number of infants per village and which households included infants of the appropriate age. In these villages, most infants in the 6-to-12-month age range participated in the study, unless their parents refused (n = 2) or the infant was ill and the observations could not be rescheduled (n = 2). All infants were breastfed. Each child’s intake of breast milk and complementary foods was weighed on a single day by an observer in the home during a 12-hour period, and nighttime intake was estimated by maternal recall. Meals were defined as any feeding episode during which at least 10 g of food was consumed, and snacks were defined as < 10 g of food. 2.1.3 Ghana The data for Ghana come from a randomized intervention study conducted in 1994-1996 to evaluate the effects of four different “improved” complementary food blends: (1) a maize/soybean/peanut blend [Weanimix], (2) Weanimix plus fish powder, (3) traditional fermented maize porridge [koko] plus fish powder, and (4) Weanimix fortified with vitamins and minerals (Lartey et al. 1999). The fourth group was excluded from the analyses herein. Infants were recruited at ≤ 1 month of age from Maternal and Child Health centers run by the Techiman Ministry of Health. Selection criteria were as follows: birth weight ≥ 2500 g, breastfed, no congenital abnormalities, assigned a Maternal and Child Health card, and the child’s mother was not planning to travel or move out of the study area (the town of Techiman and its surroundings) during the study period. The intervention period was from 6 to 12 months of age. Note that the infants in the intervention study had better growth status at 12 months than those in a crosssectional comparison group (e.g., mean length-for-age Z-score was -0.63 vs. –1.27, respectively), presumably because of the provision of the improved complementary foods. The dietary data for these analyses are based on 12-hour weighed intakes of a randomly selected subsample of 50% of infants in the intervention study at each time point (at 6, 7, 8, 10, and 12 months). A trained
3
Developing & Validating Simple Indicators of Complementary Food Intake & Nutrient Density for Breastfed Children in Developing Countries
observer weighed all the foods and beverages consumed by the infant during the daytime 12-hour period, and no infant consumed anything other than breast milk during the nighttime. All infants were breastfed at 6 months and all but two were breastfed at 12 months. Intake records for child-days when breast milk was not consumed were excluded from analysis. The data set does not include information on the number of meals, snacks, or feeding episodes. 2.1.4 Honduras The dietary data for Honduras come from a randomized clinical trial designed to study the effects of iron supplementation on iron status during infancy (Domellof et al. 2001). Motherinfant pairs were recruited at birth from the public maternity hospital in the city of San Pedro Sula. The study took place in 1997. Selection criteria for entry into the iron intervention trial, which began at 4 months, were as follows: (1) gestational age > 37 weeks, (2) birth weight > 2,500 g, (3) no chronic illness, (4) maternal age > 16 years, (5) infant exclusively breastfed at 4 months (and did not receive more than 90 mL/d of formula during any period since birth), (6) mother intended to exclusively or nearly exclusively breastfeed until 6 months (i.e., ≤ 1 tablespoon/d of foods or fluids other than breast milk, and no iron-fortified foods), and (7) mother intended to continue breastfeeding to at least 9 months. All infants in the intervention trial were breastfed throughout the study. Complementary food intake between 6 and 9 months of age was estimated by a bi-weekly 24-hour recall. If the infant was ill on the previous day, the mother was asked to recall intake on the day before that, or on a “typical” day. Meals and snacks were self-defined by mothers. 2.2 Food composition data and nutrient bioavailability assumptions For Peru, a country-specific food composition database was used that included phytate values. Values for vitamin B6 and folate were added to the original Peruvian food composition database using values from the WorldFood Dietary Assessment System4 or the Food Processor for Windows5 food composition database (which is based on United States Department of Agriculture [USDA] data). For Bangladesh, Ghana, and Honduras, Food Processor values were generally used. For Ghana, some foods were not listed in the Food Processor database, in which case values from the USDA online database,5 WorldFood Dietary Assessment System, or a Ghanaian food composition database were used. When converting food intake data into nutrient intake data, the estimated bioavailability of zinc, calcium, and iron from different foods was used to estimate the amount of each nutrient absorbed. Phytate values are used to estimate zinc bioavailability based on the phytate to zinc (P/Z) ratio (Hotz and Brown 2004). Phytate values were available for Peru but not for the other data sets because phytate is not included in the Food Processor database. For the other sites, phytate values were obtained from the researchers or from the World Food Programme, and the 4
The WorldFood Dietary Assessment System, version 2, is available at: http://www.fao.org/infoods/software_worldfood_en.stm.
5
ESHA Research (1997) The Food Processor for Windows. Version 7.01. The database incorporated into the Food Processor software is the USDA Nutrient Database for Standard Reference, Release 14, is available at: http://www.nal.usda.gov/fnic/foodcomp/Data/SR14/sr14.html
4
Developing & Validating Simple Indicators of Complementary Food Intake & Nutrient Density for Breastfed Children in Developing Countries
P/Z ratio was calculated. Zinc absorption was estimated as 30% for P/Z < 18 and 22% for P/Z > 18 (Hotz and Brown 2004). Absorption of calcium was assumed to be 25% for legumes, roots/tubers, and grains, 5% for foods with high oxalate content (e.g., spinach), 45% for other fruits and vegetables, and 32% for all other foods (including dairy products) (Weaver, Proulx, and Heaney 1999). Absorption of iron was assumed to be 6% from plant source foods and 11% from animal source foods (including milk, which has lower iron bioavailability than meats). These are rough estimates based on reported values for absorption of iron from complementary foods (Hurrell 2003; Lynch and Stoltzfus 2003). The food composition databases use a ratio of 6:1 for the conversion of beta-carotene to retinol equivalents (RE), but recent data indicate that a ratio of 12:1 is more appropriate, and this ratio was used in calculating the new Dietary Reference Intakes (IOM 2000). We adjusted for this by dividing all the plant-based food vitamin A values by 2. The exception was red palm oil, which has a conversion ratio of 2:1.6 Thus, for red palm oil we multiplied the vitamin A value in the food composition database by 3. 2.3 Dietary diversity indicators After examining several different options for grouping foods and calculating a dietary diversity index, the food groups shown in Table 3 were selected. Foods such as sweets, spices, etc., that do not provide nutrients other than energy were not included in the food groups (although they were included when calculating energy intake). The following diet diversity indexes were used in the analyses: 1) The Food Group Index-8 (FGI-8): this index was based on consumption of food from each of the eight food groups listed in Table 3, with each food group coded “yes” if at least 1 g was consumed (range 0-8); 2) The Food Group Index-8 Restricted (FGI-8R): this index was similar to the first index (FGI8), except that it used a restriction of 10 g from the food group (except fats and oils) to be considered as having been consumed by the child (range 0-8). The cutoff of 10 g is based on inspection of the individual dietary records. For the “fats and oils” food group, the cutoff of ≥ 1 g was used.
6
See conversion factors suggested by the International Vitamin A Consultative Group (http://ivacg.ilsi.org/file/webBookmark.pdf; accessed March 21, 2005).
5
Developing & Validating Simple Indicators of Complementary Food Intake & Nutrient Density for Breastfed Children in Developing Countries
Table 3. Food groupings used to derive the dietary diversity indexesa Major food groups 1. Grains, roots and tubers
2. Legumes and nuts 3. Dairy products
4. Flesh foods
Foods Grains a) grain products (porridge, bread, tortilla, pasta, etc.) b) cookies, cake, etc. Roots and tubers (except sweet potatoes) a) vitamin C rich b) others a) beans and peas b) soybeans and soy products c) nuts and seeds (include peanuts) a) milk b) cheese c) other - yogurt, puddings, ice cream d) cream, sour cream a) meat b) fish c) poultry d) liver and other organ meat
5. Eggs 6. Vitamin A-rich fruits and vegetables (> 130 RE of vitamin A per 100 g) 7. Other fruits and vegetables
8. Fats and oils a
a) dark green leafy vegetables b) other vitamin A rich vegetables and juices (including sweet potatoes) c) vitamin A rich fruits and juices a) vitamin C rich vegetables and juices (> 18 mg vitamin C per100 g) b) other vegetables (not rich in either vitamin A or vitamin C) c) vitamin C rich fruits and juices d) other fruits (not rich in either vitamin A or vitamin C) e) starchy fruits (bananas, plantains) f) other juices (not rich in either vitamin A or vitamin C) a) general (oil, butter, margarine, lard, “crisco,” mayonnaise) b) red palm oil
The following foods and condiments are not included in the above groups: sodas and other sweet beverages, candy, honey, chocolate, and condiments or spices that provide little other than energy.
2.4 Definition of nutrient adequacy of complementary foods (gold standard used for validation) The nutrient adequacy of complementary foods was defined based on how well the complementary food diet met nutrient density recommendations. Nutrient adequacy was based on nutrient density (amount per 100 kcal of complementary food), rather than absolute nutrient intake, because of the variability in breast milk intake among individual children. Without measuring breast milk intake (which would not be practical in large-scale surveys), it would be difficult to judge whether the absolute amounts of nutrients from complementary foods consumed were sufficient. Nutrient density recommendations vary not only by age group (6-8.9, 9-11.9, and 12-23.9 months), but also by level of breast milk intake (WHO) 1998), because the amount of each nutrient needed depends on how much is provided by breast milk. Following a set of preliminary analyses, described in Annex 1, we used the 50th percentile value (from WHO 1998), or “average” breast milk intake to calculate the amount required from complementary foods for 6
Developing & Validating Simple Indicators of Complementary Food Intake & Nutrient Density for Breastfed Children in Developing Countries
each of nine “problem” nutrients identified in Dewey and Brown (2003), for each of the two age groups. The nine problem nutrients are: vitamins A, B6, and C, riboflavin, thiamin, folate, iron, zinc, and calcium. The estimated amount of each of these nutrients contributed by breast milk (based on breast milk concentrations published in WHO 1998) was subtracted from the Recommended Nutrient Intake (RNI) for each nutrient. RNI values from FAO/WHO were used for all of the vitamins (Joint FAO/WHO Expert Consultation 2002). For the minerals, the recommended amount absorbed was the basis for the calculation. For calcium, the total recommended amount absorbed was estimated as 30% of the Dietary Reference Intake (IOM 1997): 81 mg/d at 6-11.9 months (.3 x 270 mg/d) and 150 mg/d at 12-23.9 months (.3 x 500 mg/d). The percentage of calcium absorbed from breast milk was estimated as 30%. For iron, the total recommended amount absorbed was estimated as 10% of the FAO/WHO (2002) RNI: 0.93 mg/d at 6-11.9 months (.1 x 9.3 mg/d) and 0.58 mg/d at 12-23.9 months (.1 x 5.8 mg/d). The percentage of iron absorbed from breast milk was estimated as 20% (Domellof et al. 2001). For zinc, the total recommended amount absorbed was based on the Dietary Reference Intake calculations (IOM 2000): 0.836 mg/d + 20% = 1 mg/d. The percentage of zinc absorbed from breast milk was estimated as 50% (IOM 2000). The desired nutrient densities were then calculated by dividing the required amount of the nutrient from complementary food by the complementary food energy requirement for infants with average breast milk intake, and multiplying by 100. For example, for a 6-8.9 month infant with average breast milk intake, the calculation of the desired nutrient density for vitamin A would be: [Vit A RNI - (Vit A concentration in breast milk × “average” breast milk intake volume)/ Energy needed from complementary foods when breast milk intake is “average”] × 100; or [400 ug RE - (500 ug RE/L × .674 L)/202 kcal] × 100 = 31.2 ug RE per100 kcal.
Table 4 shows the nutrient needs from complementary foods, and Table 5 shows the desired nutrient densities used for these calculations. On the level of the child-day, the desired nutrient density for each nutrient was used to determine the percentage of the desired nutrient density fulfilled by the complementary foods consumed that day (termed the “nutrient density adequacy” (NDA) score). See Box 1 for an example of calculation of nutrient density adequacy for folate for one child-day of observation. After calculating the individual nutrient density adequacy for each of the nine “problem” nutrients, the overall “mean nutrient density adequacy” (MNDA) was calculated as the average of the nine individual NDA scores for that day, after each was capped at 100%.
7
Developing & Validating Simple Indicators of Complementary Food Intake & Nutrient Density for Breastfed Children in Developing Countries
Table 4. Energy and nutrient needs from complementary foods for breastfed children with average breast milk intakea Energy and nutrients per day Total energy (kcal) Average breast milk intake (L) Average breast milk energy (kcal) Nutrient needs from complementary foods Energy (kcal) Vitamin A (RE) Thiamin (mg) Riboflavin (mg) Vitamin B6 (mg) Folate (ug) Vitamin C (mg) Calcium (mg) Absorbed calcium (mg) Iron (mg) Absorbed iron (mg) Zinc (mg) Absorbed zinc (mg) a
Age group 6-8.9 months 9-11.9 months 615 686 0.674 0.616 413 379 202 63 0.16 0.16 0.24 23 3 81 24 9.1 0.89 2.2 0.60
307 92 0.17 0.18 0.24 28 5 98 29 9.1 0.89 2.3 0.63
RNI values: Vitamin A, 6-24 mo - 400 RE; thiamin, 6-12 mo - 0.3 mg, 12-24 mo - 0.5 mg; riboflavin, 6-12 mo - 0.4 mg, 12-24 mo - 0.5 mg; vitamin B6, 6-12 mo - 0.3 mg, 12-24 mo - 0.5 mg; folate, 6-12 mo - 80 ug, 12-24 mo - 160 ug; vitamin C, 6-24 mo - 30 mg; calcium (absorbed), 6-12 mo - 270 mg (81 mg), 12-24 mo - 500 mg (150 mg); iron (absorbed), 6-12 mo - 9.3 mg (0.93 mg), 12-24 mo - 5.8 mg (0.58 mg); zinc (absorbed), 6-24 mo - 3 mg (1 mg). RNI values from FAO/WHO (2002) were used for all of the vitamins. For the minerals, the recommended amount absorbed was the basis for the calculation (see text). Average breast milk intake = 50th percentile of breast milk intake (WHO 1998).
Table 5. Desired nutrient densitiesa for infants with average breast milk intake 6-8.9 months 9-11.9 months Nutrient Vitamin A (RE) Riboflavin (mg) Thiamin (mg) Vitamin B6 (mg) Vitamin C (mg) Folate (ug) Calcium (mg) Absorbed calcium (mg) Iron (mg) Absorbed iron (mg) Zinc (mg) Absorbed zinc (mg) a
31.2 0.08 0.08 0.12 1.50 11.2
30.0 0.06 0.06 0.08 1.75 9.0
12.1
9.5
0.44
0.29
0.29
0.21
Amount per 100 kcal of complementary food, based on the following RNI values: vitamin A, 6-24 mo - 400 RE; thiamin, 6-12 mo - 0.3 mg, 12-24 mo - 0.5 mg; riboflavin, 6-12 mo - 0.4 mg, 12-24 mo - 0.5 mg; vitamin B6, 6-12 mo - 0.3 mg, 12-24 mo - 0.5 mg; folate, 6-12 mo - 80 ug, 12-24 mo - 160 ug; vitamin C, 6-24 mo - 30 mg; calcium (absorbed), 6-12 mo – 270 mg (81 mg), 12-24 mo - 500 mg (150 mg); iron (absorbed), 6-12 mo - 9.3 mg (0.93 mg), 12-24 mo - 5.8 mg (0.58 mg); zinc (absorbed), 6-24 mo - 3 mg (1 mg). RNI values from FAO/WHO (2002) were used for all of the vitamins. For the minerals, the recommended amount absorbed was the basis for the calculation (see text).
8
Developing & Validating Simple Indicators of Complementary Food Intake & Nutrient Density for Breastfed Children in Developing Countries
Box 1. Example of nutrient density adequacy calculation for folate If intake of folate from complementary foods for a 6-8.9 month old was 20 ug, and complementary food energy intake was 150 kcal, then that day’s percentage of the desired nutrient density for folate would be calculated as: [((20 ug/150 kcal) × 100)/11.2] × 100 = 149% . If that same child ate 250 kcal that day, then the corresponding calculation would be: [((20 ug/250kcal) × 100/11.2] × 100 = 71% .
2.5 Analytical methods For all analyses, the unit of analysis was one child-day, corresponding to one 24-hour record of food intake. In all data sets except Bangladesh, there were multiple child-days per child. For any analyses that included the food group categories or dietary diversity indexes, child-days on which the child consumed a specially fortified product (infant formula or fortified infant cereal) were excluded. These products were rarely consumed but have the potential to greatly influence nutrient adequacy and thus distort the usual relationship between dietary diversity and nutrient adequacy. The percentage of child-days excluded for this reason was < 1% (0.8% in Honduras, 0.7% in Peru, 0.6% in Ghana, and 0.5% in Bangladesh). 2.5.1 Association between dietary diversity and nutrient density adequacy The association between dietary diversity and nutrient density adequacy was first assessed by simple bivariate analyses such as comparison of mean values and correlation coefficients. Simple regression models were used to test if relationships between dietary diversity and nutrient density adequacy were linear.7 Next, for each of the four data sets, sensitivity and specificity analyses were done to compare the performance of indicators in correctly differentiating cases with low and higher MNDA. Sensitivity and specificity analyses were used to identify the cutoff points for dietary diversity (i.e., number of food groups consumed) that best differentiated cases with MNDA below 50% (“poor” dietary quality) or at or above 75% (“better” dietary quality).8
7
That is, the square of the number of food groups was included as an independent variable in the equation. A significant coefficient for this quadratic term was taken to indicate that the relationship was not linear. 8
In conversations among collaborating researchers, there was consensus that an MNDA below 50% could be called low and is very likely to represent an inadequate diet. There was far less consensus surrounding the idea of selecting of a cutoff for a positive indicator. Children with an MNDA ≥ 75% could still be consuming far too little of one or more nutrients. However, for these analyses, use of a higher MNDA cutoff proved to be problematic. In two of the four data sets analyzed here, very few children had MNDA ≥ 75%; this makes it difficult to assess the relationship with any other measure (e.g., dietary diversity). For the purposes of this document, the indicator created by use of a 75% cutoff will be referred to as “better” MNDA; above this cutoff, diets are more likely to be closer to adequate. We also emphasize that the work is primarily aimed towards developing indicators for use at population level, and not at the level of the individual child. We acknowledge that discussions on this issue should continue.
9
Developing & Validating Simple Indicators of Complementary Food Intake & Nutrient Density for Breastfed Children in Developing Countries
Two sets of analyses were completed, one using FGI-8 and the other using FGI-8R as the measure of dietary diversity. 2.5.2 Association between individual food group consumption and nutrient adequacy For each of the four data sets, sensitivity and specificity were also calculated to identify which of the eight food groups were most predictive of whether each of the nine individual NDA scores fell above or below a certain “adequacy” cutoff. For these purposes, the cutoff for an inadequate nutrient density was defined as < 60% of desired for all nutrients except iron.9 This cutoff could not be used for iron density because it was exceedingly rare for iron density to be ≥ 60% of desired; therefore, a cutoff of < 10% of desired was used to define inadequate iron density. These analyses were done both with and without imposing the 10-gram minimum when coding consumption from a given food group as “yes.” In addition, sensitivity and specificity were calculated to test whether selected “sentinel” food groups (yes/no for consumption) could be useful to differentiate cases with MNDA below 50% or above 75%. This was completed both with and without the 10-gram minimum restriction. 2.5.3 Association between feeding frequency and energy intake These analyses included the following: 1) Correlation analysis was used to test the associations between total energy intake (Peru and Bangladesh) or energy from complementary foods (Peru, Bangladesh, and Honduras) and number of feeding episodes (meals + snacks, or meals only, if feeding episodes were subdivided). As before, simple regression models were used to test if relationships between energy and number of feeding episodes were linear.10 For the latter analyses, three “outliers” in Honduras were excluded (because of very high feeding frequency or high energy intake, all due to a high consumption of cow’s milk). 2) Sensitivity and specificity were calculated from 2 x 2 tables to assess which cutoff points for frequency of feeding complementary foods (meals + snacks, or meals only) best differentiated cases with total energy intake above or below total energy requirements (Peru and Bangladesh), or with energy intake from complementary foods above or below the expected level (based on average breast milk intake) at each age (Peru, Bangladesh, and Honduras).
9
Cutoffs of 60% (and 10% for iron) were chosen based on the distribution of densities, and the need to have sufficient numbers of child-days above the cutoff to conduct the analysis.
10 That is, the square of the number of meals (or feeding episodes) was included as an independent variable in the equation. A significant coefficient for this quadratic term was taken to indicate that the relationship was not linear.
10
Developing & Validating Simple Indicators of Complementary Food Intake & Nutrient Density for Breastfed Children in Developing Countries
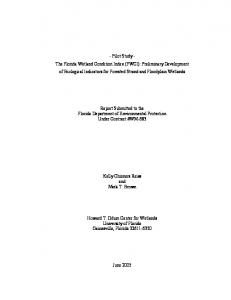
3. RESULTS This section presents the results of our analysis of four data sets. Descriptive information is presented first on the nutritional status, breastfeeding patterns, and complementary feeding practices of the sampled infants. Section 3.4 presents the findings of the validation of dietary diversity indicators to predict the nutrient density adequacy of complementary foods. It is followed in Section 3.5 by an analysis of selected nutrient-dense “sentinel” food groups and their performance in predicting the nutrient density of complementary foods. Section 3.6 addresses the second objective of the research, i.e., to test whether simple indicators of feeding frequency accurately predict energy intake from complementary foods. 3.1 Characteristics of samples: Anthropometry Figure 1 and Table 6 provide information on the nutritional status of children in the samples. As is usually observed, mean height-for-age Z-scores (HAZ) decrease with age, and conversely, the prevalence of stunting (low height-for-age) increases. With the exception of Bangladesh, very few children have low weight-for-height. Favorable indicators in Ghana presumably reflect the effect of the complementary food intervention (see methods). Figure 1. Mean height-for-age Z-score (HAZ), by country and by age group
Mean HAZ
Peru 0 -0.2 -0.4 -0.6 -0.8 -1 -1.2 -1.4 -1.6 -1.8
Honduras
Ghana
Bangladesh
-0.21 -0.55
-0.61
-0.84 -1.07 -1.48 -1.57
6-8.9 mo
9-11.9 mo
3.2 Characteristics of samples: Breastfeeding Data on both breastfeeding frequency and breast milk intake are available only for Peru and Bangladesh. Table 7 summarizes the information on breast milk intake and frequency of feeding for children in these two samples. The frequency of breastfeeding is much lower in Peru than in Bangladesh for all age groups, and within each country, the frequency changes only slightly across the two age groups. In contrast, breast milk intake decreases markedly across age groups in Peru, while this is not the case in Bangladesh. In these data sets, there is not a clear and consistent relationship between breastfeeding frequency and breast milk intake. Table 7 also
11
Developing & Validating Simple Indicators of Complementary Food Intake & Nutrient Density for Breastfed Children in Developing Countries
shows that more children in Bangladesh exceed the age-specific global average for breast milk intake than in Peru. Table 6. Percent of child-days when children were stunted or wasted, by country and by age group Country/age group Peru 6-8.9 months 9-11.9 months Honduras 6-8.9 months Ghana 6-8.9 months 9-11.9 months Bangladesh 6-8.9 months 9-11.9 months
n
Percent stunted HAZ < -2
Percent wasted WHZ < -2
318 254
4 8
1 1
495
15
0
209 172
0 3
3 5
48 65
40 29
25 20
3.3 Characteristics of the sample: Complementary feeding 3.3.1 Frequency of feeding As noted earlier, definitions of frequency of feeding differed between the samples, and no data are available for Ghana. In Peru, enumerators observed and noted each feeding episode, and snacks were not distinguished from meals; in Honduras, meals and snacks were self-defined by mothers; in Bangladesh, meals were defined as any feeding episode during which the child consumed at least 10 grams of food, and snacks were defined as feeding episodes when the child ate less than 10 grams. Recently updated guidance for complementary feeding of the breastfed child recommends that children aged 6-8.9 months be fed meals of complementary food at least 2-3 times per day along with additional snacks, as desired. Older infants and children (9-23.9 months) should be fed meals at least 3-4 times per day, with additional snacks (PAHO/WHO 2003).11 Table 8 shows the mean frequency of feeding episodes (Peru), and meals and snacks (Honduras and Bangladesh), and also shows the proportion of children who ate at least the minimum recommended number of meals the previous day.12
11
The lower frequencies (two meals for the younger age group and three meals for the older) assume breast milk intake at a level that is average in developing countries, whereas the higher frequencies (three meals for the younger and four meals for the older) assume low breast milk intake. These recommendations also assume that complementary foods meet a criterion for minimum energy density of 0.8 kcal/g, and that infants eat to gastric capacity at each meal. 12
Tables A1 and A2 in the annex provide the distribution (number and percent) of child-days falling into each frequency of feeding category.
12
Table 7. Frequency of breastfeeding and breast milk intake, by country and by age group
Country/age group Peru 6-8.9 months 9-11.9 months Bangladesh 6-8.9 months 9-11.9 months a b
Number of observations
Mean 12-hour breastfeeding frequency (SD)
Mean 12-hour breast milk intake (g) (SD)
Mean 24-hour breastfeeding frequency (SD)
Mean 24-hour breast milk intake (g) (SD)
Global averagea
Percent of observations above global averageb
365 274
4.6 (1.6) 4.1 (1.8)
356 (140) 305 (136)
n/ab
658 (210) 582 (212)
674 616
51 47
54 70
8.5 (2.2) 8.0 (1.8)
373 (124) 388 (109)
12.0 (2.8) 11.6 (2.3)
703 (235) 732 (206)
As above
57 71
(WHO 1998). Mean 24-hour breastfeeding frequencies are not available for Peru.
13
Developing & Validating Simple Indicators of Complementary Food Intake & Nutrient Density for Breastfed Children in Developing Countries
Table 8. Frequency of meals and snacks, by country and by age group Percent fed fewer than minimum recommended meals Feeding Meals episodesa
Mean meal frequency (SD)
Mean snack frequency (SD)
Mean total frequency of feeding episodes (SD)
n/ab
n/a
3.6 (2.4) 4.8 (2.7)
n/a
20 18
Honduras 6-8.9 months
2.5 (0.7)
0.7 (0.9)
3.2 (1.2)
11
7
Bangladesh 6-8.9 months 9-11.9 months
2.2 (1.7) 3.0 (2.0)
0.8 (1.1) 0.9 (1.0)
3.0 (1.7) 3.9 (2.1)
39 40
24 27
Country/age group Peru 6-8.9 months 9-11.9 months
a
The guideline refers to meals; data are shown here both for meals and with “feeding episodes” considered as meals, for comparison. b n/a: data not available.
In Honduras, only one in ten infants was fed too infrequently; low frequency of feeding appears to be a more common problem in Peru and particularly in Bangladesh, where nearly half the children (four in ten) were fed less frequently than the minimum recommendation. 3.3.2 Food groups consumed and dietary diversity Tables 9 and 10 show the proportion of child-days each food group was consumed. The first table shows the proportions when 1 gram was the minimum amount used to define consumption. The second table shows the proportions when a 10-gram minimum was applied to each food group (i.e., the child was not considered to have eaten that food group on that day unless he/she ate a minimum of 10 grams, except for fats and oils). Table 9. Percent of child-days various food groups were consumed, by country and by age group (1-gram minimum)
Peru 6-8.9 months 9-11.9 months Honduras 6-8.9 months Ghana 6-8.9 months 9-11.9 months Bangladesh 6-8.9 months 9-11.9 months
Vitamin A Other -rich fruits and fruits and Fats and vegetables vegetables oils
Grains, roots, tubers
Legumes and nuts
Dairy
Flesh foods
Eggs
92 99
4 5
40 48
28 38
11 16
60 66
49 69
13 30
95
14
53
28
42
16
69
19
100 99
67 70
18 12
43 58
3 1
5 13
15 48
10 44
96 99
18 30
10 21
2 9
4 1
4 12
27 31
4 6
14
Developing & Validating Simple Indicators of Complementary Food Intake & Nutrient Density for Breastfed Children in Developing Countries
Table 10. Percent of child-days various food groups were consumed, by country and by age group (10-gram minimum)
Peru 6-8.9 months 9-11.9 months Honduras 6-8.9 months Ghana 6-8.9 months 9-11.9 months Bangladesh 6-8.9 months 9-11.9 months
Vitamin A rich fruits Other fruits and and vegetables vegetables
Grains, roots, tubers
Legumes and nuts
Dairy
Flesh foods
Eggs
79 98
1 3
35 42
14 20
4 9
26 34
22 41
80
3
27
13
30
5
60
99 99
56 61
15 12
12 24
1 1
3 6
8 34
78 84
8 22
8 21
0 0
4 1
4 7
20 21
Patterns of food groups consumed vary substantially between the data sets. For example, legumes were consumed by very few infants in Peru or Honduras, but in Ghana, two-thirds of the infants had at least a taste and more than half had 10 grams or more. Conversely, dairy foods were widely consumed only in Peru and Honduras, and eggs were widely consumed only in Honduras. Flesh foods were consumed by a substantial proportion of infants (28-58%) everywhere except Bangladesh. However, even in the three countries where infants commonly had at least a taste, it appears that amounts were generally small, and only 12-24% of the infants consumed 10 grams or more of these foods. Vitamin A-rich fruits and vegetables were commonly eaten in Peru, but not elsewhere. In general, applying the 10-gram minimum makes a marked difference in the estimates of the proportion of children who consumed foods from the different groups. This is less true for staple foods (grains/roots/tubers), which were eaten on most child-days, and for dairy products (except in Honduras). Also, when food groups are rarely consumed (e.g., eggs in Ghana and Bangladesh), there is little difference in the proportions. For most food groups in most countries, however, using the 10-gram restriction on the amount of food consumed resulted in large differences in the estimated proportions of children who had consumed that food group. Annexes 2-5 show the mean and median amounts (grams) and energy (kcal) consumed from each food group both for the sample overall, and for child-days when the food group was consumed. Figures 2 and 3 show mean food group diversity for our two diversity indexes—the FGI-8 (1gram minimum) and the FGI-8R (10-gram minimum)—by country and age group. As would be expected, mean food group diversity is considerably lower when the 10-gram minimum is applied. Scores for the FGI-8R are generally 30-40% lower than when no minimum is applied (FGI-8). Regardless of which score is used, however, cross-country comparisons are similar, with Bangladesh showing the lowest diversity, followed by Ghana, and the highest diversity found in the Latin American samples. Also as would be expected, mean diversity increases markedly with age. Tables 11 and 12 show frequency distributions for the two diversity indexes, by country, and present a similar picture. 15
Developing & Validating Simple Indicators of Complementary Food Intake & Nutrient Density for Breastfed Children in Developing Countries
Mean food group diversity score
Figure 2. Mean food group diversity, by country and by age group (FGI-8: range 0-8, 1-gram minimum)
4 3.5 3 2.5 2 1.5 1 0.5 0
Peru 3.7 3
Honduras
Ghana
Bangladesh
3.4
3.3 2.6
2.1 1.7
6-8.9 mo
9-11.9 mo
Mean food group diversity score
Figure 3. Mean food group diversity, by country and by age group (FGI-8R: range 0-8, 10-gram minimum)
3
Peru 2.8
Ghana 2.8
Bangladesh
2.4
2.5 2
Honduras
2.0
1.9
1.6 1.3
1.5 1 0.5 0 6-8.9 mo
16
9-11.9 mo
Developing & Validating Simple Indicators of Complementary Food Intake & Nutrient Density for Breastfed Children in Developing Countries
Table 11. Percent of child-days at each food group diversity score, by country (FGI-8: 1-gram minimum) Number of food groups 1 2 3 4 5 6 7 8
Peru 12 16 25 28 13 5 1 0
Honduras 10 21 25 22 14 6 1 0
Ghana 8 36 25 16 10 4 1 0
Bangladesh 41 34 17 6 1 0 0 0
Table 12. Percent of child-days at each food group diversity score, by country (FGI-8R; 10-gram minimum) Number of food groups 0 1 2 3 4 5 6 7 8
Peru 4 28 27 22 13 4 1 0 0
Honduras 5 22 29 26 12 5 1 0 0
Ghana 1 20 41 22 13 3 1 0 0
Bangladesh 12 44 32 9 2 1 0 0 0
Table 13 shows an example from Peru of how diet patterns change as dietary diversity increases. The example uses the FGI-8; results for all four countries are shown in Annexes 6-9. Table 13. Peru: Percentage of child-days on which different food groups were consumed, by FGI-8 score (infants 6-11.9 months)
Percent (number) of childdays at each diversity score Food groups Grains, roots, tubers Legumes and nuts Dairy Flesh foods Eggs Vitamin A-rich fruits and vegetables Other fruits & vegetables Fats and oil
1
2
12% (71)
16% (91)
72 0 18 0 3 3 4 0
FGI-8 score (number of food groups) 3 4 5 6
7
8
25% (146)
1% (5)
0% (0)
28% (160)
13% (74)
5% (26)
Percent of child-days on which each food group was consumed 96 98 99 100 100 100 0 1 8 9 15 20 29 38 48 65 92 100 14 24 48 53 73 100 4 9 15 23 46 80 36 20 1
71 51 8
17
77 83 23
96 97 57
92 100 81
100 100 100
Developing & Validating Simple Indicators of Complementary Food Intake & Nutrient Density for Breastfed Children in Developing Countries
In Peru, children whose diet includes only one food group are most likely to receive foods from the grains/roots/tubers group. The second most commonly consumed foods among those who had only one food group are dairy products. Fruits and vegetables and flesh foods become more common at diversity scores of 4 or higher, while eggs, legumes, and fats and oil are rare until diversity scores are 6-7. Patterns differ across countries (see Annexes 6-9). 3.3.3 Energy and nutrient intakes, and nutrient density adequacy of complementary foods Desired energy and nutrient intakes from complementary foods for various age groups were calculated from the RNIs described in the methods section, assuming average breast milk intake (WHO 1998). Using these desired intakes, we calculated the percent of desired levels for each child-day in the four country samples. Complete information about desired intakes, actual intakes, and percent of desired intakes is given in Annex 10. Table 14 provides information on the median percent of desired intake, by country and age, in order to identify which nutrients were most problematic in these samples. Table 15 shows results for the median percentage of desired nutrient densities. Tables 14 and 15 illustrate that iron was a problematic nutrient in all four countries, with the median percent of desired absorbed iron density being only 5-13% at 6-8.9 months and 9-36% at 9-11.9 months. Median vitamin A density was very low in Bangladesh (0-1% of desired) and Ghana (0-31% of desired), but higher in Honduras (82% of desired) and Peru (65-92% of desired). Median absorbed zinc density was low during both age intervals and across countries (22-63% of desired at 6-8.9 months, 42-57% of desired at 9-11.9 months). Median absorbed calcium and vitamin B6 density was low (< 60% of desired) in Peru and Bangladesh at 6-8.9 months, and in Bangladesh at 9-11.9 months. Median riboflavin density was generally low in Bangladesh and Ghana, but close to or more than adequate in Peru and Honduras, while median thiamin density tended to be low in Peru and Bangladesh but more adequate in Honduras and Ghana. Median folate density was low in Bangladesh and Ghana at 6-8.9 months, but was otherwise > 60% of desired. Median vitamin C density was very low in Ghana and Bangladesh but more than adequate in Peru and Honduras. As described previously, the individual nutrient density adequacy (NDA) for each of nine “problem” nutrients was calculated for each day of intake. The overall mean nutrient density adequacy (MNDA) was calculated as the average of the nine individual nutrient density adequacy scores for that day, after each was capped at 100%. Figure 4 compares this summary MNDA across countries and age groups.
18
Developing & Validating Simple Indicators of Complementary Food Intake & Nutrient Density for Breastfed Children in Developing Countries
Table 14. Median percent desired energy and nutrient intake from complementary foods, by country and by age group Energy and nutrients
Peru
6-8.9 months Energy Vitamin A Thiamin Riboflavin Vitamin B6 Folate Vitamin C Absorbed calcium Absorbed iron Absorbed zinc 9-11.9 months Energy Vitamin A Thiamin Riboflavin Vitamin B6 Folate Vitamin C Absorbed calcium Absorbed iron Absorbed zinc a b
Honduras Ghana Percent desired intakea
Bangladesh
56 67 30 49 39 56 85 22 4 20
78 69 72 87 58 82 234 63 6 23
78 0 61 38 51 49 7 49 14 49
39 0 24 22 7 29 0 13 2 9
80 52 53 90 61 80 93 43 9 36
n/ab
90 48 88 53 82 69 37 126 32 52
37 0 33 24 18 41 7 19 3 17
Desired intake calculated based on average breast milk intake (WHO 1998). n/a = no data for this age group.
Table 15. Median percent desired nutrient density of complementary foodsa, by country and by age group Nutrients
a b
Peru Honduras Ghana Bangladesh Percent desired nutrient density of complementary foods
6-8.9 months Vitamin A Thiamin Riboflavin Vitamin B6 Folate Vitamin C Absorbed calcium Absorbed iron Absorbed zinc 9-11.9 months Vitamin A Thiamin Riboflavin Vitamin B6 Folate Vitamin C Absorbed calcium Absorbed iron Absorbed zinc
92 49 92 59 74 157 52 6 37
82 89 95 74 89 261 80 8 30
0 75 50 64 60 11 63 13 63
0 58 53 15 54 0 28 5 22
65 62 115 83 87 130 69 10 49
n/ab
31 97 60 93 77 35 167 36 57
1 82 81 36 116 19 48 9 42
See methods for calculations. n/a = no data for this age group.
19
Developing & Validating Simple Indicators of Complementary Food Intake & Nutrient Density for Breastfed Children in Developing Countries
Figure 4 shows that the MNDA increases with age, in a pattern similar to the increases in dietary diversity illustrated in Figures 2 and 3. Also as with diversity, the MNDA is highest in the two Latin American countries, intermediate in Ghana, and lowest in Bangladesh. Figure 4. Mean Nutrient Density Adequacy (MNDA), by country and by age group Peru
Honduras
Ghana
Bangladesh
100
MNDA
80 60
56
63
64
64 49
49 35
40 20 0 6-8.9 mo
9-11.9 mo
In order to better understand how patterns of food group consumption relate to differences in nutrient intake and density, we examined the contribution of each food group to energy and nutrient intakes from complementary foods (see Tables 16-19). Just as patterns of food group intake vary between countries, food groups vary considerably in their overall contribution to energy and nutrient intakes. The proportion of energy intake (kcal) from grains/roots/tubers varies from 33% in Honduras to 76% in Bangladesh.13 Other food groups providing at least 10% of energy vary by country and include: dairy products in Peru; dairy products, eggs, and “other” fruits and vegetables in Honduras; and legumes in Ghana (no other food group provides more than 6% of energy in Bangladesh). Contributions of food groups to other nutrients also reflect diet patterns. For example, because dairy products are rich in many nutrients and because they were eaten on nearly one-half of all observed days in Peru, this food group contributes a substantial proportion of many nutrients in Peru. Similarly, eggs were commonly consumed in Honduras, and contributed ~20% of the intake of several key nutrients such as iron, zinc, riboflavin, and vitamin A. Conversely, vitamin A-rich fruits and vegetables could not contribute substantial proportions to vitamin A intake in three of the four countries because they were not eaten on the majority of child-days.
13
Note that the Honduran sample includes only infants 6-8.9 months, whereas the other samples all include older infants.
20
Developing & Validating Simple Indicators of Complementary Food Intake & Nutrient Density for Breastfed Children in Developing Countries
Table 16. Peru: Percent contribution of food groups to intake (from complementary foods) of energy and selected “problem” nutrients (children 6-11.9 months)a Food group (%)
Nutrients Energy Vitamin A Thiamin Riboflavin Vitamin B6 Folate Vitamin C Absorbed calcium Absorbed iron Absorbed zinc a
Grains, roots, tubers 51 2 56 38 46 40 38 29 43 49
Legumes and nuts 1 0 2 1 1 3 1 1 2 2
Dairy 16 24 16 31 15 15 3 35 14 22
Flesh foods 5 13 7 13 9 11 6 4 16 13
Eggs 2 5 3 3 3 3 0 3 4 3
Vitamin A-rich Other fruits and fruits and vegetables vegetables 3 6 37 8 6 10 5 8 11 15 14 13 20 22 12 11 8 10 5 5
Fats and oil 2 0 0 0 0 0 0 0 0 0
Row percents do not total 100 because certain foods were not included in any group (e.g., sweets).
Table 17. Honduras: Percent contribution of food groups to intake (from complementary foods) of energy and selected “problem” nutrients (infants 6-8.9 months)a Food group (%)
Nutrients Energy Vitamin A Thiamin Riboflavin Vitamin B6 Folate Vitamin C Absorbed calcium Absorbed iron Absorbed zinc a
Grains, roots, tubers 33 9 40 19 38 26 18 24 39 30
Legumes and nuts 1 0 1 1 1 4 2 1 2 2
Dairy 10 21 8 17 7 8 6 24 3 15
Flesh foods 5 6 4 7 6 4 1 2 9 11
Eggs 10 25 6 20 12 18 0 11 20 18
Vitamin A-rich Other fruits and fruits and vegetables vegetables 1 21 7 22 1 22 1 22 2 31 2 34 5 58 2 21 2 15 1 13
Fats and oil 3 2 0 0 0 0 0 0 0 0
Row percents do not total 100 because certain foods were not included in any group (e.g., sweets).
Table 18. Ghana: Percent contribution of food groups to intake (from complementary foods) of energy and selected “problem” nutrients (infants 6-11.9 months)a Food group (%)
Nutrients Energy Vitamin A Thiamin Riboflavin Vitamin B6 Folate Vitamin C Absorbed calcium Absorbed iron Absorbed zinc a
Grains, roots, tubers 56 2 66 51 73 57 11 22 36 58
Legumes and nuts 12 35 25 29 11 24 38 21 17 19
Dairy 2 14 4 8 2 3 10 8 2 3
Flesh foods 6 1 15 4 10 8 0 44 41 18
Eggs 0 1 0 1 0 1 0 1 0 1
Vitamin A-rich Other fruits and fruits and vegetables vegetables 1 1 7 15 0 2 1 3 1 3 1 7 2 20 1 3 1 1 0 1
Row percents do not total 100 because certain foods were not included in any group (e.g., sweets).
21
Fats and oil 6 4 0 0 0 0 0 0 0 0
Developing & Validating Simple Indicators of Complementary Food Intake & Nutrient Density for Breastfed Children in Developing Countries
Table 19. Bangladesh: Percent contribution of food groups to intake (from complementary foods) of energy and selected “problem” nutrients (children aged 6-11.9 months)a Food group (%)
Nutrients Energy Vitamin A Thiamin Riboflavin Vitamin B6 Folate Vitamin C Absorbed calcium Absorbed iron Absorbed zinc a
Grains, roots, tubers 76 2 71 64 58 59 3 71 69 72
Legumes and nuts 3 16 10 6 12 18 16 3 13 9
Dairy 5 16 7 12 9 6 13 14 3 9
Flesh foods 0 0 1 0 1 0 0 0 0 0
Eggs 1 2 1 2 1 1 0 1 2 1
Vitamin A-rich Other fruits and fruits and vegetables vegetables 1 6 8 16 3 7 4 10 3 16 4 10 6 22 2 7 4 6 2 6
Fats and oil 1 0 0 0 0 0 0 0 0 0
Row percents do not total 100 because certain foods were not included in any group (e.g., sweets).
3.4 Association between dietary diversity and nutrient density adequacy of complementary foods This section presents the results of analyses done to test how well dietary diversity indicators could predict dietary quality of complementary foods. As indicated earlier, dietary quality is defined here as the mean nutrient density adequacy (MNDA) of complementary foods. The MNDA summarizes nutrient density of the diet relative to desirable nutrient density for nine problem nutrients, assuming average breast milk intake. 3.4.1 Comparison of means Figures 5-12 summarize the relationships between dietary diversity (using both FGI-8 and FGI8R) and the MNDA. In all four countries and for all age groups, the mean nutrient density adequacy (MNDA) of complementary foods increases as dietary diversity increases, although the association is not consistently linear.
22
Developing & Validating Simple Indicators of Complementary Food Intake & Nutrient Density for Breastfed Children in Developing Countries
Figure 5. Peru: Mean Nutrient Density Adequacy score (MNDA), by dietary diversity index and child age: for FGI-8 (1-gram minimum) MNDA
6-8.9 mo
9-11.9 mo
100 80
66 54
60
69
64
58
67
70
4
5
6-7
50 35
33
40
68
20 0
1
2
3 4 5-6 1 2 Dietary diversity index (FGI-8)
3
Figure 6. Peru: Mean Nutrient Density Adequacy score (MNDA), by dietary diversity index and child age: for FGI-8R (10-gram minimum) MNDA
6-8.9 mo
9-11.9 mo
100 80 58
60 42
64
70 61
49
65
70
75
48
40 20 0
0
1
2 3 4-5 0-1 2 3 Dietary diversity index (FGI-8R)
23
4 5-6
Developing & Validating Simple Indicators of Complementary Food Intake & Nutrient Density for Breastfed Children in Developing Countries
Figure 7. Honduras: Mean Nutrient Density Adequacy (MNDA), by dietary diversity index and child age: for FGI-8 (1-gram minimum) MNDA
6-8.9 mo
100 80
67
68
69
70
59 60
48
40 20 0
1
2
3 4 5 6-8 Dietary diversity index (FGI-8)
Figure 8. Honduras: Mean Nutrient Density Adequacy (MNDA) by dietary diversity index and child age: for FGI-8R (10-gram minimum) MNDA
6-8.9 mo
100 80 64 60
54
54
0
1
69
70
74
40 20 0
2 3 4 5-7 Dietary diversity index (FGI-8R)
24
Developing & Validating Simple Indicators of Complementary Food Intake & Nutrient Density for Breastfed Children in Developing Countries
Figure 9. Ghana: Mean Nutrient Density Adequacy (MNDA), by dietary diversity index and child age: for FGI-8 (1-gram minimum) MNDA
6-8.9 mo
9-11.9 mo
100 80
68
66
3 4 5-7 1-2 3 Dietary diversity index (FGI-8)
4
59
65
64
75
71
53
60 43 40
30
20 0
1
2
5
6-7
Figure 10. Ghana: Mean Nutrient Density Adequacy (MNDA) score, by dietary diversity index and child age: for FGI-8R (10-gram minimum) MNDA
6-8.9 mo
9-11.9 mo
100 80 80 62 60 40
66 55
49
60
64
71
38
20 0
0-1
2 3 4-6 1 2 Dietary diversity index (FGI-8R)
25
3
4
5-7
Developing & Validating Simple Indicators of Complementary Food Intake & Nutrient Density for Breastfed Children in Developing Countries
Figure 11. Bangladesh: Mean Nutrient Density Adequacy (MNDA), by dietary diversity index and child age: for FGI-8 (1-gram minimum) MNDA
6-8.9 mo
9-11.9 mo
58
59
100 80
69
60
52
47 34
40 23 20 0
1
2 3- 4 1 Dietary diversity index (FGI-8)
2
3
4- 5
Figure 12. Bangladesh: Mean Nutrient Density Adequacy (MNDA), by dietary diversity index and child age: for FGI-8R (10-gram minimum)
MNDA
6-8.9 mo
9-11.9 mo
100 80
69
60 40
69 52
48 30
36
42
27
20 0
0
1 2 3- 4 0 Dietary diversity index (FGI-8R)
26
1
2
3-5
Developing & Validating Simple Indicators of Complementary Food Intake & Nutrient Density for Breastfed Children in Developing Countries
3.4.2 Correlation analysis Tables 20 and 21 show the correlation coefficients between MNDA and the two dietary diversity indexes, FGI-8 and FGI-8R, respectively. All correlations are statistically significant and, in general, moderate, ranging from 0.37 to 0.74 when the 1-gram minimum criterion is applied (FGI-8), and from 0.41 to 0.64 when the 10-gram minimum is applied (FGI-8R). Correlations are strongest in Bangladesh and Ghana. Table 20. Relationship between mean nutrient density adequacy (MNDA) and dietary diversity (FGI-8), by country and by age group
Peru 6-8.9 months 9-11.9 months Honduras 6-8.9 months Ghana 6-8.9 months 9-11.9 months Bangladesh 6-8.9 months 9-11.9 months
MNDA (mean)
FGI-8 (mean)
Correlation coefficienta
Test for linear trendb
56 63
3.0 3.7
0.56 0.44
Not linear Not linear
64
3.3
0.37
Not linear
49 64
2.8 3.4
0.70 0.44
Not Linear Not Linear
35 49
1.7 2.1
0.74 0.70
Linear Linear
a
All correlations are significant (p < 0.05). Tests for linearity were performed using SAS PROC REG by adding a quadratic term to the equation; a significant quadratic term was taken to indicate a non-linear relationship. b
Table 21. Relationship between mean nutrient density adequacy (MNDA) and dietary diversity (FGI-8R), by country and by age group
Peru 6-8.9 months 9-11.9 months Honduras 6-8.9 months Ghana 6-8.9 months 9-11.9 months Bangladesh 6-8.9 months 9-11.9 months a
MNDA (mean)
FGI-8 (mean)
Correlation with MNDAa
Test for linear trendb
56 63
1.9 2.8
0.41 0.47
Linear Not linear
64
2.4
0.42
Not linear
49 64
2.0 2.8
0.61 0.41
Linear Linear
35 49
1.3 1.6
0.62 0.64
Linear Linear
All correlations are significant (p < 0.05). Tests for linearity were performed using SAS PROC REG by adding a quadratic term to the equation; a significant quadratic term was taken to indicate a non-linear relationship. b
27
Developing & Validating Simple Indicators of Complementary Food Intake & Nutrient Density for Breastfed Children in Developing Countries
3.4.3 Sensitivity and specificity analysis To assess the performance of the different dietary diversity indexes in predicting the mean nutrient density adequacy (MNDA) of complementary foods, we conducted sensitivity and specificity analyses. As described earlier (pages 10-11), for each country, we used two cutoff points: < 50% MNDA and ≥ 75% MNDA. Box 2 defines some of the terminology used in the sensitivity/specificity analysis and presents some general considerations in selecting indicators and cutoff points for different purposes. The analysis was conducted with both indexes of dietary diversity (FGI-8 and FGI-8R), for each country and for each of the MNDA cutoff points (< 50% and ≥ 75%). To ensure reasonable cell sizes, analyses were done with all age groups combined. Results using the 50% MNDA cutoff point are presented in Tables 22 and 23 and Figures 13-16. The tables show that for the 50% MNDA cutoff, the best combinations of sensitivity/specificity were generally achieved at a cutoff point of ≤ 2 for the FGI-8 index and at a cutoff point of ≤ 1 for the FGI-8R. The index that included a 10-gram minimum restriction (FGI-8R, using a cutoff of ≤ 1) performed somewhat better than the simpler FGI-8 (using a cutoff of ≤ 2) in Honduras and Bangladesh, but the opposite was true in Peru and Ghana. Using the 1.25) is arbitrary, but allows us to narrow our presentation to those results that provide some balance (i.e. neither Se nor Spe nears 0). As discussed in Box 2, depending on the application, either Se, or Spe, or a balance of the two might be more desirable.”
16 For simplicity, in the next several paragraphs we refer to consumption of a particular food group as “predictive of NDA,” rather than repeating “predictive of nutrient density above a cutoff of 60% (or 10%).”
33
Developing & Validating Simple Indicators of Complementary Food Intake & Nutrient Density for Breastfed Children in Developing Countries
predicted by consumption of other fruits and vegetables in all four sites, vitamin A-rich fruits and vegetables in Peru and Bangladesh, dairy products in Honduras, and oils and fats in Ghana. Table 24. Sensitivity and specificity analysis of dietary diversity (FGI-8: 1-gram minimum) to predict better mean nutrient density adequacy (MNDA ≥ 75%)a
Country Peru
Age in months Cutoff Sensitivity Specificity
Proportion Total of false proportion negatives misclassified
≥5 ≥4 ≥3
0.29 0.71 0.91
0.85 0.61 0.34
0.57 0.40 0.30
0.11 0.29 0.50
0.15 0.06 0.02
0.26 0.35 0.52
6-8.9
≥5 ≥4 ≥3
0.34 0.62 0.90
0.82 0.62 0.38
0.53 0.44 0.34
0.13 0.27 0.46
0.15 0.09 0.02
0.28 0.36 0.48
6-11.9
≥5 ≥4 ≥3
0.38 0.81 0.96
0.89 0.76 0.50
0.51 0.36 0.22
0.09 0.20 0.44
0.07 0.02 0.01
0.16 0.23 0.44
6-11.9
≥4 ≥3 ≥2
0.50 0.83 1.00
0.96 0.79 0.44
0.50 0.21 0.09
0.04 0.20 0.53
0.03 0.01 0.00
0.07 0.21 0.53
Ghana
Bangladeshb
b
Proportion of false positives
6-11.9
Honduras
a
Positive predictive value
The MNDA averages the percent desired nutrient density, capped at 100%, for nine problem nutrients. Note that the trade-off between sensitivity and specificity occurs at lower cutoff values in Bangladesh than in the other countries.
Table 25. Sensitivity and specificity analysis of dietary diversity (FGI-8R: 10-gram minimum) to predict better mean nutrient density adequacy (MNDA ≥ 75%)a
Country Peru
Age in months Cutoff Sensitivity Specificity
Proportion of false positives
Proportion Total of false proportion negatives misclassified
6-11.9
≥4 ≥3 ≥2
0.36 0.63 0.80
0.87 0.65 0.35
0.44 0.35 0.26
0.10 0.27 0.50
0.14 0.08 0.05
0.25 0.35 0.55
6-8.9
≥4 ≥3 ≥2
0.33 0.69 0.92
0.88 0.64 0.33
0.46 0.39 0.31
0.09 0.27 0.50
0.17 0.08 0.02
0.26 0.34 0.52
6-11.9
≥4 ≥3 ≥2
0.53 0.85 1.00
0.89 0.68 0.24
0.40 0.27 0.16
0.10 0.28 0.67
0.06 0.02 0.00
0.16 0.30 0.67
6-11.9
≥4 ≥3 ≥2
0.33 0.67 0.67
0.99 0.91 0.57
0.67 0.29 0.08
0.01 0.09 0.41
0.03 0.02 0.02
0.04 0.10 0.42
Honduras
Ghana
Bangladesh
a
Positive predictive value
The MNDA averages the percent desired nutrient density, capped at 100%, for nine problem nutrients.
34
Developing & Validating Simple Indicators of Complementary Food Intake & Nutrient Density for Breastfed Children in Developing Countries
Table 26. Food groups predictivea of nutrient density adequacyb, by country Nutrients Vitamin A
Peru ► Dairy products ► Vitamin A-rich fruits and vegetables
Country Honduras Ghana ► Eggs ► Dairy products ► Dairy products ► Other fruits and vegetables ► Vitamin A-rich fruits and vegetables ► Fats/oils
Thiamin
►
Legumes/nuts
Bangladesh ► Other fruits and vegetables ► Vitamin A-rich fruits and vegetables
Riboflavin
► ►
Dairy products Flesh foods
►
Eggs
►
Dairy products
►
Dairy products
Vitamin B6
► ► ►
Flesh foods Eggs Other fruits and vegetables
►
Other fruits and vegetables
► ►
Flesh foods Eggs
►
Other fruits and vegetables
Folate
►
Other fruits and vegetables ► Vitamin A-rich fruits and vegetables
►
Other fruits and vegetables
►
Legumes/nuts
►
Vitamin C
►
Other fruits and vegetables ► Vitamin A-rich fruits and vegetables
► ►
Dairy products Other fruits and vegetables
► ►
Oils/fats Other fruits and vegetables
►
Calcium
►
Dairy products
►
Dairy products
►
Flesh foodsc
►
Dairy products
Iron
►
Flesh foods
►
Eggs
►
Flesh foods
►
Legumes/nuts
Zinc
►
Flesh foods
►
Flesh foods
►
Flesh foods
► ► ►
Eggs Legumes/nuts Other fruits and vegetables
Other fruits and vegetables ► Legumes/nuts
Other fruits and vegetables ► Vitamin A-rich fruits and vegetables
a
Sensitivity plus specificity > 1.25.
b
Cutoff for low nutrient density was < 60% of desired, except for iron for which the cutoff was < 10% of desired.
c
Fish powder, including the bones, was an ingredient in the improved complementary foods provided to infants in two of the three intervention groups in Ghana.
35
Developing & Validating Simple Indicators of Complementary Food Intake & Nutrient Density for Breastfed Children in Developing Countries
Calcium NDA was predicted by consumption of dairy products in Peru, Honduras, and Bangladesh, as well as by consumption of flesh foods in Ghana. The relationship with flesh foods was due to the consumption of fish powder (including the bones), which was an ingredient in the improved complementary foods provided to infants in two of the three intervention groups in Ghana. Iron NDA was predicted by consumption of flesh foods in Peru and Ghana, eggs in Honduras, and legumes/nuts in Bangladesh. Lastly, zinc NDA was predicted by consumption of flesh foods in Peru, Honduras and Ghana, and by consumption of eggs, legumes/nuts and other fruits and vegetables in Bangladesh. Sensitivity and specificity analyses were also conducted to identify whether any of the individual food groups were predictive of mean nutrient density adequacy (MNDA). Tables 27-28 show results for the < 50% cutoff point of MNDA; the results using the 1-gram minimum criterion for food group consumption are shown in Table 27, and those with the 10-gram minimum criterion for each food group are shown in Table 28. Comparable results using the ≥ 75% cutoff point of MNDA are presented in Tables 29-30. Only food groups for which the sum of Se and Spe was greater than 1.25 are included. In addition to the eight food groups used in previous analyses, a new group was created for animal source foods (ASF, which included dairy products, flesh foods, or eggs). Using the 50% MNDA cutoff and the 1-gram minimum, non-consumption of the ASF and other fruits and vegetables food groups was predictive of low MNDA in all four countries. Nonconsumption of dairy products was predictive of low MNDA in three of the four countries, but specificity was quite low. In general, the results were not improved by using the 10-gram minimum. When compared with the results for dietary diversity (using a cutoff of ≤ 2 food groups for FGI8) and the 50% MNDA cutoff (Table 22), non-consumption of the ASF food group yielded similar or better results in three of the four sites (the exception being Peru). In Honduras, sensitivity was better with dietary diversity, but specificity and the percentage misclassified were better with ASF. In Ghana, the results were very similar whether dietary diversity or ASF was used. In Bangladesh, ASF clearly outperformed dietary diversity, but in Peru the dietary diversity indicator gave somewhat better results than ASF. Using the ≥ 75% MNDA cutoff (with either 1-gram or 10-gram minimum), consumption of the ASF food group was predictive of higher MNDA in three of the four countries. The percentage misclassified was somewhat better when using the 10 gram minimum. When compared with the results for dietary diversity (using a cutoff of ≥ 4 food groups for FGI-8) and the ≥ 75% MNDA cutoff (Table 24), the ASF food group yielded similar results in Peru and Bangladesh, but the dietary diversity indicator performed better in Honduras and Ghana. When dietary diversity was defined using a cutoff of ≥ 3 food groups for FGI-8R and the ≥ 75% MNDA cutoff (Table 25), it outperformed the ASF food group in Peru, Honduras, and Bangladesh, but not in Ghana.
36
Table 27. Sensitivity/specificity analysis to predict low mean nutrient density adequacy (MNDA < 50%)a, using individual food groups (1-gram minimum) Country (Age range) Food group (Y/N) Flesh foods Peru (6-11.9 months) Dairy products Vitamin A-rich fruits and vegetables Other fruits and vegetables Animal source foods
Positive Proportion of Sensitivity Specificity predictive value false positives 0.87 0.40 0.36 0.43 0.78 0.51 0.38 0.35 0.70 0.75 0.52 0.18 0.63 0.66 0.41 0.25 0.60 0.81 0.54 0.14
Proportion of Total proportion false negatives misclassified 0.04 0.47 0.06 0.41 0.08 0.26 0.10 0.35 0.11 0.26
37
Dairy products Honduras (6-8.9 months) Eggs Other fruits and vegetables Animal source foods
0.72 0.88 0.59 0.49
0.59 0.48 0.75 0.87
0.28 0.28 0.35 0.45
0.34 0.42 0.20 0.11
0.05 0.02 0.08 0.09
0.39 0.44 0.28 0.20
Flesh foods Ghana (6-11.9 months) Other fruits and vegetables Animal source foods
0.79 0.89 0.76
0.68 0.41 0.79
0.60 0.48 0.69
0.20 0.37 0.13
0.08 0.04 0.09
0.28 0.41 0.22
Dairy products Bangladesh ( 6-11.9 months) Other fruits and vegetables Animal source foods
0.97 0.89 0.93
0.39 0.59 0.50
0.72 0.78 0.75
0.23 0.16 0.19
0.02 0.07 0.04
0.25 0.22 0.23
a
The MNDA averages the percent desired nutrient density, capped at 100, for nine problem nutrients.
Developing & Validating Simple Indicators of Complementary Food Intake & Nutrient Density for Breastfed Children in Developing Countries
Table 28. Sensitivity/specificity analysis to predict low mean nutrient density adequacy (MNDA < 50%)a, using individual food groups (10-gram minimum) Country (Age range) Food groups (Y/N) Dairy products Peru (6-11.9 months) Vitamin A-rich fruits and vegetables Other fruits and vegetables Animal source foods
Positive Proportion of Sensitivity Specificity predictive value false positives 0.80 0.45 0.36 0.40 0.97 0.40 0.38 0.44 0.89 0.38 0.35 0.45 0.74 0.62 0.42 0.28
Proportion of false negatives 0.05 0.01 0.03 0.07
Total proportion misclassified 0.45 0.44 0.48 0.35
Eggs Honduras (6-8.9 months) Other fruits and vegetables Animal source foods
0.97 0.69 0.73
0.36 0.66 0.67
0.25 0.31 0.33
0.52 0.28 0.27
0.01 0.06 0.05
0.53 0.34 0.32
Animal source foods Ghana (6-11.9 months)
0.96
0.45
0.51
0.34
0.02
0.36
Dairy products Bangladesh ( 6-11.9 months) Other fruits and vegetables Animal source foods
0.97 0.97 0.97
0.36 0.50 0.41
0.71 0.76 0.73
0.24 0.19 0.22
0.02 0.02 0.02
0.26 0.21 0.24
a
The MNDA averages the percent desired nutrient density, capped at 100, for nine problem nutrients.
38
Developing & Validating Simple Indicators of Complementary Food Intake & Nutrient Density for Breastfed Children in Developing Countries
Table 29. Sensitivity/specificity analysis of individual food groups (1-gram minimum) to predict better mean nutrient density adequacy (MNDA ≥ 75%)a Country (Age range) Food groups (Y/N) Flesh foods Peru (6-11.9 months) Vitamin A-rich fruits and vegetables Animal source foods
Positive Proportion of Sensitivity Specificity predictive value false positives 0.54 0.73 0.37 0.43 0.85 0.44 0.30 0.44 0.88 0.36 0.29 0.49
Proportion of false negatives 0.04 0.03 0.03
Total proportion misclassified 0.31 0.47 0.34
Eggs Honduras (6-8.9 months)
0.65
0.66
0.39
0.26
0.09
0.34
Flesh foods Ghana (6-11.9 months) Fats/oils Animal source foods Other fruits & vegetables
0.77 0.49 0.89 0.72
0.54 0.78 0.46 0.76
0.19 0.24 0.19 0.30
0.40 0.19 0.47 0.21
0.03 0.06 0.01 0.03
0.43 0.25 0.49 0.24
Eggs Bangladesh (6-11.9 months) Legumes/nuts Other fruits and vegetables Vitamin A-rich fruits and vegetables Animal source foods
0.33 0.50 0.67 0.50 0.67
0.99 0.76 0.73 0.94 0.94
0.67 0.10 0.12 0.30 0.15
0.01 0.22 0.26 0.06 0.20
0.03 0.03 0.02 0.03 0.02
0.04 0.25 0.28 0.09 0.22
39
a
The MNDA averages the percent desired nutrient density, capped at 100, for nine problem nutrients.
Developing & Validating Simple Indicators of Complementary Food Intake & Nutrient Density for Breastfed Children in Developing Countries
Table 30. Sensitivity/specificity analysis of individual food groups (10-gram minimum) to predict better mean nutrient density adequacy (MNDA > 75%)a Country (Age range) Peru (6-11.9 months)
Food groups (Y/N) Vitamin A-rich fruits and vegetables
Sensitivity 0.57
Specificity 0.78
Positive predictive value 0.43
Proportion of false positives 0.17
Proportion of false negatives 0.10
Total proportion misclassified 0.27
Honduras (6-8.9 months)
Eggs Animal source foods
0.54 0.84
0.78 0.48
0.44 0.35
0.17 0.39
0.11 0.04
0.28 0.43
Ghana (6-11.9 months)
Fats/oils Other fruits and vegetables Animal source foods
0.49 0.62 0.60
0.78 0.86 0.75
0.24 0.39 0.25
0.19 0.12 0.22
0.06 0.05 0.05
0.25 0.17 0.27
0.01 0.17 0.04 0.15
0.03 0.02 0.03 0.03
0.04 0.19 0.08 0.17
Eggs 0.33 0.99 0.67 Other fruits and vegetables 0.67 0.82 0.17 Vitamin A-rich fruits and vegetables 0.33 0.96 0.29 Animal source foods 0.50 0.85 0.15 a The MNDA averages the percent desired nutrient density, capped at 100, for nine problem nutrients
Bangladesh (6-11.9 months)
40
Developing & Validating Simple Indicators of Complementary Food Intake & Nutrient Density for Breastfed Children in Developing Countries
3.6 Association between dietary diversity and energy intake Examining associations between dietary diversity indicators and energy intake was not a main objective of our analysis. However, because such associations had been previously reported (Hatloy, Torheim, and Oshaug 2002; Ogle Hung, and Tuyet 2001; Onyango, Koski, and Tucker 1998; Brown et al. 2002), we took the opportunity to assess this relationship using our data sets. We found that dietary diversity (using FGI-8) was significantly associated with energy intake from complementary foods in all four data sets (with correlation coefficients ranging from 0.15 to 0.38), but the association with total energy intake (breast milk plus complementary foods) was significant in only one of the two countries with these data (see Annex 11 for more information). 3.7 Association between frequency of feeding and energy intake The second main objective of our analysis was to assess which cutoff points for frequency of feeding of complementary foods (meals + snacks or meals only) could best differentiate between children with low energy intake and those with adequate energy intake. For Honduras, we could only assess this in relation to energy intake from complementary foods, because energy intake from breast milk was not measured. For Peru and Bangladesh, data are available on energy intake from breast milk, although subsample sizes within frequency of feeding groups are very small for Bangladesh (e.g., the number of infants in either age group fed any given number of times ranges from 1 to 16). For these two sites, we assess frequency of feeding both in relation to energy intake from complementary food, and also in relation to total energy intake.17 Recently issued guidelines for frequency of feeding for breastfed children were described in Section 3.3.1, and Table 8 described the frequency of feeding in the sample data sets. The guidelines were based on theoretical estimates of the number of feedings required to meet energy needs. Figures 17-19 illustrate the actual relationship between feeding frequency and energy intake (kcal) in two of the data sets (Honduras and Peru). For Honduras (Figure 17), results are shown for complementary food energy by number of meals and by number of feeding episodes (meals plus snacks). In Peru, meals and snacks were not distinguished, but data are available for two age groups; Figure 18 shows the relationship between the number of feeding episodes and complementary food energy, while Figure 19 shows the relationship between the number of feeding episodes and total energy intake.
17
As noted earlier, there are no frequency of feeding data for Ghana.
41
Developing & Validating Simple Indicators of Complementary Food Intake & Nutrient Density for Breastfed Children in Developing Countries
Figure 17. Honduras: Mean complementary food energy intake, by number of meals and number of feeding episodes
# of meals
# of feeding episodes
600 502 Mean CF kcals
500 400
345 250
300
190
200
229
144 98
76
100
50
0 0-1
2
3
1
2
3
4
5 6-10
Number of meals or feeding episodes
Figure 18. Peru: Mean complementary food energy intake, by number of feeding episodes 6-8.9 mo 600
9-11.9 mo 564
539
500 Mean CF kcals
413 400
353
300
246
200 100
351 235
260
154
138 91
80
46
0 1
2
3
4
5 6-10
1
2
3
Number of feeding episodes
42
4
5
6 7-13
Developing & Validating Simple Indicators of Complementary Food Intake & Nutrient Density for Breastfed Children in Developing Countries
Figure 19. Peru: Total energy intake, by number of feeding episodes 6-8.9 mo 900
730
700 Mean total kcals
827
782 797
800
600
9-11.9 mo
636 533 540
679 629 651
669
577
532
575
500 400 300 200 100 0 1
2
3
4
5 6 7+ 1 2 3 Number of feeding episodes
4
5
6
7+
Note that the overall energy requirements for these age groups are 615 kcal per day for infants 68.9 months, and 686 kcal for infants 9-11.9 months. With average breast milk intake, the younger infants need 202 kcal from complementary foods, and the older infants need 307 kcal. “Low energy intake” is defined for the purposes of these analyses as intakes lower than these cutoffs. Figure 17 illustrates that the infants in Honduras, on average, reached the expected energy intake from complementary foods (202 kcal) when they had approximately three meals or feeding episodes. In Peru (Figure 18), the younger infants reached the expected energy intake from complementary foods when they had approximately four feeding episodes, and the older infants reached the expected energy intake from complementary foods (307 kcal) when they had approximately five feeding episodes. When considering total energy intake, the younger infants again met energy needs (615 kcal) at four feeding episodes, while the older infants nearly met needs at five feeding episodes (having, on average, 679 kcals as opposed to the requirement of 686 kcals). Table 31 shows correlations between frequency of feeding and energy (kcal), and also indicates whether or not relationships are linear. With the exception of snacks in Bangladesh, feeding frequency was strongly and significantly correlated with energy intake from complementary foods, and in most cases the relationship was linear; for the youngest infants in Peru, Figure 18 illustrates the nonlinear relationship. The correlations of feeding frequency with total energy intake were weaker but still significant, except for the younger infants in Bangladesh.
43
Developing & Validating Simple Indicators of Complementary Food Intake & Nutrient Density for Breastfed Children in Developing Countries
Table 31. Relationships between energy intake and feeding frequency, by country and by age group
Country and age group Peru 6-8.9 months 9-11.9 months Honduras 6-8.9 months Bangladesh 6-8.9 months 9-11.9 months a
Correlation with Correlations with energy intake from total energy complementary foods intake Number of Number of Number of Number of meals snacks feeding episodes feeding episodesa
Test for linear trendb
n/ac
n/a
0.78 0.66
0.51 0.44
CF not linear Linear
0.37
0.44
0.54
n/a
All lineard
0.62 0.64
-0.21 -0.13
0.48 0.57
0.02 0.35
All linear All linear
With the exception of Bangladeshi infants aged 6-8.9 mo, all other correlations were significant (p 10 g of food) for predicting low energy intake from complementary foods (infants 6-8.9 months) 120% 100% 80% 60% 40% 20% 0% 0
1
2
3
4
Number of meals (> 10 g) 'sensitivity'
46
'specificity'
5
7
Developing & Validating Simple Indicators of Complementary Food Intake & Nutrient Density for Breastfed Children in Developing Countries
Figure 24: Bangladesh: Sensitivity and specificity of different cutoff points of number of meals (> 10 g of food) for predicting low energy intake from complementary foods (infants 9-11.9 months) 120% 100% 80% 60% 40% 20% 0% 0
1
2
3
4
5
6
7
8
Number of meals (> 10 g) 'sensitivity'
'specificity'
Figures 25-28 and Table 33 illustrate the findings when considering total energy intake in Peru and Bangladesh. The cutoffs that yield the lowest proportion misclassified are the same as those identified when energy intake from complementary foods was the outcome (“≤ 3” at 6-8.9 and ≤ 4 or 5 at 9-11.9 months). However, at these cutoffs, specificity is lower and the proportion misclassified is higher in both sites and in both age groups when total energy intake is the outcome than when energy intake from complementary foods is the outcome. As mentioned above, cutoffs of “≤ 2” at 6-8.9 months or “≤ 3” at 9-11.9 months have quite low sensitivity.
47
Developing & Validating Simple Indicators of Complementary Food Intake & Nutrient Density for Breastfed Children in Developing Countries
Table 32. Sensitivity/specificity analysis of frequency of feedinga to predict low energy intake from complementary foodsb Age in Cut Country months off Sensitivity Specificity 0.28 0.99 Peru 6-8.9 ≤ 1 ≤2 0.60 0.93 ≤3 0.87 0.80 ≤4 0.96 0.59 ≤5 1.00 0.34 0.13 1.00 9-11.9 ≤ 1 ≤2 0.40 0.98 ≤3 0.59 0.89 ≤4 0.76 0.75 ≤5 0.90 0.49
Positive predictive value 0.98 0.95 0.91 0.84 0.77 1.00 0.97 0.90 0.84 0.76
Proportion of Proportion of false false positives negatives 0.50 0 0.28 0.02 0.09 0.06 0.03 0.20 0 0.24 0.56 0 0.38 0.01 0.27 0.04 0.16 0.09 0.07 0.18
Total proportion misclassified 0.50 0.30 0.15 0.16 0.21 0.56 0.39 0.31 0.25 0.25
6-8.9
≤1 ≤2 ≤3 ≤4 ≤5
0.11 0.38 0.79 0.95 1.00
0.99 0.94 0.60 0.31 0.06
0.96 0.92 0.76 0.69 0.63
0.55 0.39 0.13 0.03 0
0 0.02 0.15 0.26 0.36
0.55 0.41 0.28 0.29 0.36
Bangladesh 6-8.9
≤1 ≤2 ≤3 ≤4 ≤5 ≤1 ≤2 ≤3 ≤4 ≤5
0.44 0.64 0.87 0.95 1.00 0.24 0.40 0.65 0.81 0.92
1.00 0.91 0.55 0.27 0.09 1.00 1.00 1.00 0.75 0.75
1.00 0.96 0.87 0.82 0.80 1.00 1.00 1.00 0.98 0.98
0.44 0.28 0.10 0.04 0.16 0.72 0.57 0.33 0.18 0.08
0 0.02 0.10 0.16 0.04 0 0 0 0.01 0.01
0.44 0.30 0.20 0.20 0.20 0.72 0.57 0.33 0.19 0.09
Honduras
9-11.9
a
In Peru, “frequency” reflects the number of feeding episodes, as observed by enumerators; in Honduras, frequency represents the number of feeding episodes as self-reported by mothers (meals and snacks); in Bangladesh, frequency refers to any feeding episode where the child ate > 10 grams of food; this was defined as a meal. b Low energy intake is defined here as less than 202 kcal from complementary foods for infants 6-8.9 months, and less than 307 kcal for infants 9-11.9 months.
48
Developing & Validating Simple Indicators of Complementary Food Intake & Nutrient Density for Breastfed Children in Developing Countries
Figure 25: Peru: Sensitivity and specificity of number of feeding episodes for predicting low total energy intake (infants 6-8.9 months) 120% 100% 80% 60% 40% 20% 0% 1
2
3
4
5
6
7
8
9
10
Number of feeding episodes 'sensitivity'
'specificity'
Figure 26: Peru: Sensitivity and specificity of number of feeding episodes for predicting low total energy intake (infants 9-11.9 months) 120% 100% 80% 60% 40% 20% 0% 1
2
3
4
5
6
7
8
9
10
Number of feeding episodes 'sensitivity'
49
'specificity'
11
12
13
Developing & Validating Simple Indicators of Complementary Food Intake & Nutrient Density for Breastfed Children in Developing Countries
Figure 27: Bangladesh: Sensitivity and specificity of number of meals (> 10 g food) when predicting low total energy intake (infants 6-8.9 months) 120% 100% 80% 60% 40% 20% 0% 0
1
2
3
4
5
7
Number of meals (> 10 g) 'sensitivity'
'specificity'
Figure 28: Bangladesh: Sensitivity and specificity of number of meals (> 10 g food) for predicting low total energy intake (infants 9-11.9 months) 120% 100% 80% 60% 40% 20% 0% 0
1
2
3
4
5
6
Number of meals (> 10 g) 'sensitivity'
50
'specificity'
7
8
Developing & Validating Simple Indicators of Complementary Food Intake & Nutrient Density for Breastfed Children in Developing Countries
Table 33. Sensitivity/specificity analysis of feeding frequencya to predict with low total energy intakeb Age in Country months Peru 6-8.9
9-11.9
Bangladesh 6-8.9
9-11.9
Positive Total predictive Proportion of Proportion of proportion false positives false negatives misclassified Cutoff Sensitivity Specificity value 0.28 0.95 0.89 0.02 0.44 0.46 ≤1 ≤2 0.58 0.79 0.82 0.08 0.26 0.34 ≤3 0.82 0.58 0.76 0.16 0.11 0.27 ≤4 0.91 0.41 0.71 0.23 0.05 0.28 ≤5 0.97 0.22 0.67 0.30 0.02 0.32 ≤1 0.12 0.97 0.87 0.01 0.54 0.55 ≤2 0.34 0.85 0.79 0.05 0.41 0.46 ≤3 0.51 0.73 0.75 0.11 0.30 0.41 ≤4 0.68 0.59 0.73 0.15 0.20 0.35 ≤5 0.86 0.41 0.70 0.23 0.08 0.31 ≤1 ≤2 ≤3 ≤4 ≤5 ≤1 ≤2 ≤3 ≤4 ≤5
0.36 0.55 0.85 0.91 0.97 0.28 0.40 0.66 0.83 0.93
0.71 0.53 0.35 0.12 0.00 1.00 0.71 0.57 0.43 0.29
0.71 0.69 0.72 0.67 0.65 1.00 0.84 0.85 0.85 0.83
a
0.10 0.16 0.22 0.30 0.34 0 0.06 0.09 0.12 0.15
0.42 0.30 0.10 0.06 0.02 0.57 0.48 0.27 0.13 0.06
0.52 0.46 0.32 0.36 0.36 0.57 0.54 0.36 0.25 0.21
In Peru, “frequency” reflects the number of feeding episodes, as observed by enumerators; in Bangladesh, frequency refers to any feeding episode where the child ate. b Low total energy intake is defined here as less than 615 kcal for infants 6-8.9 months, and less than 686 kcal for infants 9-11.9 months.
51
Developing & Validating Simple Indicators of Complementary Food Intake & Nutrient Density for Breastfed Children in Developing Countries
4. DISCUSSION 4.1 Dietary patterns in the sample populations The diets of infants in the four studies (Peru, Honduras, Ghana, and Bangladesh) reflect a wide range of food intake patterns. The sample population is not necessarily representative of the general population in each country, particularly in Ghana, where the infants received improved complementary foods as part of the intervention study. Nonetheless, the range in dietary patterns is valuable for our purposes, as it allows for exploration of site differences when evaluating potential indicators of dietary adequacy. Breast milk intake was measured in Peru and Bangladesh, but not in Honduras or Ghana. In Peru, mean breast milk intake was slightly lower than the global average, whereas in Bangladesh, it was higher, particularly at 9-11.9 months. It is important to take these differences into account when evaluating the adequacy of energy intake from complementary foods. Frequency of feeding complementary foods was recorded in three of the countries (Peru, Honduras, and Bangladesh). However, meals and snacks were recorded separately in only two sites (Honduras and Bangladesh), and the definition of a “meal” differed between those two sites. Therefore, the discussion will focus on feeding frequency rather than meal frequency. Mean feeding frequency was 3.0-3.6 per day at 6-8.9 months, with 7-24% receiving fewer than the minimum of two feedings per day stipulated for this age range in the Guiding Principles recommendations (PAHO/WHO 2003). At 9-11.9 months, mean feeding frequency was 3.9-4.8 per day, with 18-27% receiving fewer than the minimum of three feedings per day recommended for this age range. Feeding frequency was lower in Bangladesh than in Honduras and Peru for both age groups. Overall, the large majority of the infants in our three samples met the minimum feeding frequency guidelines. The most commonly consumed foods were those categorized into the “grain products, roots and tubers” group, with at least one of these foods being recorded on 92-100% of child-days and consumption of at least 10 g from this food group on 78-99% of child-days. There was great variability across sites in the consumption of the other food groups. Legumes and nuts were consumed commonly in Ghana (67-70%), occasionally in Bangladesh (18-30%), and rarely in Peru (4-5%) and Honduras (14%). By contrast, dairy products were infrequently consumed in Ghana (12-18%) and Bangladesh (10-21%), but commonly consumed in Peru (40-48%) and Honduras (53%). Flesh foods were consumed on 28-58% of child-days in Peru, Honduras, and Ghana, though these percentages dropped to 12-24% when imposing the 10-gram minimum. In Bangladesh, flesh foods were rarely consumed, and none of the infants consumed ≥ 10 g on a given day. Eggs were consumed on 42% of child-days in Honduras, but much less frequently in Peru (11-16%), Ghana (1-3%), and Bangladesh (1-4%). Vitamin A-rich fruits and vegetables were commonly consumed in Peru (60-66%), but infrequently consumed in Honduras (16%), Ghana (5-13%), and Bangladesh (4-12%). Other fruits and vegetables were consumed on half or more of child-days in Peru (49-69%) and Honduras (69%), but on less than half of child-days in Ghana (15-48%) and Bangladesh (27-31%). Fats and oils were consumed occasionally in Peru (13-30%), Honduras (19%) and Ghana (10-44%), but rarely in Bangladesh (4-6%).
52
Developing & Validating Simple Indicators of Complementary Food Intake & Nutrient Density for Breastfed Children in Developing Countries
Because of the wide range in dietary patterns, there was also variability across sites in terms of which food groups were the most important sources of energy and the nine key nutrients. Eggs, for example, were a key source of many nutrients in Honduras, whereas dairy products played a key role in Peru and legumes and nuts contributed a relatively large proportion of the intake of certain nutrients in Ghana and (to a lesser extent) Bangladesh. The dependence on a single food group (grain products, root and tubers) was highest in Bangladesh (76% of energy from complementary foods), followed by Ghana (56%), Peru (51%), and Honduras (33%). Mean dietary diversity (measured using a food group index including eight food groups (FGI-8)) was higher in Peru (3.0-3.7) and Honduras (3.3) than in Ghana (2.6-3.4) and Bangladesh (1.72.1). When considering only food groups from which at least 10 g were consumed (using an eight-food group index with 10-gram minimum restriction for each food group except fats and oils (FGI-8R)), the mean diversity scores were lower: approximately 2-3 in Peru, Honduras, and Ghana and < 2 in Bangladesh. Thus, the diets of most of the children included foods from less than three of the eight food groups on any given day. Nutrient density of the complementary food diet was generally inadequate during the first year of life. The median percentage of desired nutrient density was particularly low for absorbed iron: 5-9% in Bangladesh, 6-10% in Peru, 8% in Honduras, and 13-36% in Ghana. Of the other nutrients, the median percentage of desired nutrient density at 6-11.9 months was low (generally < 60%) in all sites for absorbed zinc and in several sites for absorbed calcium, vitamin A, riboflavin, vitamin B6, and vitamin C. Median nutrient density of folate and thiamin was generally > 60% of desired. As a consequence of the generally low nutrient densities, the mean nutrient density adequacy (MNDA) of the complementary food diet (average of percent desired nutrient density, capped at 100% for the nine nutrients) was low in all four sites, ranging from 35-49% in Bangladesh to 5663% in Peru. MNDA increased with age in the three sites that had more than one age group (i.e., 6-8.9 and 9-11.9 months). 4.2 The relationship between dietary diversity and mean nutrient density adequacy Mean nutrient density adequacy (MNDA) was used in this study as our indicator of diet quality. Dietary diversity was positively associated with MNDA in all four countries, with MNDA generally 50-60% when only two food groups were consumed, increasing to ~60-70% when at least four food groups were consumed (regardless of the quantity consumed). If a 10-gram minimum quantity was imposed, MNDA generally rose to ~70-80% when at least four food groups were consumed. Thus, a larger number of food groups in the child’s diet is associated with greater dietary quality. The correlations between dietary diversity and MNDA were significant in all sites and age groups, ranging from ~0.4 to ~0.7. Imposing a 10-gram minimum in counting the number of foods groups did not generally improve the correlation.
53
Developing & Validating Simple Indicators of Complementary Food Intake & Nutrient Density for Breastfed Children in Developing Countries
Sensitivity/specificity analyses were performed in order to explore the ability of various levels of food group diversity to predict MNDA above and below selected cutoffs. The process of selecting cutoffs for an indicator, like selection of indicators more generally, depends on many factors, including the intended uses of the indicator. Because the MNDA is not a widely used indicator with consensus around the meaning of any particular cutoff, we initially explored relationships using MNDA cutoffs of 50%, 60%, 75%, and 80%. In subsequent discussions with colleagues who convened to discuss our research protocol, there was general consensus that a cutoff of 1.25; see footnote 15) of NDA in at least three of the four sites. Consumption of vitamin A-rich fruits and vegetables was predictive of vitamin A NDA in three sites. Consumption of other fruits and vegetables was predictive of vitamin B6 NDA and of folate NDA in three sites, and of vitamin C NDA in all four sites. Consumption of dairy products was predictive of calcium, riboflavin, and vitamin A NDA in three sites. Consumption of flesh foods was predictive of zinc NDA in three sites. Iron NDA was best predicted by consumption of flesh foods in Peru and Ghana, but by consumption of eggs in Honduras and by consumption of legumes/nuts in Bangladesh (where flesh food and egg consumption was extremely low). These findings may be useful in circumstances in which an indicator for a particular nutrient is desired. If subsequent analyses confirm the above results, indicators that reflect nutrient density of the complementary food diet may be feasible for several key nutrients. In the sensitivity/specificity analyses using individual food groups as predictors of MNDA < 50%, non-consumption of the combined food group for animal source foods and the group for other fruits and vegetables was predictive of low MNDA in all four countries. Non-consumption of dairy products was predictive of low MNDA in three of the four countries. When compared with the results for dietary diversity (using a cutoff of ≤ 2 food groups for FGI-8 and the < 50%
55
Developing & Validating Simple Indicators of Complementary Food Intake & Nutrient Density for Breastfed Children in Developing Countries
MNDA cutoff), the ASF food group yielded similar or better results in three of the four sites (the exception being Peru, in which the dietary diversity indicator gave slightly better results). Sensitivity was 49-93%, specificity was 50-87% and the percentage misclassified was 20-26%, depending on the country. Consumption of the combined food group for animal source foods was predictive of MNDA ≥ 75% in three of the four countries. When compared with the results for dietary diversity (using a cutoff of ≥ 4 food groups for FGI-8 and the ≥ 75% MNDA cutoff), the ASF food group yielded similar results in Peru and Bangladesh, but the dietary diversity indicator performed better in Honduras and Ghana. The percentage misclassified using the animal source foods indicator was generally higher when predicting MNDA ≥ 75% than when predicting MNDA < 50%. Further analyses with other data sets are needed to determine if consumption of animal source foods is as good or better than dietary diversity as an indicator of nutrient density in this age group. A recent validation study in school-age Kenyan children showed that ASF was not a good predictor of the mean probability of inadequate intake of 15 nutrients in a sample where only 14 percent of the children consumed ASF, and amounts consumed were very small (average 17 g) (Ruel et al. 2004). Thus, it will be important to continue to validate indicators of animal source food intake in different age groups and populations with varying consumption patterns. 4.4 The relationship between feeding frequency and energy intake Feeding frequency was strongly correlated with energy intake from complementary foods, with correlation coefficients ranging from ~0.5 in Honduras and Bangladesh to 0.66-0.78 in Peru. In the two sites in which meal frequency was also recorded, the correlation with energy intake from complementary foods was higher for meal frequency than for feeding frequency in Bangladesh, but the opposite was true in Honduras. This suggests that there is no consistent advantage in distinguishing meals from snacks, in terms of predicting energy intake from complementary foods. In the two sites in which total energy intake (including energy from breast milk) was measured (Peru and Bangladesh), the correlations with feeding frequency were lower for total energy intake than for energy intake from complementary foods. This is not surprising, given that there is usually a trade-off between energy intake from breast milk and energy intake from complementary foods. Thus, when evaluating indicators that are predictive of the adequacy of energy intake, it is preferable to use total energy intake as the yardstick, rather than energy intake from complementary foods. Otherwise, the risk of misclassification is high (e.g., concluding that a child with a low feeding frequency had low energy intake, when energy intake was actually adequate because of a relatively high breast milk intake). This is particularly true when the average breast milk intake in a given population deviates from the global average breast milk intake upon which the feeding frequency recommendations are based, which was certainly the case for Bangladesh. However, there may be circumstances when an indicator of energy intake from complementary foods may be of use. The results section presented sensitivity/specificity analyses using both total energy intake and energy intake from complementary foods as the outcome. With the latter option, a cutoff of ≤ 3
56
Developing & Validating Simple Indicators of Complementary Food Intake & Nutrient Density for Breastfed Children in Developing Countries
feedings at 6-8.9 months yielded the best results when predicting low energy intake from complementary foods, with sensitivity of 79-87%, specificity of 55-80%, and 15-28% of cases misclassified. At 9-11.9 months, a cutoff of ≤ 4 feedings yielded the best results, with sensitivity of 75-81%, specificity of 75% and 18-25% misclassified. With the former option (total energy intake as outcome), the results were not as good (as expected, given the lower correlations between feeding frequency and total energy intake than between feeding frequency and energy intake from complementary foods). The cutoffs that yielded the lowest percentage misclassified were the same as those identified when energy intake from complementary foods was the outcome, and sensitivity was comparable, but specificity was lower (35-59%) and the percentage misclassified was higher (25-35%). In other words, when using total energy intake as the outcome, there was an excess of “false positives,” or children identified by the indicator as having low energy intake who, in fact, had adequate energy intake. Whether this is acceptable depends on the purposes and uses of the indicators. For either option (i.e., using total energy intake or complementary food energy intake), indicators using cutoffs based on the Guiding Principles (≤ 2 meals at 6-8.9 months and ≤ 3 meals at 9-11.9 months) had relatively low sensitivity. With total energy intake as the outcome, sensitivity for detecting low total energy intake (i.e., less than the mean energy requirement at that age) was 5158% in Peru and 55-66% in Bangladesh, and the percentage of cases misclassified was relatively high (34-41% in Peru, 36-46% in Bangladesh). In other words, these cutoffs yielded a high proportion of “false negatives,” or children with low energy intakes who were not identified by the indicator. However, it should be noted that the Guiding Principles are based on meal frequency, and that they also allow for optional “additional nutritious snacks offered 1-2 times per day, as desired.” Thus, the cutoffs for feeding frequency (meals plus snacks) that performed best in these analyses (≤ 3 at 6-8.9 months and ≤ 4 at 9-11.9 months) are not necessarily inconsistent with the Guiding Principles. The better results obtained using slightly higher cutoffs may also be related to the fact that children often do not eat to “gastric capacity” at each meal. The recommended meal frequencies in the Guiding Principles are based on eating to gastric capacity, with the caveat stated that “if energy density or amount of food per meal is low…, more frequent meals may be required.” Additional analyses of the relationship between feeding frequency and total energy intake, using other data sets, are necessary before drawing any conclusions about appropriate indicators. The mediocre sensitivity and specificity results (when total energy intake was the outcome) suggest that it may not be valid to attempt to predict adequacy of energy intake based on feeding frequency. 4.5 Strengths and limitations of these analyses This is the first attempt to develop indicators of complementary feeding for breastfed children. Because the analyses are based on data from four different countries representing three major world regions, the results are more likely to be generalizable than if only one or two populations had been examined. The number of child-days of dietary data for children 6-12 months of age was relatively large in three of the four data sets, and two of the data sets included measurements
57
Developing & Validating Simple Indicators of Complementary Food Intake & Nutrient Density for Breastfed Children in Developing Countries
of breast milk intake, which allowed for examination of total energy intake. In addition, the nutrient density calculations were based on complete food composition data (including phytate content) and took into account the estimated bioavailability of iron, zinc, and calcium from each dietary record. Despite these strengths, several limitations of these findings should be kept in mind. First, these analyses were limited to children < 12 months of age. Additional analyses for the age range of 12-24 months are needed. The validation of indicators of nutrient adequacy and energy intake also needs to be done in non-breastfed children 6-24 months of age. Second, there is still uncertainty about recommended nutrient intakes (RNIs) during infancy. The RNI values chosen for calculating the NDA and MNDA scores were based on the latest FAO/WHO or IOM (Dietary Reference Intakes) recommendations (Dewey and Brown 2003), whichever was lower for a given nutrient (for the 6-12 months age interval). The lower value was chosen because most of the RNI values are based on “Adequate Intake” estimates, which may overestimate actual nutrient needs. In the absence of a consistent, harmonized set of RNIs for this age group, this is a reasonable approach, but it should be noted that the results could be different if other RNI values had been used. Third, although the analyses take the bioavailability of iron, zinc, and calcium into account, the calculations are based on the entire day’s diet, not the bioavailability of each individual meal. This introduces some unavoidable random error into the results. 4.6 Conclusions With regard to the two main objectives of these analyses, we conclude the following: 1) Dietary diversity as an indicator of diet quality: a) Diet diversity was associated with diet quality – measured as mean nutrient density adequacy (MNDA) of complementary foods in this study - in all samples, for all age groups: mean MNDA increased with increasing dietary diversity, although the relationship was not always linear. All correlation coefficients between dietary diversity and MNDA were statistically significant, and they ranged from 0.37 to 0.74, depending on the age group and country. b) The dietary diversity indicator that included a 10-g minimum restriction did not result in lower percentages of misclassified children or higher sensitivities or specificities than the simpler indicator based on a 1-g limit (for practical purposes, equivalent to “any or none” for consumption), and therefore the simpler one is recommended. c) Best cutoff points varied depending on the diversity indicator and the cutoff point for MNDA used. Additional analyses in other age groups and contexts are required to confirm whether universal cutoff points can be recommended. d) An indicator based on consumption of animal source foods (yes/no) performed as well as or better than the dietary diversity indicator as a predictor of adequacy of nutrient density
58
Developing & Validating Simple Indicators of Complementary Food Intake & Nutrient Density for Breastfed Children in Developing Countries
of complementary foods (when using the MNDA cutoff point of