study of human disturbance on migratory shorebirds at Crane ... Findings from the research at Cape Poge-Wasque and Crane ...... Ogden, UT: U.S.. Department ...
Indicators and Standards: Developing Definitions of Quality Jerry J. Vaske, Doug Whittaker, Bo Shelby, and Michael J. Manfredo Introduction MANAGERS DO NOT SET OUT with a goal of providing “bad” wildlifeviewing experiences. Similarly, recreationists want “good” experiences. Even members of the general public who seldom visit places where wildlife are present are likely to think high-quality viewing opportunities should be available. Everyone’s goals are thus the same. At issue is what differentiates “good” from “bad” wildlife viewing. Consider the following scenarios: Scenario 1. Mt. Evans (70 miles west of Denver): As the car climbed the mountain road toward the peak of Mt. Evans, the young family of four from the east coast watched in awe as the small herd of bighorn sheep crossed in front of them and grazed quietly along the roadside. The children, armed with their Kodak Instamatics, excitedly snapped pictures of the sheep that would for sure impress their New York friends. A few miles away on a remote mountainside, another photographer equipped with her Nikon had just captured on film the most magnificent bighorn she had ever seen in twentyfive years of observing wildlife. Scenario 2. Brooks River in Katmai National Park: After traveling thousands of miles along the Alaska highway, followed by a floatplane trip to Katmai National Park, and a half-hour hike to the Brooks River Falls viewing platform, the two college students (along with forty other people) were able to watch several large grizzlies fish for sockeye salmon. It was a sight that they would not soon forget. Scenario 3. Rocky Mountain National Park (RMNP): The elderly couple had moved to Colorado after the husband had retired. Their neighbors had told them about the large numbers of elk that could be seen and heard bugling during fall evenings in RMNP. Thinking this might be a fun thing to do, the couple packed a lunch and drove up to the park. Although they had to wait twenty minutes to get through the entrance gate due the line of cars in front of them, they immediately saw one bull and two cows attempt to cross the 143
144 Wildlife Viewing: A Management Handbook
road by dodging the hundred or so cars parked along the shoulder. Over the course of the next few hours, the couple watched intensely as several large bulls warned the young spikes away from their respective harems. Three different scenarios, yet should one experience be considered higher quality than the others? If yes, which experience and why? Does the answer lie in the types of animals (bighorn sheep, grizzly bears, elk) or numbers of animals (few versus many) observed? Do the numbers of other people (none versus many) influence the quality of a viewing opportunity? Is it important to be alone, or can one be alone with others? Are the characteristics of the visitors themselves (young versus old, party size, novice versus experienced viewers) or the characteristics of the visit (chance encounter with wildlife along the roadside or a strenuous hike to a remote viewing area) important considerations when defining quality wildlife viewing? The simple answer is that all of these considerations might be important when defining appropriate conditions for a given type of experience. Unfortunately, such a conclusion does not provide much guidance for wildlife managers who struggle with these issues on a daily basis. A better answer begins with the experience-based planning efforts (see Chapters 5 and 6) that define desired conditions relative to distinct opportunities. In developing these opportunity definitions, it is important to recognize that neither the roadside nor the solitude-oriented wildlife-viewing experience is inherently of higher quality; they are simply different. While the experienced wildlife photographer interested in the “perfect” shot of a bighorn might find roadside picture taking tame and unchallenging, the family who simply wants to see and learn about wildlife does not. Similarly, the family may not be comfortable hiking into unknown remote locations, or viewing animals without the safety provided by their vehicle. In all cases, the issue is defining the conditions that contribute to high quality for that type of opportunity. There are high-quality and low-quality wildlife-viewing experiences in the backcountry, just as there are high-quality and low-quality roadside viewing experiences. Qualitative definitions, however, are not enough. Virtually all recent planning frameworks recommend identifying and establishing quantitative impact indicators and standards (e.g., the Limits of Acceptable Change [LAC], Stankey et al. 1985; Carrying Capacity Assessment Process [C-CAP], Shelby and Heberlein 1986; Visitor Impact Management [VIM], Graefe et al. 1990; Visitor
Chapter 8: Indicators and Standards: Developing Definitions of Quality 145
Experience and Resource Protection [VERP], National Park Service 1997). (See Box 1.) Indicators are the biophysical, social, managerial, or other conditions that managers and visitors care about for a given experience. Standards restate management objectives in quantitative terms and specify the appropriate levels or acceptable limits for the impact indicators (i.e., how much impact is too much for a given indicator). Standards identify conditions that are desirable (e.g., availability of and proximity to animals), as well as the conditions that managers don’t want to exceed (e.g., encounters with other people, wildlife flight reactions, incidents of wildlife-human conflict). (See Box 2.) Despite the prominence of these definitions, relatively little information exists for how good standards should be developed, the criteria for choosing indicator variables for which standards are set, the characteristics of good standards, or the sources of good standards (Whittaker and Shelby 1992; Belnap 1998). This chapter examines each of these issues. Box 1. Common Features of Planning Frameworks Recent planning frameworks (EBM, LAC, C-CAP, VIM, VERP) recommend using indicators and standards through a sequential process. By attending to the following basic steps, wildlife managers have a “game plan” for dealing with human impacts. (1) developing goals that categorize the benefits to be achieved; (2) defining appropriate experience opportunities for specific management objectives; (3) identifying key impact indicators; (4) setting quantitative standards for the selected impact indicators; (5) inventorying and monitoring existing conditions against the standards; and (6) linking management actions to standards when impacts exceed standards. The frameworks provide a model within which standards develop from a process. They are a means to an end, not an end in themselves (Shelby et al. 1992). Setting standards is a key step in these planning frameworks, but it is only a necessary, not sufficient, condition for successful management.
146 Wildlife Viewing: A Management Handbook
Box 2. Why Indicators and Standards Are Important Quantitative indicators and standards serve several important functions: (1) Standards articulate in unambiguous terms what outputs management is trying to provide. Wildlife-viewing experiences are created through the interaction of social, biological, and physical conditions, and the visitors’ expectations and preferences for those conditions (Manfredo et al. 1996a). While managers do not create experiences, they are responsible for creating opportunities for experiences by manipulating social, environmental, and managerial conditions. Quantitative standards help shape those opportunities (i.e., a demand function) and signal whether or not that opportunity is possible given existing conditions (i.e., a supply function). For example, it may not be possible to offer a remote viewing experience in an urban setting. (2) Standards help establish priorities for management, focus on future conditions, and allow managers to be proactive. There is a need to look ahead to what actions might be employed to meet standards, as well as a need to look back at the opportunity definitions management is trying to provide (Vaske et al. 2000). Standards define minimum or optimal conditions and allow managers to note when impacts are approaching defined levels, rather than waiting for problems to occur and then reacting to them (Whittaker and Shelby 1992). From a larger societal perspective, standards help clarify which stakeholders might benefit from a proposed management action. (3) Standards focus attention on specific conditions and problems or benefits. In contrast to traditional wildlife management where the number of visitors (quantity) in an area was emphasized (Vaske et al. 1995), standards return the managers’ attention to the quality of recreation opportunities. By concentrating on the conditions that create experiences, the probable causes of unacceptable impacts as well as the potential benefits to different stakeholders can be identified (Graefe et al. 1990). (4) Indicators and standards provide a base for measuring the rate and magnitude of change and for evaluating the
Chapter 8: Indicators and Standards: Developing Definitions of Quality 147
acceptability of that change. The literature sometimes confuses the concepts of impact change and evaluation (Shelby and Heberlein 1986). The confusion can be illustrated by the term “wildlife harassment.” Harassment refers to both a change (an objective impact—e.g., the birds flew away when the people approached) and a value judgment that the impact exceeds some standard. While most people would agree that management actions are necessary when wildlife harassment occurs, there is less consensus about what constitutes harassment. All human use has some impact. Whether the impact is harassment depends on management objectives (e.g., protect the migratory birds), standards (e.g., migratory birds should never be flushed from their nesting areas because of the presence of humans), expert opinion, and public values. Breaking concepts like harassment or crowding into two parts—the impact component (change in wildlife behavior or experiential change) and the evaluative component (the acceptability of the change)—provides a foundation for thinking about potential problem situations. (5) Standards help the public clearly understand what management is trying to accomplish. The public is often confused by wildlife planning because plans fail to articulate management objectives in specific and explicit terms. Standards reduce this ambiguity and help clarify for the public why planning is important (Vaske et al. 2001). Standards link concrete, on-the-ground conditions with more intangible, qualitative experiences. While experiences are social psychological entities, standards are tangible and specific. With the development of quantitative standards, a more rational discussion of the area’s objectives can occur with the different stakeholders (Whittaker and Shelby 1992). For example, comparing existing conditions against the standards provides a quantitative estimate of whether any experiential changes are within the limits specified by standards, and whether the benefits suggested to accrue to stakeholders have been realized.
148 Wildlife Viewing: A Management Handbook
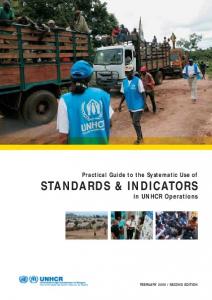
Walrus viewing on Round Island, Alaska. The number of viewable wildlife may be a good biological and wildlife-experience indicator, but it may lack specificity and responsiveness because the number of animals at a location is often influenced by more than just viewing-impact variables and may not respond to some management prescriptions. (Photo by Julie Whittaker)
Criteria for Choosing Indicators Before standards can be developed, appropriate impact indicators must be selected. As used in other sciences (e.g., medicine, agriculture, forestry), indicators are variables that reflect the “health” of something (Ott 1978). Indicators identify what conditions will be monitored (e.g., a person’s blood pressure), while the standards define when those conditions are acceptable or unacceptable. For example, the American Heart Association defines high blood pressure (an indicator) as greater than or equal to 140 mm HG systolic pressure (a standard) or greater than or equal to 90 mm Hg diastolic pressure (a standard). Although any number of variables could be monitored, it is important to identify those indicators that are most linked to issues of concern (Graefe et al. 1990). Thus, while a physician could monitor a stroke victim’s kidney functions, it is more efficient to focus on the individual’s blood pressure. The same logic applies to selecting indicators for wildlife-viewing opportunities. A manager could count the number of vehicles at trailhead parking lots, but past research suggests that monitoring how individuals distribute themselves in time and space throughout the park or refuge, or
Chapter 8: Indicators and Standards: Developing Definitions of Quality 149
how they interact with wildlife and other visitors, are better indicators of recreation-opportunity differences (Shelby and Heberlein 1986; Kuss et al. 1990). It is also important to recognize that there is no single “best” indicator or set of indicators. The choice of indicators and standards depends on the particular impact under consideration and the specific characteristics of the site. In other words, indicators and standards should be specific to the resource and opportunities provided at the site. The key is to select those impact indicators that matter the most for a given experience (Whittaker 1992). Although indicators and standards are site specific, it is possible to identify criteria for choosing indicators. Criteria for Choosing Indicators • Specificity and responsiveness • Sensitivity • Measurability • Integration with management objectives • Impact importance
Specificity and Responsiveness Indicators are only useful if they refer to specific conditions created by human use. As noted above, an overall measure of human density in an area is too vague unless it is linked to the impact conditions associated with that level of use (e.g., encounters with others, loss of solitude-oriented wildlife-viewing opportunities). Specific indicators might focus on the abundance of selected wildlife species, the frequency of wildlife sightings, or wildlife reproductive success. Indicators should reflect impact changes related to impacts caused by human activity rather than those caused by natural events (see Box 3). Unfortunately, disentangling human from natural impacts is complex. Wall and Wright (1977) suggest four factors that limit ecological studies and introduce difficulties in identifying human impacts: (1) there are often no baseline data for comparison to natural conditions; (2) it is difficult to disentangle the roles of humans and nature; (3) there are spatial and temporal discontinuities between cause and effect; and (4) in light of complex ecosystem interactions, it is difficult to isolate individual components. Some impacts take the form of naturally occurring processes that have been speeded up by human interference. Even without human activity, however, severe impacts can occur due to natural causes that render the impacts associated with recreational use insignificant (Schreyer 1976).
150 Wildlife Viewing: A Management Handbook
Box 3. Natural vs. Human Impacts The Trustees of Reservations’ (TTOR) program of biological and social research at three barrier beaches in Massachusetts (Cape Poge Wildlife Refuge and Wasque Reservation, Edgartown; Coskata-Coatue Wildlife Refuge, Nantucket; and Crane Beach, Ipswich) illustrates this distinction between human and natural impacts (see Vaske et al. 1992, for a summary). Between 1986 and 1989, a program for research and protection of rare shorebirds was instituted to assist in the development of TTOR management plans. Biological impacts to nesting piping plovers were measured through direct observation and surveys of predator populations (Rimmer and Deblinger 1990), and a study of human disturbance on migratory shorebirds at Crane Beach (Deblinger et al. 1989). The social research consisted of a series of on-site visitor surveys at each beach (Vaske et al. 1992). Findings from the research at Cape Poge-Wasque and Crane Beach indicated that predators (e.g., skunks, raccoons, and red fox) were causing greater impact than humans. Two types of protection were applied to mitigate these impacts. Small wiremesh fences were installed around nests to protect piping plovers from predators (see Vaske et al. 1994, for a review). Outside of these exclosures, symbolic fencing composed of a single strand of twine was erected to eliminate disturbance by visitors. The Crane Beach study also indicated a natural zoning existed between visitors and the birds. Most boaters were attracted to a portion of the beach which, due to habitat considerations, the birds did not use for either feeding or resting. By designating restricted boat-landing areas outside of the feeding flats and restricting visitors from bird-resting areas in the dunes, managers could ensure that migratory shorebirds could stop over at Crane Beach undisturbed. Moreover, by restricting human use from nesting areas during critical seasons, as opposed to prohibiting use altogether, they could permit the coexistence of both plovers and humans.
Chapter 8: Indicators and Standards: Developing Definitions of Quality 151
Sensitivity The indicator needs to be sensitive to changes in conditions during relatively short time periods; Merigliano (1989) suggests within one year. Such changes may be reflected in biological conditions (e.g., the presence or absence of particular wildlife species) or the human experience (e.g., the frequency of encounters with others at a viewing site). If the indicator only changes after impacts are substantial or never changes, the variable lacks the early warning signs that allow managers to be proactive (Whittaker and Shelby 1992). Visitor satisfaction, for example, is often a major management objective and has been one of the most commonly used indicators of recreation quality (Shelby and Heberlein 1986). If, as traditionally assumed, enjoyment from a recreation experience is inversely correlated with the number of people present, reported satisfaction ratings should provide the basis for setting standards. Studies in a variety of settings, however, have consistently found that recreationists are generally satisfied with their experience independent of the use intensities they experienced (Kuss et al. 1990). A variety of explanations have been offered to account for these findings. For example, to cope with the negative consequences of increasing numbers of visitors (e.g., loss of solitude), some individuals modify their standards for what is acceptable. The end result is a “product shift” or change in the character of the wildlifeviewing experience at a given area (Shelby et al. 1986). Other people who are more sensitive to user densities may stop visiting an area altogether if adjustments, either attitudinal (product shift) or behavioral (e.g., visiting during off peak times, visiting less frequently), fail to bring about the desired experience. With all of these explanations, the current visitors to a heavily used area may be as satisfied as visitors five or ten years ago when use levels were much lower, but are receiving a different type of experience. While overall satisfaction measures are not sensitive to changing use conditions, other measures of recreation quality (e.g., perceived crowding and normative tolerance limits) do show the requisite variation. Perceived crowding, for example, combines the descriptive information (the density or encounter level experienced by the individual) with evaluative information (the individual’s negative evaluation of that density or encounter level). When people evaluate an area as crowded, they have at least implicitly compared the impact they experienced with their perception of a standard. Findings from a comparative analysis of 35 crowding studies and
152 Wildlife Viewing: A Management Handbook
59 different settings and activities indicated that crowding varies across recreational settings and activities, time or season of use, resource availability, accessibility, or convenience, and management strategies designed to limit visitor numbers (Shelby et al. 1989). This variability has allowed recreation researchers and managers to use crowding as a useful indicator.
Measurability Indicators should be easily and reliably measurable in the field. When choosing impact indicators, it is important to specify the level of detail at which selected indicators will be measured and evaluated. The scale of measurement may range from sophisticated indices using quantitative measurements to subjective visual rating schemes. The choice of an appropriate level of measurement will depend on such factors as the availability of funding and personnel, number of sites that must be evaluated, and frequency of measurement and site evaluation. To illustrate, early crowding studies employed multiple-item scales (Shelby et al. 1989). While such scales consider a concept from different points of view and provide the data necessary for estimating reliability coefficients, the mathematical calculations involved in combining survey items into a single scale score sometimes make it difficult to compare results and can render the findings less understandable to managers (Shelby et al. 1989). To overcome these problems, Heberlein and Vaske (1977) developed a single item that asks people to indicate how crowded the area was at the time of their visit (see Box 4). The crowding measure alone is not a perfect substitute for information about use levels, impacts, and evaluative standards that a more complete study can provide. Nevertheless, one can easily collect data with a single crowding item, thereby providing considerable insight about a study site. The single-item crowding measure is easy to interpret and compare across studies, and has been widely used in outdoor-recreation research (Shelby et al. 1989). The consistency of these findings makes the crowding measure a good indicator for addressing social impacts.
Integration with Management Objectives Indicators need to be linked to the management objectives that specify the type of experience to be provided. For example, if a management objective is to provide a low-density backcountry wildlife-viewing experience, the indicators should focus on the number of encounters between visitors, perceptions of crowding, and encounter norm tolerances (see Box 5). Alternatively, if a
Chapter 8: Indicators and Standards: Developing Definitions of Quality 153
Box 4. Crowding Indicator and Standards Most theorists recognize a difference between density and crowding, but even scientists sometimes use the word “crowding” inappropriately when referring to high density. Density is a descriptive term that refers to the number of people per unit area. It is measured by counting the number of people and measuring the space they occupy, and it can be determined objectively. Crowding, on the other hand, is a negative evaluation of density; it involves a value judgment that the specified number is too many. The term perceived crowding is often used to emphasize the subjective or evaluative nature of the concept. Researchers have developed a relatively simple measure of perceived crowding (Heberlein and Vaske 1977). The question asks people to indicate how crowded the area was at the time of their visit. Responses were given on the scale below: 1
2
3
4
5
6
7
8
Not at all
Slightly
Moderately
Extremely
Crowded
Crowded
Crowded
Crowded
In this item, two of the nine scale points label the situation as uncrowded, and the remaining seven points label it as crowded to some degree. The rationale is that people may be reluctant to say an area was crowded because crowding is an undesirable characteristic in a recreation setting. An item that asked “Did you feel crowded?” might lead most people to say “No.” The scale is sensitive enough to pick up even slight degrees of perceived crowding, just as measures of undesirable chemicals (e.g., pollutants or carcinogens) are sensitive to even low levels of these substances. Shelby et al. (1989) developed crowding standards based on this indicator. Their comparative analysis of 59 different settings and activities suggested that when < 35 percent of the visitors feel crowded, density levels in the area were not a problem. For locations where between 50 and 60 percent of visitors felt crowded, the setting was approaching its carrying capacity, and visitors started to experience access and displacement problems. Locations and activities where over 65 percent of the visitors felt crowded were considered over carrying capacity.
9
154 Wildlife Viewing: A Management Handbook
management objective involves roadside viewing opportunities, the indicators might be linked to visitor safety and the probability of seeing wildlife. Useful impact indicators are those that can be treated by management prescriptions. A seemingly eloquent solution to a human-caused impact that cannot be addressed by management actions does not resolve the problem condition. The most useful indicators reflect multiple impact conditions. Because wildlife managers typically have small monitoring budgets, indicators that can be used to represent several different impacts allow managers to focus their attention and efforts while being reasonably assured that the overall quality of a given experience is maintained (Whittaker and Shelby 1992). Crowding or norm tolerances are examples that often reflect several other interaction-type indicators such as encounters with others or competition for space on wildlifeviewing platforms.
Impact Importance Finally, and most importantly, indicators should represent important impacts (Whittaker 1992). For example, if managers, stakeholders and visitors are not concerned about a social impact or researchers are not able to show how an impact negatively influences wildlife populations, developing standards is difficult
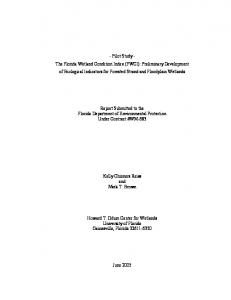
Viewer approaching Dall sheep in Denali National Park, Alaska. Standards such as “80 percent proability of viewing sheep from a distance as close as 50 feet” help managers identify accetpable approach distances and help visitors understand the type of viewing experience they are likely to receive in an area. (Photo by Doug Whittaker)
Chapter 8: Indicators and Standards: Developing Definitions of Quality 155
Box 5. Normative Indicators and Standards The concept of norms provides a theoretical framework for collecting and organizing information about users’ evaluations of conditions and has proven to be sensitive to changing use conditions. As defined by one research tradition, norms are standards that people use to evaluate behavior or the conditions created by behavior as acceptable or unacceptable (see Vaske et al. 1986; Vaske et al. 1993; Shelby et al. 1996; for reviews). Norms thus define what behavior or conditions should be, and can apply to individuals, collective behavior, or management actions designed to constrain collective behavior. This normative approach allows researchers to define social norms, describe a range of acceptable behavior or conditions, explore agreement about the norm, and characterize the type of norm (e.g., no tolerance, single tolerance, or multiple tolerance norms; Whittaker and Shelby 1988). Normative concepts in natural-resource settings were initially applied to encounter impacts in backcountry settings (encounter norms measure tolerances for the number of contacts with other users). The focus on encounters in backcountry worked because encounter levels were generally low, survey respondents could count and remember them, and encounters have important effects on the quality of experiences when solitude is a feature. Most studies showed that encounter norms across these backcountry settings were stable and strongly agreed upon, usually averaging about four encounters per day (Vaske et al. 1986). More recently, norm concepts and methods have been applied to a greater diversity of impacts and settings (Shelby and Vaske 1991; Shelby et al. 1996). Research on encounter norms in higher-density frontcountry settings, for example, has demonstrated more variation in visitors’ tolerances for others as well as lower levels of agreement (Manning et al. 1996; Vaske et al. 1996; Vaske and Donnelly 1998; Donnelly et al. 2000). This led some researchers to examine norms for interaction impacts other than encounters (Shelby et al. 1987; Martinson and Shelby 1992; Whittaker 1992; Whittaker and Shelby 1993). Norms for recreationist proximity, percentage of time within sight of others, incidents of discourteous behavior, competition box continues
156 Wildlife Viewing: A Management Handbook
for specific resources, and waiting times at access areas have all been examined. These alternative interaction impacts are often more salient than encounters in higher-use settings (Basman et al. 1996; Whittaker and Shelby 1996). Taken together, this work suggests that normative data are sensitive to changing use conditions, can facilitate understanding visitors’ evaluations of social and environmental conditions, and have proven helpful to managers. Normative standards may also provide a gauge for estimating benefits to society. If, for example, a management objective is to enhance the flow of dollars into a community’s economy by creating more wildlife-viewing opportunities, one indicator might be the occupancy rate at local motels. The standard in this situation might be 50 percent occupancy.
to justify. If wildlife viewers are more interested in photographing elk than the number of people standing next to them, frequency of seeing elk becomes a better indicator of quality experiences than social-interaction variables. Alternatively, if visitors consider solitude in viewing experiences as more important than number of animals seen, encounters with other visitors becomes an important quality indicator.
Characteristics of Good Standards Specific standards are established for each impact indicator and define an acceptable level of impact for each indicator. Just as impact indicators reflect management goals and objectives, standards are quantifiable value judgments concerning what the agency is attempting to achieve. Based on previous work (Schomaker 1984; Graefe et al. 1990; Whittaker and Shelby 1992; Vande Kamp 1998), the following discusses several important characteristics of good standards. Characteristics of Good Standards • Quantifiable • Time Bounded • Attainable • Output Oriented
Chapter 8: Indicators and Standards: Developing Definitions of Quality 157
Quantifiable Standards restate management objectives in quantitative terms. A good standard unequivocally states the level of acceptable impact. Such statements define how much is acceptable in quantitative terms. For example, a good standard might specify that visitors should be able to watch wildlife with fewer than ten other people present. Specifying that there should only be “a few other people present” is not a good standard because it does not define how many constitutes “a few.”
Time Bounded “Time-boundedness” complements the quantifiable component of a good standard (Whittaker and Shelby 1992). Quantifiable standards only state “how much” is appropriate. Time-bounded standards specify “how much, how often” or “how much by when.” This is especially important for wildlife-viewing impacts because such opportunities often have a seasonal component. Seeing five hundred elk in Rocky Mountain National Park is a common occurrence for a fall evening, but a rare event during the summer when the elk are at higher elevations. Such seasonal differences in viewable wildlife often correlate with fluctuations in visitor numbers. The number of day visitors to RMNP who are explicitly interested in viewing and photographing elk, for example, is substantially greater in the fall than other seasons. Time-bounded standards recognize such variation.
Attainable Management standards need to be reasonably attainable. When standards are too easy, little is accomplished. If they are too difficult to achieve, both managers and visitors are likely to become frustrated. Good objectives and standards should “moderately challenge” the manager and staff (Schomaker 1984). For each important indicator, standards should be set at levels that reflect management’s intent for resource or experiential outcomes in the area (Whittaker and Shelby 1992). While standards that are difficult to attain are generally undesirable, they may still be necessary. A “no litter” standard, for example, may not be attainable, but is still correct. The cynical excuse for not setting appropriate standards is that managing for some conditions is “too hard.” On the other hand, management strategies designed to meet a standard may produce sufficient positive change to warrant the effort. Without standards, it is too easy to do nothing (management by default).
158 Wildlife Viewing: A Management Handbook
Box 6. Different Experiences— Different Indicators and Standards Table 8-1 (see page 160) describes three different elk-viewing experiences: (1) highly specialized backcountry, (2) specialized frontcountry, and (3) general interest roadside elk viewing. For each experience, potential impact indicators and associated standards are presented. Although the scenarios are hypothetical, the indicators represent the types of impact conditions managers must typically address. In addition, while some of the standards are based on considerable previous research (e.g., encounter norms for the backcountry, percent feeling crowded), other standards (e.g., wildlife flight distance) require empirical validation. They are presented here to highlight the link between specific indicators and standards and to demonstrate how the standards might change for different viewing experiences. Five different categories of impact indicators (e.g., development, crowding/norm tolerances) are shown in Table 8-1. Consistent with the principles of Experience-based Management, minimal development, opportunities for solitude, and few regulations characterize a highly specialized backcountry viewing experience. Standards associated with this experience type suggest that there should be no physical barriers separating humans and wildlife at prime viewing areas, and that only small (< 50 sq. feet) temporary viewing blinds constructed from natural-colored fabric would be allowed. To enhance the opportunity for solitude, the standard for encounters with other groups on the trails is < 4 groups per day, with zero other people at one time at prime viewing areas, and < 35 percent of visitors feeling crowded while viewing wildlife. Groups of more than four individuals would be restricted from prime viewing areas and visitors would have the opportunity to roam beyond designated trails. The standard for wildlife flight distance for the backcountry experience was set at < 200 feet to emphasize that wildlife in this scenario have not become habituated to the presence of people. To obtain a closer view necessitates more skill on the part of the viewer, thereby adding to the challenge of the experience. In contrast, the standards for the general interest roadside elk-viewing experience emphasize more development (e.g., barriers to separate humans and wildlife, relatively large [< 600
Chapter 8: Indicators and Standards: Developing Definitions of Quality 159
sq. feet], single-level, permanent blinds, with paved trails, < 8 feet in width). Because the presence of other visitors does not detract from the quality of the experience, the crowding/norm tolerance standards for the general interest experience are not as stringent as those described for the other two experience opportunities. In general, the standards for the specialized frontcountry experience fall in between the standards specified for the other two experiences. It is important to note, however, that the standards do not always vary among different experience types. With all three experiences, for example, managers are likely to have a standard of zero incidents of humans being injured by wildlife and zero incidents of wildlife being disturbed by humans. While the specifics shown in Table 8-1 may vary somewhat depending on resource constraints and the range of experience opportunities available, they do illustrate the linkage between indicators and standards and highlight how standards may change depending on management objectives. Planners and managers should think of Table 1 as a starting point for selecting indicators and setting standards.
Output Oriented Standards should be “output” rather than “input” oriented (Schomaker 1984). This distinction suggests that managers should focus on the conditions to be achieved rather than the way the standard is met. For example, a standard that specifies “150 people per day in a wildlife-viewing area” is not a good standard because it refers to an action (use limits) rather than an acceptable impact. “Less than ten encounters per day” or “no more that 35 percent of the visitors feeling some level of crowding” are better standards because they emphasize the acceptability of different impact conditions.
Sources for Selecting Indicators/Developing Standards Identifying characteristics of good standards is a useful exercise, but it does not provide much information about what standards should be (see Box 6), or where they should come from. Many different management and research efforts have developed or recommended various standards, utilizing a variety of techniques text continues on page 162
< 200 sq. feet
< 50 sq. feet DNA
Size
Design / Shape
0
< 35% Percent of viewers feeling crowded at prime viewing areas
Number of people in sight at one time at prime viewing areas
< 35%
< 50%
< 50 people
< 10 people
< 4 groups per day
Crowding / Norm Tolerances Encounters with other groups on the trails
< 8 feet < 25 people per hour
< 4 feet
< 1 foot
Trail treadway width
Paved
Single level. Square or rectangular design. Multiple access points
< 600 sq. feet
Wood clad equipped with binoculars
Permanent blinds
Barriers installed wherever needed to increase safety
General Interest Roadside Elk Viewing
< 4 groups per hour
Unpaved
Indigenous mulch
Trail surface
Multi-level. Irregular design to enhance privacy between viewers
Wood clad indigenous structure
Natural colored fabric
Material
Temporary or permanent
< 10% areas with barriers
Specialized Frontcountry Elk Viewing
Temporary blinds only
0 Barriers
Highly Specialized Backcountry Elk Viewing
Type
Viewing blinds / hides
Development Physical barriers separating humans and wildlife at prime viewing areas
Impact Indicator
Table 8-1. Hypothetical impact indicators and standards for three elk viewing experience opportunities
160 Wildlife Viewing: A Management Handbook
80% probability of viewing distance within 50 feet < 4 people per party No Yes
Viewing distances to concentrations of elk
Regimentation Group size limits
Ranger escort (No / Yes)
Freedom to roam beyond designated trails (No / Yes)
0 0 < 200 feet
Incidents with injuries to humans
Disturbance to elk
Wildlife flight distance
Human-Wildlife Interaction Number of human-wildlife incidents involving:
Highly Specialized Backcountry Elk Viewing
Impact Indicator
< 50 feet
0
0
No
Yes
< 8 people per party
50% probability of viewing distance within 50 feet
Specialized Frontcountry Elk Viewing
< 50 feet
0
0
No
Yes
< 25 people per party
80% probability of viewing distance within 200 feet
General Interest Roadside Elk Viewing
Chapter 8: Indicators and Standards: Developing Definitions of Quality 161
162 Wildlife Viewing: A Management Handbook
Roadside wildlife viewers near Eielson Visitor Center in Denali National Park, Alaska. Standards for social interaction levels may be a key issue for many viewing opportunities. (Photo by Julie Whittaker)
or sources of information. A review of the most common sources and techniques follows. Sources for Selecting Indicators/Developing Standards • Laws and policy mandates • Manager’s professional judgment • Biological research • Public involvement • Wildlife viewer or population surveys
Laws and Policy Mandates Laws and policy mandates may provide guidelines for selecting specific impact indicators and developing appropriate standards for desirable wildlife-viewing experiences. Most laws, however, are written in broad and often vague language. Directives such as “provide high-quality viewing experiences” or “minimize humanwildlife conflict” lack the specificity necessary to set quantitative standards.
Manager’s Professional Judgment Wildlife managers often develop standards based on their interpretation of laws and policy mandates, their knowledge of the area, their understanding of the recreation opportunities, and their knowledge of conditions that define those opportunities (Whittaker
Chapter 8: Indicators and Standards: Developing Definitions of Quality 163
and Shelby 1992). By imposing their idea of what is appropriate, or even their own personal values, in the decision-making process, managers have implicitly been setting standards for years (Manfredo et al. 1995). An argument can be made, however, for setting standards more explicitly. First, although wildlife-management standards have traditionally been based solely on professional judgment and biological expertise, the increasingly political nature of all natural-resource actions implies that decisions made in isolation are likely to generate considerable public scrutiny (Shepherd 1990; Bright and Manfredo 1993). Second, although it has been assumed that managers understand the acceptability of different resource and experiential conditions, a growing body of empirical evidence suggests considerable differences between the views of managers, visitors, and organized interest groups (Magill 1988; Shelby and Shindler 1990; Gill 1996). By formalizing the process for developing standards and including different points of view, managers gain a greater understanding of their objectives, have more justification for their actions, and are able to be more proactive when potential problem situations arise (Whittaker and Shelby 1992).
Biological Research Science-based wildlife research has been and always will be an important component in developing standards. Wildlife data help clarify what management goals are biologically possible and describe how management actions affect wildlife impacts (Vaske et al. 2001). Biological research by itself, however, cannot predict which alternatives are more or less desirable. For example, scientists are often assumed to be the most appropriate individuals to set standards for acceptable air- and water-pollution levels. When viewed from the larger societal perspective, however, this assumption is invalid. The scientific data describe the consequences of allowing a certain number of pollutants per volume of air or water (e.g., X number of people will die at contamination level Y). Whether this risk level is considered acceptable depends on legislation or other government functions. Even at extremely low levels of water pollution, some people are likely to become ill. It is impossible to set a standard until the acceptability of various risk levels has been identified (Whittaker and Shelby 1992).
Public Involvement Traditional public involvement (e.g., focus groups, public meetings) represent another important strategy for developing standards, especially for social-impact indicators and standards. Wildlife
164 Wildlife Viewing: A Management Handbook
viewers are experts in identifying the characteristics of an experience they find most important. When given the opportunity to communicate their preferences, individuals are typically willing to express their views. Small focus-group meetings with different interest groups, for example, provide a useful starting point for identifying which impacts matter more (Whittaker 1992). Standards can be developed from input provided by participants at larger public meetings, but it is often difficult to focus discussion on specific issues at these meetings. Moreover, individuals who attend public hearings and voice the loudest concerns may not represent all constituents. Although these traditional techniques for soliciting citizen participation provide useful information (Creighton 1980; Bleiker and Bleiker 1990), wildlife managers are increasingly adopting a stakeholder approach to involving public interests (Decker et al. 1996; Chapter 7). Approaches such as transactive planning and comanagement bring diverse interests and stakeholders in direct communication with one another and with agency decision makers to fashion collaborative solutions to wildlife-management challenges. For example, agencies now routinely form citizen task forces, roundtables, advisory councils, and stakeholder planning teams to assist agency personnel with planning tasks and decisions (Beatley et al. 1995; Stout et al. 1996; Curtis and Hauber 1997). When multiple stakeholders have a voice in developing standards, polarized views about acceptable conditions and experiences are likely to emerge. Under these conditions, some negotiation and compromise must occur to develop standards that will be supported by the different publics and interest groups.
Wildlife Viewer or Population Surveys Perhaps the most useful source for developing standards involves user or population surveys. Even the best public-involvement efforts tend to neglect the occasionalist or generalist wildlife viewers or the “general public” in favor of special-interest groups who voice strong opinions on a topic. When surveys adhere to scientific principles (e.g., reliability, validity, representativeness, generalizability), the approach is especially useful for developing standards for social indicators (Manfredo et al. 1996b). Past research highlights a few key issues to consider when using surveys to develop standards (see Shelby and Heberlein 1986; Graefe et al. 1990; for reviews). First, the survey should include a range of impact conditions and gauge which of those impacts are more important (Whittaker 1992). Managers may ultimately establish standards for only a few
Chapter 8: Indicators and Standards: Developing Definitions of Quality 165
key impact indicators. However, because surveys are usually conducted before this decision is made, asking about several different types of impact (e.g., human-interaction impacts, wildlife impacts) allows some flexibility in choosing different indicators. If respondents are asked to consider the relative importance of different impacts, the survey can facilitate the indicator selection process. Second, questions about users’ personal standards should be direct, involve quantitative response categories, and be easy to understand (Whittaker and Shelby 1992). As noted previously, extensive research has failed to demonstrate a consistent relationship between impact variables (e.g., encounters with others) and general evaluative measures (e.g., satisfaction). Most researchers recommend focusing on the evaluation of impacts themselves (Shelby and Heberlein 1986). For example, surveys might ask respondents to report the number of encounters they are willing to have per day or to rate acceptable encounter levels for different experiences. An effective technique used in several studies involves parallel questions about the amount of impact individuals experienced and the amount of impact they are willing to tolerate. Statistical comparisons of such results provide data about where to set standards and allow definition of an impact problem (Vaske et al. 1986; Shelby et al. 1987). Third, when asking about quantitative estimates of acceptable impact levels, respondents should be allowed to specify that “this impact does not matter to me” or that “the impact matters but I cannot give a number” (Roggenbuck et al. 1991; Hall et al. 1996). Some wildlife viewers, especially those with little experience, may not have opinions about acceptable impact levels or may not even be aware of the impact situation (Donnelly et al. 2000). Finally, analysis of survey data should go beyond simple frequencies or measures of central tendency (Vaske et al. 1986; Shelby and Vaske 1991; Shelby et al. 1996). Such measures are useful starting points, but closer examination of the response distributions reported by different groups or the level of group agreement are also important for developing standards.
Summary Points • Indicators and standards represent explicit statements about what conditions managers are trying to provide, and are crux decisions in planning and management processes. Although indicators are site specific, it is important to consider the criteria outlined here when selecting among the range of possible choices (e.g., ensuring that they are sensitive to changing conditions, measurable and
166 Wildlife Viewing: A Management Handbook
integrated with management objectives). Similarly, several general criteria were outlined for developing standards (e.g., that they should be quantifiable, time bounded, attainable, and output oriented). • Knowing the characteristics of good and bad standards represents an initial step in the planning process. At some point, managers need to actually develop standards for the impact indicators of concern. Five techniques were outlined in this chapter: relying on laws and policies, professional judgment, biological research, public involvement, and user or population surveys. Each of these sources of information has advantages and disadvantages; none should be viewed as the “best” single technique and all are probably necessary if management is to be successful. • Although much has been learned over the past few decades, it is important to remember the lessons learned and the gaps in our knowledge. First, while crowding and norms for acceptable behaviors and conditions in backcountry areas are well understood, research in frontcountry areas is still in its infancy. More research exploring the range of norms frontcountry visitors use when making evaluative judgments is clearly needed. Second, because not all stakeholders share the same norms, managers need to adopt a collaborative planning process where all interested parties can express their views on acceptable management actions. Third, the task of managing human-wildlife impacts is not over when a management action has been implemented. Monitoring of key impact indicators is critically important to determine whether the actions are producing the desired outcomes without altering other characteristics of the experience or the resource. • A final word of caution. Selecting key impact indicators and setting standards do not guarantee good management. Standards are only as good as the information upon which they are based. Perfect knowledge of all impacts, however, is impossible. The classic error is failure to set a standard early (because of a lack of information), and assume that no decision has been made. Letting impacts incrementally increase is also a decision—management by default instead of by design. Standards are a key to management by design and lie at the heart of good wildlife management.
Chapter 8: Indicators and Standards: Developing Definitions of Quality 167
Literature Cited Basman, C. M., M. J.Manfredo, S. C. Barro, J. J. Vaske, and A. Watson (1996). “Norm accessibility: An exploratory study of backcountry and frontcountry recreation norms.” Leisure Sciences, 18, 177-91. Beatley, T., T. J. Fries, and D. Braun (1995). “The Balcones Canyonlands conservation plan: A regional multi-species approach.” In D. R. Porter and D. A. Salvesen (Eds.), Collaborative Planning for Wetlands and Wildlife. Washington, DC: Island Press. Belnap, J. (1998). “Choosing indicators of natural resource condition: A case study in Arches National Park, Utah, USA.” Environmental Management, 22, 635-42. Bleiker, H., and A. Bleiker (1990). Citizen Participation Handbook for Public Officials and Others Serving the Public. (5th edition). Monterey, CA: Institute of Participatory Management and Planning. Bright, A. D., and M. J. Manfredo (1993). “An overview of recent advances in persuasion theory and their relevance to natural resource management.” In A. W. Ewert, D. J. Chavez, and A. W. Magill (Eds.), Culture, Conflict and Communication in the Wildland– urban Interface. Boulder, CO: Westview Press. Creighton, J. L. (1980). Public Involvement Manual: Involving the Public in Water and Power Resource Discussions. Washington, DC: United States Department of Interior, Government Printing Office. Curtis, P. D., and J. R. Hauber (1997). “Public involvement in deer management decisions: Consensus versus consent.” Wildlife Society Bulletin, 25, 399-403. Deblinger, R. D., J. J. Vaske, and M. P. Donnelly (1989). “Integrating ecological and social impacts into barrier beach management.” In Proceedings of the Northeast Recreation Research Symposium. (Technical Report NE-132). Burlington, VT: U.S. Department of Agriculture, Forest Service, Northeast Forest Experiment Station. Decker, D. J., C. C. Krueger, .R. A. Baer, B. A. Knuth, and M. E. Richmond (1996). “From clients to stakeholders: a philosophical shift for fish and wildlife management.” Human Dimensions of Wildlife, 1, 70-82. Donnelly, M. P., J. J. Vaske, D. Whittaker, and B. Shelby (2000). “Toward an understanding of norm prevalence: A comparativeanalysis.” Environmental Management, 25, 403-14. Gill, R. B. (1996). “The wildlife professional subculture: The case of the crazy aunt.” Human Dimensions of Wildlife, 1, 60-69. Graefe, A. R., F. R. Kuss, and J. J. Vaske (1990). Visitor Impact Management: The Planning Framework. Washington, DC: National Parks and Conservation Association.
168 Wildlife Viewing: A Management Handbook
Hall, T., B. Shelby, and D. Rolloff (1996). “Effect of varied question format on boaters’ norms.” Leisure Sciences, 18, 193-204. Heberlein, T. A., and J. J. Vaske (1977). Crowding and Visitor Conflict on the Bois Brule River. (Technical Report WIS WRC 77-04). Madison, WI: University of Wisconsin, Water Resources Center. Kuss, F. R., A. R. Graefe, and J. J. Vaske (1990). Recreation Impacts and Carrying Capacity: A Review and Synthesis of Ecological and Social Research. Washington, DC: National Parks and Conservation Association. Magill, A. (1988). “Natural resource professionals: The reluctant public servants.” The Environmental Professional, 10, 295-303. Manfredo, M. J., J. J. Vaske, and D. J. Decker (1995). “Human dimensions of wildlife management: Basic concepts.” In R. L. Knight and K. J. Gutzwiller (Eds.), Wildlife and Recreationists: Coexistence through Management and Research. Washington, DC: Island Press. Manfredo, M. J., B. L. Driver, and M. A. Tarrant (1996a). “Measuring leisure motivation: A meta-analysis of the recreation experience preference scales.” Journal of Leisure Research, 28, 188-213. Manfredo, M. J., J. J. Vaske, and L. Sikorowski (1996b). “Human dimensions of wildlife management.” In A. W. Ewert (Ed), NaturalResource Management: The Human Dimension. New York: Westview Press. Manning, R. E., D. W. Lime, W. A. Freimund, and D. G. Pitt (1996). “Crowding norms at frontcountry sites: A visual approach to setting standards of quality.” Leisure Sciences, 18, 39-59. Martinson, K. S., and B. Shelby (1992). “Encounter and proximity norms for salmon anglers in California and New Zealand.” North American Journal of Fisheries Management, 12, 559-67. Merigliano, L. (1989). “Indicators to monitor the wilderness recreation experience.” In D. Lime (Ed.), Proceedings, Managing America’s Enduring Wilderness Resources Symposium. Minneapolis, MN: U.S. Department of Agriculture, Forest Service. Ott, W. R. (1978). Environmental Indices: Theory and Practice. Ann Arbor, MI: Ann Arbor Science Publications, Inc. Rimmer, D. W., and R. D. Deblinger (1990). “Use of predator exclosures to protect Piping Plover nests.” Journal of Field Ornithology, 53, 263-68. Roggenbuck, J. W., D. R. Williams, S. P. Bange, and D. J. Dean (1991). “River float trip encounter norms: Questioning the use of the social norms concept.” Journal of Leisure Research, 23, 133-53. Schomaker, J. H. (1984). “Writing quantifiable river recreation management objectives.” In J. S. Popadic, D. Butterfield, D. Anderson, and M. R. Popadic (Eds.), Proceedings of the 1984
Chapter 8: Indicators and Standards: Developing Definitions of Quality 169
National River Recreation Symposium. Baton Rouge, LA: University of Louisiana. Schreyer, R. (1976). “Sociological and political factors in carrying capacity decision making.” In Proceedings of the Third Resources Management Conference. Ft. Worth, TX: U.S. Department of the Interior, National Park Service. Shelby, B., and T. A. Heberlein (1986). Carrying Capacity in Recreation Settings. Corvallis, OR: Oregon State University Press. Shelby, B., N. S. Bregenzer, and R. Johnson (1986). “Product shift as a result of increased density: Empirical evidence from a longitudinal study.” Paper presented at the first national symposium on Social Science in Resource Management. Corvallis, OR. Shelby, B., D. Whittaker, R. Speaker, and E. E. Starkey (1987). Social and ecological impacts of recreation use on the Deschutes River Scenic Waterway. Report to the Oregon Legislature. Corvallis, OR: Oregon State University. Shelby, B., J. J. Vaske, and T. A. Heberlein (1989). “Comparative analysis of crowding in multiple locations: Results from fifteen years of research.” Leisure Sciences, 11, 269-91. Shelby, B., and B. Shindler (1990). “Evaluating group norms for ecological impacts at wilderness campsites.” In Proceedings of the Third Symposium on Social Sciences in Resource Management. College Station, TX: Texas A&M University. Shelby, B., and J. J. Vaske (1991). “Using normative data to develop evaluative standards for resource management: A comment on three recent papers.” Journal of Leisure Research, 23, 173-87. Shelby, B., G. Stankey, and B. Shindler (Eds.) (1992). Defining Wilderness Quality: The Role of Standards in Wilderness Management —A Workshop Proceedings. (General Technical Report PNW-GTR305). Portland OR: U.S. Department of Agriculture, Forest Service, Pacific Northwest Research Station. Shelby, B., J. J. Vaske, and M. P. Donnelly (1996). “Norms, standards and natural resources.” Leisure Sciences, 18, 103-23. Shepherd, W. B. (1990). “Seeing the forest for the trees: ‘New perspectives’ in the Forest Service.” Renewable Resources Journal, Summer, 8-11. Stankey, G. H., D. N. Cole, R. C. Lucas, M. E. Petersen, and S. S. Frissell (1985). The Limits of Acceptable Change (LAC) System for Wilderness Planning (Report INT-176). Ogden, UT: U.S. Department of Agriculture, Forest Service, Intermountain Forest and Range Experiment Station. Stout, R. J., D. J. Decker, B. A. Knuth, J. C. Proud, and D. H. Nelson (1996). “Comparison of three public-involvement approaches for stakeholder input into deer management decisions: A case study.” Wildlife Society Bulletin, 24, 312-17.
170 Wildlife Viewing: A Management Handbook
U.S. Department of the Interior, National Park Service (1997). VERP: The Visitor Experience and Resource Protection (VERP) Framework, A Handbook for Planners and Managers. Denver, CO: U.S. Department of the Interior, National Park Service, Denver Service Center. Vande Kamp, M. E. (1998). The Use of Existing Information in the Process of Setting Social Standards for Proposed Wilderness Area of Zion National Park. (Technical Report NPS/CCSOUW/NRTR-98-07, NPS D-127). Seattle, WA: University of Washington. Vaske, J. J., B. Shelby, B., A. R. Graefe, and T. A. Heberlein (1986). “Backcountry encounter norms: Theory, method and empirical evidence.” Journal of Leisure Research, 18, 137-53. Vaske, J. J., R. D. Deblinger, and M. P. Donnelly (1992). “Barrier beach impact management planning: Findings from three locations in Massachusetts.” Canadian Water Resources Association Journal, 17, 278-90. Vaske, J. J., M. P. Donnelly, and B. Shelby (1993). “Establishing management standards: Selected examples of the normative approach.” Environmental Management, 17, 629-43. Vaske, J. J., D. W. Rimmer, and R. D. Deblinger (1994). “The impact of different predator exclosures on Piping Plover nest abandonment.” Journal of Field Ornithology, 65, 201-9. Vaske, J. J., D. J. Decker, and M. J. Manfredo (1995). “Human dimensions of wildlife management: An integrated framework for coexistence.” In R. Knight and K. Gutzwiller (Eds.), Wildlife and Recreationists: Coexistence through Management and Research. Washington, DC: Island Press. Vaske, J. J., M. P. Donnelly, and J. P. Petruzzi (1996). “Country of origin, encounter norms and crowding in a frontcountry setting.” Leisure Sciences, 18, 161-76. Vaske, J. J., and M. P. Donnelly (1998). An Evaluation of the Glacier Gallery in the Columbia Icefield Visitor Centre. Human Dimensions Research Unit Publication 37. Fort Collins, CO:Colorado State University, Human Dimensions in Natural Resources Unit. Vaske, J. J., D. Whittaker, and M. P. Donnelly (2000). “Tourist impact management in North American national parks.” In R. Butler and S. Boyd (Eds.), Tourism and National parks: Issues and Implications. New York: John Wiley and Sons. Vaske, J. J., D. C. Fulton, and M. J. Manfredo (2001). “Human dimensions considerations in wildlife management planning.” In D. Decker, T. Brown, W. F. Siemer (Eds.), Human Dimensions of Wildlife Management in North America. Bethesda, MD: The Wildlife Society.
Chapter 8: Indicators and Standards: Developing Definitions of Quality 171
Wall, G., and C. Wright 1977. The Environmental Impact of Outdoor Recreation. (Publication Series No. 11). Waterloo, Ontario: University of Waterloo, Department of Geography. Whittaker, D. (1992). “Selecting indicators: Which impacts matter more?” In B. Shelby, G. Stankey, and B. Shindler (Eds.), Defining Wilderness Quality: The Role of Standards in Wilderness Management—A Workshop Proceedings. (General Technical Report PNW-GTR-305). Portland, OR: U.S. Department of Agriculture, Forest Service, Pacific Northwest Research Station. Whittaker, D., and B. Shelby (1988). “Types of norms for recreation impacts: Extending the social norms concept.” Journal of Leisure Research, 20, 261-73. Whittaker, D., and B. Shelby (1992). “Developing good standards: Criteria, characteristics and sources.” In B. Shelby, G. Stankey, and B. Shindler (Eds.), Defining Wilderness Quality: The Role of Standards in Wilderness Management—A Workshop Proceedings. (General Technical Report PNW-GTR-305). Portland, OR: U.S. Department of Agriculture, Forest Service, Pacific Northwest Research Station. Whittaker, D., and B. Shelby (1993). Kenai River Carrying Capacity Study: Important Conclusions and Implications. Report to Alaska State Parks. Anchorage, AK: U.S. Department of the Interior, National Park Service, RTCA project report. Whittaker, D., and B. Shelby (1996). “Norms in high-density settings: Results from several Alaskan rivers.” Paper presented at the 6th International Symposium on Society and Resource Management.Pennsylvania State University, May.