Available online at www.sciencedirect.com
ScienceDirect Procedia Engineering 62 (2013) 639 – 647
The 9th Asia-Oceania Symposium on Fire Science and Technology
Developing probabilistic design fires for performance-based fire safety engineering Greg Bakera,*, Colleen Wadea, Michael Spearpointb, Charley Fleischmannb b
a BRANZ Ltd, Moonshine Road, RD1, Porirua 5381, New Zealand University of Canterbury, Creyke Road, Christchurch 8140, New Zealand
Abstract Research is ongoing in New Zealand to develop a new risk-informed fire safety design tool called B-RISK that is a combination of deterministic and probabilistic calculation functionality. The purpose of the tool is so that users can examine the risk and uncertainty that is part of modeling building fires in a rational and systematic fashion. A specific module in B-RISK that generates design fire inputs for iterative B-RISK simulations is described in the paper, and statistical distributions for the fire growth rate and peak heat release rate are developed for a residential-scale building occupancy. The use of this statistical data within B-RISK is also demonstrated and comparisons drawn with new building code compliance provisions that have recently come into effect in New Zealand. © by Elsevier Ltd. Selection and/orScience. peer-review under responsibility of the Asia-Oceania for Fire Science © 2013 2013 Published International Association for Fire Safety Published by Elsevier Ltd. Open access underAssociation CC BY-NC-ND license. and Technology. Selection and peer-review under responsibility of the Asian-Oceania Association of Fire Science and Technology Keywords: Design fires; Performance-based design; Quantitative risk analysis; Heat release rate; Fire growth rate
1. Introduction This paper presents details of a new fire safety engineering computer model that is being developed in New Zealand, called B-RISK. The focus of this present paper is the three options available to B-RISK users for inputting heat release rate (HRR) data to the model, and the comparison of these data to the HRR provisions contained in a newly-published fire safety engineering compliance document in New Zealand. 1.1. New Zealand regulatory regime New Zealand has had a performance-based building regulatory regime since 1991. As part of the legislative framework, the New Zealand Building Code (NZBC) [1] provides the minimum legal requirements for building works. Each clause of the NZBC stipulates, in a descending hierarchy: (a) Objectives (statements of social objectives in terms of health, safety, amenity and sustainability); (b) Functional Requirements (how a building in general terms could be expected to satisfy the relevant Objectives); and (c) Performance Criteria (qualitative or quantitative criteria to meet the Functional Requirements and Objectives) [2]. There are three possible pathways for demonstrating compliance with the NZBC: (a) Acceptable Solutions (deemed-to-satisfy instructions) that are contained in the Compliance Documents (prescriptive methods to meet Performance Criteria); (b) Verification Methods (calculation or test methods) also contained in the Compliance Documents; or (c), Alternative Solutions (alternative methods, other than those contained in Compliance Documents, to meet Performance Criteria) [2].
* Corresponding author. Tel.: +64 4 2371170; fax: +64 4 2371171. E-mail address:
[email protected].
1877-7058 © 2013 International Association for Fire Safety Science. Published by Elsevier Ltd. Open access under CC BY-NC-ND license. Selection and peer-review under responsibility of the Asian-Oceania Association of Fire Science and Technology doi:10.1016/j.proeng.2013.08.109
640
Greg Baker et al. / Procedia Engineering 62 (2013) 639 – 647
Local government agencies (called Building Consent Authorities) have responsibility for administering compliance with the NZBC at a regional level, with the New Zealand Fire Service also having a functional role in the compliance process. The Compliance Document [3] for the fire safety clauses of the NZBC provides a non-mandatory deemed-to-satisfy pathway for demonstrating compliance, but up until 2012 no quantified guidance has been provided for specific performance-based fire safety engineering. In 2006 a project was initiated by the regulator which in part had the objective of providing more specific guidance to practitioners – this culminated in the publication in 2012 of a new Verification Method (VM2) [4] which quantifies design fire scenarios, design fires, pre-evacuation times and acceptance criteria [5]. 1.2. Performance-based fire safety engineering One fundamental aspect of performance-based fire safety engineering is the principle that the occupants of the building have enough time to safely evacuate in the event of fire occurring [5] and this requirement is often assessed by comparing Available Safe Egress Time (ASET) versus Required Safe Egress Time (RSET). In order to demonstrate that the ASET exceeds the RSET, with an appropriate safety factor, widespread usage is made of computer models to simulate both compartment fires (ASET) and occupant escape (RSET). Generally models can be classified as being either deterministic (single values for calculation parameters) or probabilistic (range of possible values for calculation parameters), with the former being the most commonly used in performance-based fire safety engineering. The starting point for any performance-based fire safety engineering calculations are design fire scenarios which include such aspects as the location of the fire, building characteristics, occupant response, fire loads, fire protection systems, etc. [5, 6]. A design fire scenario also includes a design fire (a quantitative description of fire characteristics within the design fire scenario) which is typically defined as a HRR time history, but will also often include species production rates and the effective heat of combustion [4, 5]. A design fire curve can be idealized as five different stages of fire growth: the incipient stage (generally ignored in fire safety engineering design [2]); the growth stage; flashover; the fully developed stage; and the decay stage [5-8]. The detail required for the design fire depends on the issue that is being addressed [5]. The focus of the research described in this paper is the life safety of occupants in residential-scale compartment fires where the main area of interest is therefore the growth stage of the fire. The most common way to characterize the growth stage is as a parabolic t-squared fire [5, 7, 8]. 2. Development of quantitative risk analysis tool The desire to develop a software model for fire safety engineers to be able to systematically address the risk and uncertainty inherent in performance-based fire safety engineering was the catalyst for a collaborative research project, involving BRANZ and the University of Canterbury that was initiated in 2007. The primary objective of the research project was to develop a quantitative risk analysis (QRA) computer tool for fire safety engineers [9, 10]. 2.1. Development of B-RISK fire model The precursor to the B-RISK model was the zone modeling software BRANZFIRE [11]. B-RISK builds on the original deterministic functionality of BRANZFIRE by adding various probabilistic components to create a combined deterministic/probabilistic model that is termed risk-informed. The underlying issue with deterministic models is that they do not deal with the variability in the numerous input parameters that form part of the modeling of fires in buildings. The way that this is addressed in B-RISK is to use Monte Carlo simulation techniques whereby values are randomly sampled from distributions of input parameters, for each of a series of multiple deterministic calculations. B-RISK not only deals with ASET calculations, but also quantifies the reliability of fire protection systems in the building. 2.2. Design fire input options The B-RISK user has three options available for the design fire input to the model, based around combustible items that are located in the compartment of fire origin: (a) multiple iteration design fire generator (DFG) functionality; (b) multiple iteration parametric HRR curves with distributions for input parameters; and (c), single iteration parametric HRR curve with user-specified input parameters.
Greg Baker et al. / Procedia Engineering 62 (2013) 639 – 647
641
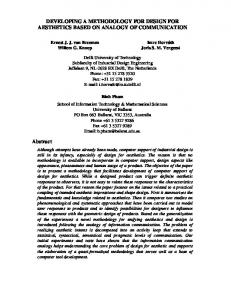
2.2.1. Option A - DFG functionality for multiple iterations The core functionality of the DFG is based on items being randomly selected from an item database and positioned (either randomly or in a pre-determined ‘manually positioned’ location) in the compartment of fire origin. The number of items is governed by the selected fire load density. An initial item is ignited at time t=0 s and the resulting radiation directly from the item and from the underside of the hot upper layer ignites secondary items in accordance with defined ignition criteria. In this fashion, a composite HRR curve is ‘generated’ as subsequent items ignite, and the resulting HRR curve becomes the input for each B-RISK iteration. An underlying assumption in the DFG is that a free-burning HRR is used for items, i.e. no burning rate enhancement, from compartment effects, occurs. Full details of the DFG functionality are provided in Ref. [12]. 2.2.2. Option B - Parametric HRR input for multiple iterations Instead of the DFG option to generate HRR input to B-RISK, the second option involves the user locating a single virtual item in the compartment with various properties. B-RISK constructs an input parametric HRR curve based on a userspecified distribution for t-squared fire growth rate (kW/s2), peak HRR Qpeak (kW), and fire load density (MJ/m2). For each iteration in the simulation, B-RISK samples a value from each input distribution, to generate the parametric HRR curve. The flashover and fully-developed stages of the input parametric HRR curve are constructed in the same manner as the method stipulated in VM2 [4]. Once the growing fire reaches flashover (average upper layer temperature equals or exceeds 500 °C) the HRR is ramped up over a 15 s time-step to a maximum value that is the lesser of: (a) the peak value stipulated in VM2; (b) 1.5 times the ventilation limited HRR (QVL) (where QVL is the HRR at the point in time where, by fire modeling, the predicted HRR first diverges from the input design fire HRR due to insufficient oxygen for complete combustion to occur); or (c) the Qpeak value sampled from the input distribution. The input parametric HRR curve then follows a constant plateau until the fuel is exhausted (determined by the sampled fire load density value) at which point it returns to zero over the nominated time-step duration. 2.2.3. Option C - Parametric HRR input for single iteration The third option that users have for HRR input to B-RISK is the same as for the parametric HRR input multiple iteration case, except that instead of distributions for the input parameters, a single value for each is specified by the user, and therefore only a single B-RISK iteration is conducted. For example, this is the option that users would choose where they wish to follow the requirements of VM2 [4]. A single iteration can also potentially represent a nominated design threshold while this latter case also has the added advantage of saving computational time. An equivalent variant on this is as per option A, but with a single item and a single iteration. 3. Development of probabilistic heat release rate curves In order to produce statistical distributions for both the and Qpeak values, a DFG simulation of 1000 iterations (option A) was conducted. Using the parametric/multiple-iteration option (option B), a second simulation of 1000 iterations was conducted where a parametric HRR curve, based on sampling from the DFG simulation distributions, formed the input for each iteration. 3.1. Modeling scenario for DFG simulation The scenario chosen for the modeling was a residential occupancy based on a series of experiments conducted in Sweden [13] in a 4 × 4 × 2.4 m high compartment with a single opening 2.0 × 1.2 m wide. This selection for the present paper was not made for the purpose of comparing modeling output with experimental results, but simply as being a well-characterized example of residential-scale occupancies. For the DFG simulation, four items were selected for inclusion in the customized database for the scenario, as shown in Fig. 1(a). Fig. 1(b) shows the standard input dataset for, in this case, the television item and consists of Geometry, Chemistry, Target Ignition and Heat Release Rate information. The Geometry dataset consists of the physical dimensions, x and y-coordinates if the Manual Positioning of Items functionality is utilized, the mass of the item based on the HRR and heat of combustion, the maximum number of times that particular item can be sampled for placement in the room, and a weighting for the item’s proximity to the compartment walls. The Chemistry dataset represents relevant data for the item in question – in the case of the four items in this demonstration, all the data are taken from the SFPE Handbook [14]. The Target Ignition data is based on the use of the Flux-Time Product procedure, which is
642
Greg Baker et al. / Procedia Engineering 62 (2013) 639 – 647
described in detail in Ref. [15]. The ignition data for the 3-seater sofa and the armchair are represented by values obtained in Ref. [15]. The ignition data for the television is based on cone calorimeter ignition data from Morgan and Bundy [16] for 3.2 mm thick black ABS containing phosphate flame retardant additives. The ignition data for the bookcase is based on cone calorimeter ignition data for 15 mm thick chipboard [17]. The HRR curve for each item is based on data from the literature – the 3-seater sofa and armchair are based on furniture calorimeter measurements from the CBUF research programme [18], while the data for the television and bookcase come from the SFPE Handbook [19]. For the DFG simulation, HRR curves were approximated as being triangular, with Qpeak, time to Qpeak, tpeak, and effective heat of combustion values defining the triangular shape of the HRR curve. The item first ignited was randomly selected for each iteration.
(a)
(b)
Fig. 1. (a) Items database screen; (b) edit item screen from DFG.
3.2. Fire load density for DFG simulation Having selected and entered appropriate items into the Items Database, the DFG randomly selects items from the database and populates the fire compartment. The number of items is governed by the fire load density (known as fire load energy density (FLED) in New Zealand) that is stipulated by the user, which can either be a fixed value or represented by a distribution. For the DFG simulation described herein, the fire load density specified for this occupancy (residential) in the NZBC compliance document [3] is used (i.e. 400 MJ/m2). No indication of the distribution for the fire load density is provided, but a range of 0-500 MJ/m2 and an 80-percentile design value of 400 MJ/m2 are nominated in Ref. [3]. In the literature [20-23], fire load density data from surveys suggests a distribution that is positively skewed as either a Gumbel [20, 21] or log-normal [22] distribution. In the absence of specific guidance in Ref. [3], the fire load density for the DFG simulation is approximated as a triangular distribution that is positively skewed with a mode of 200 MJ/m2, even though this results (conservatively) in 400 MJ/m2 being approximately the 90-percentile. 3.3. HRR data generated by DFG simulation Figure 2 shows the total 1000 HRR curves generated by the DFG for this demonstration scenario – this took approximately 70 min to run on a standard laptop computer. Of the 1000 iterations, 74 did not reach flashover, while for the
643
Greg Baker et al. / Procedia Engineering 62 (2013) 639 – 647
balance of 926 iterations, the time-to-flashover (the time-step where the average upper layer temperature exceeds 500 °C) ranged from 77 to 635 s. Heat Release Rate [kW]
5000.0 4000.0 3000.0 2000.0 1000.0 0.0
0
500
1500
1000
Time (sec)
Fig. 2. Family of HRR curves from 1000 DFG simulation iterations.
3.4. Analysis of HRR data from DFG simulation For each of the 1000 iterations where flashover occurred, B-RISK automatically calculates an
value as:
Q fo fo
(1)
t 2fo
where fo is the fire growth rate (kW/s2), Qfo is the HRR (kW), and tfo is the time (s), when the flashover criterion, i.e. an average upper layer temperature equaling or exceeding 500 oC, is reached.
80%
Actual DFG data
7
70%
Triangular distribution
6
60%
CDF - triangular
5
50%
CDF - actual DFG data
4
40%
3
30%
2
20%
1
10% 0
0.1
0.2 0.3 Fire growth rate (kW/s2)
0.4
90%
5 4
30% 20% 10% 0% 0
0.1
0.4
0.5
60%
CDF - triangular
50%
CDF - actual DFG data
40% 30%
2
20%
1
10%
0
0% 0.2 0.3 Fire growth rate (kW/s2)
0.4
0.5
Relative frequency
70%
Triangular distribution
100% 90%
5 Cumulative frequency
Relative frequency
80%
Actual DFG data
(c)
0.2 0.3 Fire growth rate (kW/s2)
6
90%
0.1
40%
2
0
100%
0
50%
CDF - actual DFG data
(b)
6
3
60%
CDF - triangular
3
0.5
7
4
70%
Triangular distribution
(a)
5
80%
Actual DFG data
1
0%
0
100%
6
80%
Actual DFG data
4
70%
Triangular distribution
60%
CDF - triangular
3
50%
CDF - actual DFG data
40%
2
30% 20%
1
Cumulative frequency
Relative frequency
8
7
Cumulative frequency
90%
Relative frequency
100%
9
Cumulative frequency
10
10%
0
0% 0
0.1
0.2 0.3 Fire growth rate (kW/s2)
0.4
0.5
(d)
Fig. 3. Fire growth factor distribution fitting: (a) bin = 0.005 kW/s2; (b) bin = 0.01 kW/s2; (c) bin = 0.015 kW/s2; (d) bin = 0.02 kW/s2.
The 74 iterations that did not reach flashover were discounted from the analysis – this was done for the same reasons that the incipient stage of fire growth is ignored in fire safety engineering so as to take a conservative approach. The remaining values were grouped into bands or bins and normalized (i.e., to give unit area beneath the curve), and the method of least
644
Greg Baker et al. / Procedia Engineering 62 (2013) 639 – 647
squares was used to minimize the root-mean square error between the normalized relative frequency of the actual DFG data and the corresponding value for different probability density functions, with the best-fit achieved for a triangular distribution. The bin values were also varied to see what impact this would have on the distribution fitting. Fig. 3 shows the resulting distribution fitting for bin sizes of 0.005, 0.010, 0.015 and 0.020 kW/s2.The best-fit for the triangular distribution occurred for bin = 0.015 kW/s2, shown in Fig. 3(c), with a root-mean square error of 0.6313 and corresponding distribution parameters of; minimum = 0, mode = 0.0326 and maximum = 0.412 kW/s2. The mode is slightly less than a fast t-squared fire, where = 0.0469 kW/s2 however the mode corresponded to the lower 15-percentile value of the triangular distribution. As well as fitting a distribution to the values generated by the DFG, a normal distribution was fitted for the Qpeak values for each of the 926 DFG iterations where flashover occurred, with distribution parameters; mean = 4601.7 and standard deviation = 73.5 (kW). 3.5. Parametric simulation with multiple iterations
1200
2.40
4000
1000
2.00
800
1.60
600
1.20
400
0.80
200
0.40
0
0.00
3000
DFG
2000
Parametric
1000 0 0
200
400
600
800 Time (s)
(a)
1000
1200
1400
0
200
400
600
800 Time (s)
1000
1200
Layer height (m)
5000 Upper layer temp (°C)
HRR (kW)
A second simulation of 1000 iterations was conducted using parametric HRR input, which made use of the statistical data from the DFG simulation. For option B, the Power Law Design Fire Settings feature (Fig. 1(a)) is selected to override the DFG functionality. In Fig. 4(a) the curve labeled DFG is the output HRR curve from the DFG simulation iteration that had the 80-percentile value, while the curve labeled Parametric is the output from the corresponding parametric simulation iteration. In both cases this represents the oxygen-constrained HRR inside the room. Fig. 4(b) illustrates the comparison between the layer height and upper layer temperature between the two simulations for the matching iterations.
Upper layer temp (DFG) Upper layer temp (parametric) Layer height (DFG) Layer height (parametric)
1400
(b)
Fig. 4. 80-percentile outputs for DFG and parametric simulations: (a) HRR curves; (b) upper layer temperature and layer height.
With reference to Fig. 4(a), the DFG and parametric HRR curves have a similar growth phase and a similar fully-develop phase, albeit the plateau for the DFG curve fluctuates somewhat. The notable difference between the two curves is that for the parametric case, a lower fire load density value has been randomly sampled by B-RISK, thus giving a reduced burning duration. In relation to Fig. 4(b), the upper temperature between the two simulations is similar, with the exception of the impact of the burning duration. With regard to the layer height comparison however, there is a noticeable difference, which is as a result of the location of burning objects in the fire compartment – refer to sub-section 4.3 for discussion of this aspect. 4. Discussion 4.1. Design fires
In New Zealand, VM2 [4] has been published for the purpose of carrying out specific fire design of buildings to demonstrate compliance with the NZBC ‘Protection from Fire’ clauses. The document sets out 10 design scenarios that must each be considered and designed for where appropriate. As part of the design scenarios, fire modeling rules, design fire characteristics and other parameters are provided [24]. Utilizing the option C HRR input functionality of B-RISK, a parametric design fire was constructed as described in clause 2.2.2 with a nominated = 0.0469 kW/m2 (labeled VM2 BRISK input in Fig. 5) as the input to a single B-RISK iteration, with the resulting output HRR curve labeled VM2 B-RISK output (ventilation-limited) in Fig. 5. The input and output VM2 HRR curves are compared in Fig. 5 with the original DFG and parametric simulation output HRR curves (from Fig. 4(a)). It should be noted that the species production input values from VM2 are not utilized here, so as to match those used for the DFG and parametric simulation.
Greg Baker et al. / Procedia Engineering 62 (2013) 639 – 647
645
8000 7000
HRR (kW)
6000
DFG output (ventilation-limited)
5000
Parametric output (ventilation-limited)
4000 3000
VM2 B-RISK output (ventilation-limited)
2000
VM2 B-RISK input
1000 0 0
200
400
600
800 Time (s)
1000
1200
1400
Fig. 5. Comparison of B-RISK HRR curves to VM2.
The first difference between the VM2 and DFG/parametric simulation curves are the values. The values for the DFG and parametric simulations are the 80-percentile value, while the VM2 value corresponds to approximately the 15percentile from the triangular distribution generated from the DFG simulation. The second area of difference is the fire load density. For the DFG and parametric simulations, the fire load density is randomly selected from the triangular input distribution described previously. The value for the DFG simulation iteration shown in Fig. 5 is 236 MJ/m2, for the parametric simulation iteration 153 MJ/m2, while for the VM2 simulations it is based on 400 MJ/m2. The other point of note is the comparison between the peak HRR value for VM2 B-RISK input and VM2 B-RISK output curves, where the impact of ventilation-limited conditions is obvious with the latter curve. 4.2. Fire growth rate
It is also of interest to compare the values developed in this paper with corresponding data from the international literature. Holborn et al. [25] have previously analyzed a sample of fire incident data gathered in the Greater London Area, to characterize values. The analysis was based on estimates of the area (i.e. affected floor area) of the fire when first discovered (A1) and when the fire brigade arrived (A2), and associated times intervals between ignition and discovery (t1) and ignition and fire brigade arrival (t2), plus a theoretical HRR per unit area (q") of 250 kW/m2, as represented by Eqn. 2: q A1t12 t14
A2 t22 t24
(2)
A total of 481 dwelling fires were analysed in this fashion and a log-normal distribution fitted, which resulted in an expected value (i.e. average value) E( ) = 0.006 kW/s2 and a 95-percentile value 95 = 0.024 kW/s2. Tanaka [26] also presents Japanese dwelling values where the same analysis methodology was adopted, and a log-normal distribution also fitted, with corresponding values of E( ) = 0.052 kW/s2 and 95 = 0.151 kW/s2, albeit for a slightly different HRR per unit area value of 279 kW/m2. The Japanese data is comparable to the value specified in VM2, but it is difficult however to make a meaningful comparison with the B-RISK data in this regard, as the basis for the values is totally different. While the former is based on floor areas affected by actual fires, the latter in B-RISK is based on experimental HRR rates for individual items of furniture and secondary ignition of adjacent items. The other important aspect to bear in mind is that the DFG data presented herein consciously does not allow for an incipient phase, which would be expected to occur in the actual fire data analyzed – this will almost certainly have a significant impact on values. Young [27] also conducted research where data on values for individual upholstered furniture items were gathered and analyzed, including compartment effects. For the free-burning situation, Young proposed 98-percentile values of: 0.441 kW/s2 (armchair); 0.306 kW/s2 (2-seater sofa); and 0.134 kW/s2 (3-seater sofa). Noting that the DFG and parametric simulations are based on free-burning experimental data, the corresponding 98-percentile value is 0.360 kW/s2, which is in reasonable agreement. Young then analyzed compartment data and adjusted Qpeak by +156%, and tpeak by -39%, which gave values in the range 1-3 kW/s2, which is 20-60 times larger than a fast growth of = 0.0469 kW/m2. 4.3. Location of burning objects in fire compartment
The explanation for the different layer heights between the two simulations relates to the location of burning objects and the corresponding plume entrainment characteristics. For the parametric simulation, the virtual item is located in the centre of the fire compartment, with associated axi-symmetric (maximum) plume entrainment – due to the largest entrainment
646
Greg Baker et al. / Procedia Engineering 62 (2013) 639 – 647
5000
2.4
4000
2.0 1.6
3000
1.2 2000
0.8
1000
0.4 0.0
0 0
25
50
75
100 125 Time (s)
150
175
200
DFG HRR
Layer height (m)
HRR (kW)
volume this results in the lowest interface height, but also the greater cooling effect of the entrainment leads to the longest time-to-flashover (Fig. 6). For the DFG simulation, the items are randomly located in the room but generally closer to compartment walls. The impact of this is a mix of lower entrainment near walls and higher entrainment away from the compartment boundaries, which combines to give a higher interface height but a shorter time-to-flashover [11] (Fig. 6). An additional parametric iteration was conducted to reinforce this aspect, but with the virtual item located against the wall of the enclosure, with the effect of the highest interface height but the shortest time-to-flashover (Fig. 6). The other impact in this latter case was that the ventilation-limited HRR was at a significantly reduced level, i.e. QVL 2.6 vs. 4.4-4.6 MW – this is caused by the lowest amount of entrainment supplying the least amount of combustion oxygen.
Parametric HRR (center) Parametric HRR (wall) DFG layer height Parametric layer height (center) Parametric layer height (wall)
Fig. 6. Impact of fire location on layer height.
5. Conclusions This paper has described the development of a new quantitative risk analysis (QRA) tool called B-RISK that incorporates so-called risk-informed functionality. The tool can be used by fire safety engineering practitioners to conduct available safe egress time (ASET) calculations as part of the life safety analysis for building occupants. B-RISK incorporates iterative Monte Carlo simulation techniques including randomly locating multiple fuel items within a room. A demonstration of the design fire generator (DFG) module of B-RISK was used for a residential-scale building occupancy to construct statistical distributions for both the parabolic fire growth rate ( ) and the peak heat release rate (HRR), Qpeak - a triangular distribution was produced for and a normal distribution for Qpeak. This statistical information was then used to construct a parametric HRR curve as another design fire input option for B-RISK simulations. The simulation outputs were then compared with B-RISK outputs that followed the new design guidance (VM2) that the New Zealand building regulator has recently published, which provides an option for compliance with the ‘Protection from Fire’ clauses of the New Zealand Building Code (NZBC). The design fire guidance provided by VM2 for the residential-scale occupancy was equivalent to values generated by B-RISK, indicating that the DFG is very conservative when approximately the 15-percentile compared to VM2. The values distribution generated by the DFG was also compared to other international research. Growth rates based on fire incident data from England and Japan were lower than the DFG values, most likely due to the DFG data consciously not including an incipient phase. Finally, the impact of the location of the fire in relation to compartment walls was assessed, highlighting the fact that location can potentially have an important bearing on ASET calculations, impacting upon the ability of occupants to escape a building fire. Acknowledgements The authors would like to gratefully acknowledge the funding support from both the Building Research Levy (contract FQ0670) and the New Zealand government research, science and technology funding agency, the Ministry of Science and Innovation (contract BRAX0704), which has made this research project possible. References [1] Building Regulations 1992 (SR 1992/150) Schedule 1, The New Zealand Building Code, New Zealand Government, Wellington: New Zealand, 1992. [2] International Fire Engineering Guidelines – Edition 2005, Australian Building Codes Board, Canberra, Australian Capital Territory, Australia, 2005.
Greg Baker et al. / Procedia Engineering 62 (2013) 639 – 647
647
[3] Compliance Document for New Zealand Building Code Clauses C1, C2, C3, C4 Fire Safety, Amendment 9, Department of Building and Housing, Wellington, New Zealand, 2011. [4] C/VM2 Verification Method: Framework for Fire Safety Design – for New Zealand Building Code Clauses C1-C6 Protection from Fire, Department of Building and Housing, Wellington, New Zealand, 2012. [5] Fleischmann, C. M., 2011. “Is Prescription the Future of Performance-Based Design?” Fire Safety Science - Proceedings of the 10th International Symposium, International Association for Fire Safety Science, pp. 77-94. [6] Hurley, M. J., Rosenbaum, E. R., 2008. Performance-Based Design, in “The SFPE Handbook of Fire Protection Engineering (4th edition)” P.J. Dinenno et al., Editors. National Fire Protection Association, Quincy, MA, USA, pp. 3-440 - 3-445. [7] Karlsson, B., Quintiere, J. G., 2000. Enclosure Fire Dynamics. CRC Press, Boca Raton, FL, USA. [8] Drysdale, D., 1998. An Introduction to Fire Dynamics (2nd edition), John Wiley and Sons, Chichester, UK. [9] Baker, G. B., Wade, C. A., 2009. “Development of Probabilistic Design and Analysis Tools for Performance-Based Fire Safety Engineering,” Proceedings of the 2009 International Symposium on Fire Science and Fire Protection Engineering, China Fire Protection Association, pp. 37-49. [10] Baker, G., Wade, C., Beever, P., 2011. “Fire Design Tools for a Risk-Informed Regulatory Framework,” 6th International Conference on Fire Safety Engineering. Madrid, Spain. [11] Wade, C.: BRANZFIRE Technical Reference Guide, Study Report No. 92 (revised 2004), BRANZ Ltd, Porirua, New Zealand, 2004.. [12] Baker, G., Spearpoint, M., Fleischmann, C., Wade, C., 2012. “Development of a Design Fire Generator for a Risk-Informed Fire Safety Engineering Tool,” Proceedings 9th International Conference on Performance-Based Codes and Fire Safety Design Methods, Society of Fire Protection Engineers. [13] Blomqvist, P., Rosell, L., Simonsen, M., 2004. Emissions from Fires Part II: Simulated Room Fires, Fire Technology 40(1), p. 59. [14] Tewarson, A., 2008. Generation of Heat and Gaseous, Liquid, and Solid Products in Fires, in “The SFPE Handbook of Fire Protection Engineering (4th edition)” P. J. Dinenno et al., Editors. National Fire Protection Association, Quincy, MA, USA, pp. 3-109 - 3-203. [15] Baker, G. B., Spearpoint, M. J., Fleischmann, C. M., Wade, C. A., 2011. Selecting an Ignition Criterion Methodology for Use in a Radiative Fire Spread Submodel, Fire and Materials 35(6), p. 367. [16] Morgan, A. B., Bundy, M., 2007. Cone Calorimeter Analysis of UL-94 V-Rated Plastics, Fire and Materials 31(4), p. 257. [17] Shields, T. J., Silcock, G. W., Murray, J. J., 1993. The Effects of Geometry and Ignition Mode on Ignition Times Using a Cone Calorimeter and ISO Ignitability Apparatus, Fire and Materials 17(1), p. 25. [18] CBUF Fire Safety of Upholstered Furniture – the Final Report on the CBUF Research Programme, B. Sundström, Editor. European Commission, Brussels, Belgium, 1995. [19] Babrauskas, V., 2008. Heat Release Rates, in “The SFPE Handbook of Fire Protection Engineering (4th edition)” P.J. Dinenno et al., Editors. National Fire Protection Association, Quincy, MA, USA, pp. 3-1 - 3-59. [20] Hietaniemi, J., Mikkola, E.: Design Fires for Fire Safety Engineering, VTT Working Papers 139, VTT Technical Research Centre of Finland; Espoo, Finland, 2010. [21] EN 1991-1-2:2002. Eurocode 1: Actions on Structures – Part 1-2: General Actions – Actions on Structures Exposed to Fire, European Committee on Standardization, Brussels, Belgium, 2002. [22] Bwalya, A. C., Lougheed, J. D., Kashef, A., Saber, H. H.: Survey Results of Combustible Contents and Floor Areas in Multi-Family Dwellings. Research Report No. 253, National Research Council Canada, Ottawa, ON, Canada, 2008. [23] Kumar, S., Kameswara Rao, C. V. S., 1995. Fire Load in Residential Buildings, Building and Environment 30(2), p. 299. [24] Saunders, N., Beever, P., Wade, C., Fleischmann, C., Feeney, M., Scott, D., Thorby, P., 2012. “A New Framework for Performance-Based Fire Engineering Design in New Zealand,” 9th International Conference on Performance-Based Codes and Fire Safety Design Methods, Society of Fire Protection Engineers. [25] Holborn, P. G., Nolan, P. F., Golt, J., 2004. An Analysis of Fire Sizes, Fire Growth Rates and Times Between Events Using Data from Fire Investigations, Fire Safety Journal 39(6), p. 481. [26] Tanaka, T., 2011. “Integration of Fire Risk Concept into Performance-Based Evacuation Safety Design of Buildings,” Fire Safety Science – Proceedings of the 10th International Symposium, International Association for Fire Safety Science, pp. 3-21. [27] Young, E. A.: Standardising Design Fires for Residential and Apartment Buildings: Upholstered Furniture Fires, Fire Engineering Research Report, University of Canterbury, Christchurch, New Zealand, 2007.