9th International Conference on Fracture Mechanics of Concrete and Concrete Structures FraMCoS-9 V. Saouma, J. Bolander and E. Landis (Eds)
DOI 10.21012/FC9.007
NUMERICAL STRATEGY FOR DEVELOPING A PROBABILISTIC MODEL FOR REINFORCED CONCRETE STRUCTURES (PMRCS) C. NADER, P. ROSSI, J-L. TAILHAN Institut Français des Sciences et Technologies des Transports, de l’Aménagement et des Réseaux (IFSTTAR), Université Paris-Est e-mail:
[email protected]
Key words: Reinforced concrete structures; Cracking process; Finite Elements; Multi-Scale Modeling Strategy; Probabilistic Approach. Abstract: This paper introduces a new approach to model cracking processes in large reinforced concrete structures, like dams or nuclear power plants. For these types of structures it is unreasonable, due to calculation time, to explicitly model rebars and steel-concrete bonds. To solve this problem, we developed, in the framework of the finite element method, a probabilistic macroscopic cracking model based on a multi-scale simulation strategy: the Probabilistic Model for Reinforced Concrete Structures (PMRCS). The PMRCS’s identification strategy is case-specific because it holds information about the local behaviour, obtained in advance via numerical experimentations. This information is then projected to the macroscopic finite element scale via inverse analysis. The Numerical experimentations are performed using a validated cracking model allowing a fine description of the cracking processes. The method used in the inverse analysis is inspired from regression (supervised learning) algorithms: data on the local scale – the training data coupled with working knowledge of the mechanical problem – would shape the macroscopic model. Although the identification phase can be relatively time-consuming, the structural simulation is as a result, very fast, leading to a sensitive reduction of the overall computational time. A first validation of this multi-scale modeling strategy is performed on a reinforced concrete slab-beam subjected to 3 point bending. We achieved promising results in terms of global behaviour and macro-cracking (mainly crack openings), and an important reduction in calculation time – up to 99% reduction! So we believe this is a promising approach to solve bigger and more complex structures in shorter time. Two modeling strategies were introduced to model the concrete-rebar bond [2, 3, and 4]:
1 INTRODUCTION IFSTTAR, the French Institute of Science and Technology for Transports, Development and Networks, has been developing a probabilistic explicit cracking model since 1987 [1]. The numerical model, originally developed to analyze the cracking of concrete, was more recently enhanced to take into account the presence of rebars and the bond between rebars and concrete (to model real concrete structures).
1. The concrete-rebar bond is represented by interface elements. Their behaviour is described with a simple deterministic damage model with only two parameters, cohesion and slip (i.e. relative tangential displacement between steel and concrete). 2. The notches/indentations are explicitly modeled along the whole length of the
1
C. Nader, P. Rossi and J-L. Tailhan
rebar with a perfect bond between concrete and rebar. Both of these modeling strategies analyze cracking behaviour in reinforced concrete structures by explicitly modeling the rebar and the steel-concrete bonds (whether via interface elements or explicitly modeled notches/indentations). These types of modeling approach are interesting because they yield reliable information about the cracking process, thus used in numerical experimentation in case we lack experimental data. Nevertheless, the modeling level they consider becomes inefficient (due to the unreasonably high computational time) when the structures concerned are large or contain a high percentage of rebars, which is the case for almost all complex real-life structures such as dams or nuclear power plants. Nowadays, there exist other techniques to model cracking in large structures [5 to 8] but the calculations remain relatively expensive time wise. To propose a more relevant solution a Probabilistic macroscopic Model for Reinforced Concrete Structures (PMRCS) is proposed. It implicitly integrates the rebar and the steel-concrete bonds and yields accurate macroscopic information about macrocracking (so, it is a change of modeling level compared with the probabilistic explicit cracking model evocated above). This macro model’s design and validation is the main subject of this paper. The strategy of development of the PMRCS rather than its theoretical formulation is emphasized – the central factor here is the ability to commute the approach to a wide range of structural problems/cases.
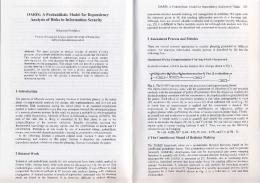
conditions of the structural problem. We can think of the PMRCS in terms of its two interconnected components: the macro element itself defined by its dimensions and configuration, and the probabilistic model describing its behaviour. A strong assumption is therefore made, which states that the macro element behaves only in tension in the considered direction(s) of reinforcement(s). To be more precise, it is assumed that only one macrocrack appears in each macro element, this macrocrack being oriented prependiculary to the rebar direction. The Multi-Scale Modeling Strategy, presented in figure 1, can be summarized as follow: First step An elastic simulation of the given structure is performed taking into account the boundary conditions of our problem. 2D or 3D (as required) ‘volume elements’ are used without describing any reinforcements. This step is necessary to determine the coarsest finite element mesh that would still yield the correct kinematic field. This will set an upper limit on the size of the macro elements. Subsequently, the fineness of the mesh and the optimal macro elements (optimal in terms of geometry, size, and ubiquity) are chosen. Second step One or multiple macro elements are now defined – distinct either by their dimensions and/or their composition (position, number, and type of rebars). Different tie-beam numerical tests, for each macro element, in every direction of reinforcements (numerical experimentation phase) are then defined. The length of these tie-beam specimens has to be sufficient to get a representative cracking pattern (it means a cracking pattern which takes into account in a correct way the number of macrocracks per length of tie-beam). Third step Numerical simulations on the tie-beams are run to get information about cracking and global responses. To that end, we use validated local models: a probabilistic explicit cracking
2 STRATEGY FOR DEVELOPING A PMRCS The strategy has been broken down into distinct steps that map different scales of modeling. The model depends on the dimensions and the configuration of the macro element (total section and number of rebars taken into account in each macro element, for example) which depend on the boundary 2
C. Nader, P. Rossi and J-L. Tailhan
model for concrete and an interface element model for steel-concrete bond (section 3). Fourth step Results from the tie-beam simulations (along with some working knowledge) will help us deduce, by inverse analysis, the cracking behaviour of the different macro elements. The mechanical macroscopic model and the method used to determine the parameters of the constitutive law are detailed in section 4.
The heterogeneity of concrete is due to its composition. The local mechanical characteristics (Young’s modulus Eb, tensile strength ft, shear strength τc) are randomly distributed. The scale effects are a consequence of the heterogeneity of the material. The mechanical response directly depends on the volume of material that is stressed. The cracking process is controlled by defects in the cement paste, by the heterogeneity of the material, and by the development of tensile stress gradients.
The following points specify how the numerical model accounts for these physical evidences:
Figure 1: Illustration of the Multi-Scale Modelling Strategy.
3. THE PROBABILISTIC EXPLICIT CRACKING MODEL AND THE STEELCONCRETE BOND MODEL In this section, the backbone of the proposed multi-scale modeling strategy is put forth: the probabilistic explicit cracking model, and the steel-concrete bond model. 3.1. Probabilistic explicit cracking model
The model was first developed at IFSTTAR (formerly LCPC) by Rossi [1, 9] and recently improved by Tailhan et al. [10]. It describes the behaviour of concrete via its two major characteristics: heterogeneity, and sensitivity to scale effects [11]. The physical basis of the model (presented in detail in [1, 9]) can be summarized as follow:
3
The model is developed in the framework of the finite element method, each element representing a given volume of (heterogeneous) material. The tensile strength is distributed randomly on all elements of the mesh using a probability distribution function whose characteristics depend on the ratio: volume of the finite element/volume of the largest aggregate, and the compressive strength (as a good indicator of the quality of the cement paste). The volume of the finite element depends on the mesh, while the volume of the largest aggregate is a property of the concrete [1, 9, and 10]. The shear strength is also distributed randomly on all elements using a distribution function: (1) its mean value is independent of the mesh size and is assumed equal to the half of the average compressive strength of the concrete and (2) its deviation depends on the element’s size, and is the same (for elements of same size) as that of the tensile strength.
C. Nader, P. Rossi and J-L. Tailhan
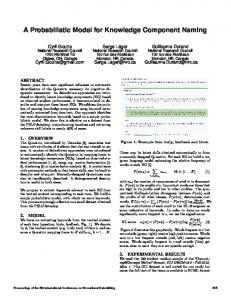
The cracks are explicitly represented by interface elements of zero thickness. These elements connect volume elements representing un-cracked plain concrete. Failure criteria of Rankin in tension and Tresca in shear are used. As far as tensile or shear stresses remain lower than their critical values, the interface element ensures the continuity of displacements between the nodes of the two neighboring volume elements. The material cell gathering these two volume elements and the interface element remains therefore elastic. Once one of the preceding failure criteria is reached, the interface element opens and an elementary crack is created. Its tensile and shear strengths as well as its normal and tangential stiffness values become equal to zero [1, 9, 10]. In case of crack re-closure, the interface element recovers its normal stiffness and follows a classical Coulomb’s law [12].
thus ensuring the transfer of stresses between steel and concrete. Represent the macroscopic mechanical effect of the rebar at the ribs – which is not explicitly represented in the mesh. Simulate a local failure between steel and concrete along the rebar resulting from a loss of the local adhesion due to shear cracking. Simulate the local friction between the concrete and the steel after the interface failure.
N
V
Mechanical properties = random variables (Weibull distribution)
Elastic
Criteria Tension: Rankine Shear: Tresca Friction: Coulomb
Figure 2: Probabilistic concrete cracking model
Note that in this model, the creation and the propagation of a crack is the result of the creation of elementary failure planes that randomly appear and can coalesce to form the macroscopic cracks (Figure 2).
The model is implemented in 2D and 3D [2, 3]. It models the concrete-rebar bond as a material zone that progressively degrades in shear (the tensile failure is neglected). Prior to total failure, stresses are continuously transmitted through the interface. The interface model is based on a damage model that maintains a constant level of stress when the critical shear has been reached (Figure 3.a). When the relative tangential displacement between the concrete and the rebar exceeds a critical value, the interface element is declared broken [13]. After failure, a Mohr-Coulomb type of friction behaviour is maintained. The interface model is deterministic. This is a valid approximation because the cracking process around the rebar is governed by the presence of the ribs (rather than the heterogeneity of concrete) [13]. In 3D, the constitutive relations of the model are summarized as:
3.2. Concrete-rebar bond model A simple and robust model has been developed and validated at IFSTTAR [2, 3, and 4]. It takes into account the nonlinear behaviour of the concrete-rebar bond in the frame of damage mechanics. It can represent physical phenomena such as interface sliding, cracks appearance and degradation process. The concrete-rebar bond is modeled as interface elements. Their role is to:
Ensure the displacement continuity between the concrete and the steel before the slip of the interface and before the cracking of the concrete,
4
C. Nader, P. Rossi and J-L. Tailhan 𝜎𝑛 𝑘𝑛 [ 𝜏1 ] = (1 − 𝑑) [ 0 𝜏2 0
0 𝑘𝑡1 0
𝛿𝑛 0 0 ] . [𝛿𝑡1 ] 𝑘𝑡2 𝛿𝑡2
angles. A value of 30◦ is selected for both 𝜑 and 𝜓 (value from Rossi [12]). Only the values of the maximum shear stress, 𝐶, and of the tangential critical relative displacement, 𝛿𝑡𝑐𝑟𝑖 , have to be determined. This is done by numerical inverse analysis.
(1)
Where 𝜎𝑛 , 𝜏1 , and 𝜏2 , are the normal and tangential stresses in two directions, 𝑑 is the damage parameter, 𝛿𝑛 , 𝛿𝑡1 and 𝛿𝑡2 are respectively the normal and tangential displacements, and 𝐾𝑛 , 𝐾𝑡1 , 𝐾𝑡2 the normal and tangential stiffness values of the contact element. The values of 𝐾𝑛 , 𝐾𝑡1 , 𝐾𝑡2 can be found in the recommendation of some commercial finite element codes (for example, CESAR [14] or CODE ASTER [15]). The damage evolution (Figure 3.b) is given by: 𝑑=0 𝑑 = 1−
𝛿𝑡𝑒 |𝛿𝑡 |
Figure 3:.a) Steel-concrete interface behaviour law b) Damage evolution
; |𝛿𝑡 | < 𝛿𝑡𝑒 ; 𝛿𝑡𝑒 < |𝛿𝑡 | < 𝛿𝑡𝑐𝑟𝑖
(2)
; |𝛿𝑡 | > 𝛿𝑡𝑐𝑟𝑖 { 𝑑=1 Where, 𝛿𝑡𝑒 = 𝑓(𝐶, 𝐾𝑡1 , 𝐾𝑡2 ) is the threshold of tangential elastic displacement (𝐶 is the cohesion parameter), 𝛿𝑡𝑐𝑟𝑖 is the critical tangential displacement (𝛿𝑡𝑐𝑟𝑖 > 𝛿𝑡𝑒 ) and |𝛿𝑡 | = 𝑓(𝜏, 𝑘𝑡1 , 𝑘𝑡2 ) is the variable which drives damage evolution. The evolution of the damage variable (a state variable) has to verify some conditions to satisfy the second law of thermodynamics: {
𝑑̇ ≥ 0 𝑑 = max(𝑑0 , 𝑑)
Figure 4:. Mohr-Coulomb friction after failure of the steel-concrete interface
4. THE PROBABILISTIC CRACKING MODEL FOR FINITE ELEMENTS OF REINFORCED CONCRETE
(3) The model is required to have the following features:
Where 𝑑0 is the initial damage state, and 𝑑 is the actual damage state. After failure, we switch to a friction behaviour (Figure 4) with an associated flow rule. The yield criterion is given by: 𝑓(𝝈, 𝜑) = |𝜏| − 𝜎𝑛 tan 𝜑
(4)
And the associated flow rule is given by: 𝜕𝑔 𝜹̇𝑝 = 𝜆 𝜕𝝈 (5) 𝑔(𝝈, 𝜓) = |𝜏| − 𝜎𝑛 tan 𝜓 𝜓=𝜑 Where 𝜹̇𝑝 is the evolution of the plastic relative displacement, 𝜆 the plastic multiplier, 𝑔(𝝈, 𝜓) the associated function, 𝜑 and 𝜓 are respectively the friction and the dilatancy
The ability to get information on macro-cracks spacing and openings in a large reinforced concrete structure. A probabilistic modeling to allow for a statistical analysis of the structural behaviour via a Monte Carlo approach (reliability analysis of the structure).
4.1. Presentation of the model To achieve our objectives, and still save on calculation time, the model has to be simple. Therefore, some strong assumptions are made:
5
C. Nader, P. Rossi and J-L. Tailhan
Any arbitrary macro element is a volume element that represents both a given volume of concrete and steel rebars, part of the structural reinforcement. For such an element, a fixed orthogonal reference frame is locally placed with its direction 1 as the one of the principal reinforcement. Next, in agreement with homogenization techniques, we consider that the element consists of a smeared orthotropic material. Thus the elastic 2D-plane stress constitutive law is:
At the global structural scale, our scale of interest, the concrete part of the macro-element breaks in a brittle way. Therefore, the composite element is assumed to have an elastic perfectly brittle behaviour. Only failure criteria in tension and in shear are considered (the criterion for shear is only relevant when compressive stress fields are involved). These criteria are applied at the centre of gravity of the macroelement. Once the matrix is broken, the stresses in the element plunge to zero – a reasonable approximation at the scale of structural elements. Then, immediately after, the rebars intervene mechanically. This requires a new evaluation of the coefficients of the stiffness matrix of the macro-element – in the direction parallel to the rebars. The new values of these coefficients are associated with the stiffness of the rebars and the phenomenon of tension stiffening. The PMRCS will account for the plastic behaviour of the rebars in the studied direction: when the linear elastic strain limit of the steel is reached at the center of gravity of the macro-element, its behaviour would be represented by an elasto-perfectlyplastic model. We chose, for simplicity, to simulate this behaviour with a damage model (we disregard permanent deformations due to the yield of the rebars). This simplification is only possible if monotonically increasing loadings are involved, which the case in this work is.
𝝈 = 𝑯. 𝜺 𝜎11 𝐸1 𝜗21 𝐸2 0 0 𝜀11 1 𝜎22 𝜗12 𝐸1 𝐸2 0 0 𝜀22 [ 0 ]= [ ][ ] 0 0 0 0 𝜀33 1 − 𝜗12 . 𝜗21 𝜎12 0 0 0 𝐺 2𝜀12
(6.1)
(6.2)
Assumptions are made concerning the elastic coefficients of the orthotropic stiffness matrix 𝑯: 𝑬𝟏 : Young modulus in the direction of the rebars; calculated as a result of the average Young modulus of both the concrete and the rebars according to the rule of mixtures 𝑬𝟐 : Young modulus of the concrete (an approximation) 𝝑𝟏𝟐 : Poisson’s ratio of the concrete 𝑬 𝝑𝟐𝟏 = 𝑬𝟐 𝝑𝟏𝟐 (to ensure that 𝑯 is 𝟏
symmetric) 𝑮 : Shear modulus; takes into consideration the presence of the rebars in the volume of the element with respect to the rule of mixtures
The elastic behaviour of this composite material is defined fairly intuitively, but the difficulty lies in the cracking mode of the element, and its behaviour thereafter. According to the preceding assumptions, failure criteria are applied in tension (Rankine) or in shear (Tresca) when the corresponding strengths are reached. As a consequence, a sudden drop of the stresses to zero is permitted. From this state of stress and strain, stresses are immediately picked up by a reduced elastic matrix representing the
The validation example is treated in 2Dplane stress conditions (see section 5 and Figure 5), the mathematical relations related to the mechanical aspects of the model (summarized below) are proposed here in the same framework. Note also that they can be easily generalized to 3D
6
C. Nader, P. Rossi and J-L. Tailhan
remaining contribution of the steel bars with some residual action from the surrounding concrete (in the form of friction). Some terms of the initial elastic constitutive relation (6.1 and 6.2) are then affected by a reduction coefficient 𝛽(that could also be viewed as the result of an initial anisotropic constant damage): 𝝈 = 𝑯′ . 𝜺 ′ ′ 𝜎11 𝛽𝐸1 𝜗21 𝛽𝐸2 0 0 𝜀11 ′ 1 𝜎22 𝜀 0 0 𝐸2 𝜗 𝛽𝐸 [ 0 ]= [ 12 1 ] 22 ′ 1 − 𝜗12 . 𝜗21 0 0 0 𝜀33 0 ′ 𝜎12 0 0 𝐺 [2𝜀12 0 ]
With:
𝜺′ = 𝜺 − 𝜺𝟎
𝜎𝑝 𝐸1′ (11) 𝜎𝑝 𝜎𝑝 𝐷(𝜀̃) = 1 − ′ ; 𝜀̃ > 𝜀01 + ′ 𝐸1 𝜀̃ 𝐸1 { 𝐷(𝜀̃) = 0
Where 𝜀̃ = 〈𝜀1 〉+ (〈∙〉+ is the positive part of (∙)). At this stage, the model still carries two unknown parameters: the tensile strength of the uncracked element 𝜎𝑡𝑐𝑟𝑖 , and the residual stiffness in direction 1, 𝐸1′ = 𝛽𝐸1 (stiffness of the elastic steel bars in this direction, plus friction with the cracked concrete matrix). Lognormal distribution functions are assigned to both 𝜎𝑡𝑐𝑟𝑖 and 𝐸1′ . Remark: the mean shear strength is assumed to be equal to the half of the compressive strength, and its standard deviation is equal to that of the tensile strength.
(7.1)
(7.2)
(8)
Where 𝜺𝟎 is the state of strain after the sudden drop of stresses (i.e. after the brittle failure of the concrete). This behaviour is held until the (predetermined) yield limit of the steel is reached. Again, according to the proposed assumptions a simple damage model is chosen to represent the plastic behaviour of the reinforcements. The constitutive relations are then: 𝝈 = (1 − 𝐷)𝑯′ . 𝜺′
The resulting force-displacement curve from the numerical experimentations on the tie-beam tests are then fitted to that of the equivalent macro model test. The best fit will determine the different parameters for both distribution functions. Consequently, this classifies the methodology as an optimization problem. The optimization tool most suited for our problem is the Response Surface Method (RSM) [16]. RSM is a way to explore the effect of operating conditions (the factors/parameters) on the response variable, y. In our case, y is the surface area of the complex polygon outlined by the real force/displacement curve and the fitted curve. To calculate the surface area of this highly irregular and self-intersecting polygon we used the Bentley–Ottmann algorithm [17]. As we map out the unknown response surface of y, we move our process as close as possible towards an optimum (i.e. the minimum value of the considered area), taking into account any constraints. At the end of this step, the parameters that minimize y are the ones we input into the model for the final calculations.
(9)
Where 𝐷 is a damage variable. Similarly to the damage model for the concrete-rebar behaviour (section 3.2), 𝐷 is considered a state variable, thus its evolution has to verify the following conditions: 𝐷̇ ≥ 0 { 𝐷 = max(𝐷0 , 𝐷)
; 𝜀̃ ≤ 𝜀01 +
(10)
Where 𝐷0 is the initial damage state, and 𝐷 is the actual damage state. The initial damage threshold 𝐷0 is reached when the maximum axial stress (in the direction of the reinforcement) is equal to the yielding stress 𝜎 𝑝 . The damage evolution is also given by the following relations:
7
C. Nader, P. Rossi and J-L. Tailhan
Figure 5 summarizes the model’s pre and post cracking behaviour in the direction of the rebars.
To summarize, the parameters involved in the process of creating the complete mechanical model for the PMRCS (for a given concrete and reinforcements) are:
The parameters of the probabilistic explicit cracking model of the concrete (section 3.1). The values of 𝐶 and 𝛿𝑡𝑐𝑟𝑖 for the interface elements (steel-concrete bond model) which allows us to perform the correct numerical simulations of the tie-beam test(s). The results from these numerical simulations constitute the starting point for fitting the values of the parameters of the macro-element (section 3.2). The elastic orthotropic stiffness matrix of the macro-element, assembled with the help of some intuitive hypotheses and the rule of mixtures (section 4.1). The parameters of the lognormal distribution function for the tensile strength of the chosen macro-element (in the direction of rebars). Remark: The average value of the tensile strength of a given macroelement is necessarily smaller than the one for the same volume of plain concrete; the presence of rebars introduces an extra level of heterogeneity (concentration of stresses around the rebars) that promotes fracture initiation. The parameters of the lognormal distribution function for the shear strength of the macro-element (note that it is not a major player in our case, thus could be assigned a deterministic value). The mean value is equal to half the average compressive strength of the considered concrete. Its deviation is considered identical to that of the macro-element’s tensile strength. The parameters of the lognormal distribution function of the residual stiffness of the macro-element after cracking.
Figure 5: Assumed piece-wise linear model of the PMRCS
5. EXAMPLE OF APPLICATION OF THE MULTI-SCALE MODELING STRATEGY As a first validation example we chose a structural problem that has been previously studied by the authors. This same case study was originally used to validate the simultaneous use of the probabilistic explicit cracking model and the steel-concrete bond model [2, 3] and to determine the values of 𝐶 and 𝛿𝑡𝑐𝑟𝑖 related to the model for the steelconcrete bond. The structure concerned is a reinforced slab-beam submitted to three-points bending; 3.30 m long (3.00 m between supports), 0.80 m wide, and 0.15 m thick (an element must have a thickness ≤ 1/5 of its width to be considered a slab), Figure 6.
Figure 6:. Slab-beam dimensions and loading conditions
8
C. Nader, P. Rossi and J-L. Tailhan
It is important to note that the proposed slab-beam is not the best suited candidate to validate the macroscopic model: its thickness and the type of loading prompt the creation of numerous, thinner macro-cracks; the macro model, on the other hand, favors more localized and wider ones. Nevertheless, this extreme case is interesting (due to the fact that a lot of data are already available) for evaluating the applications, potentials, and limitations of the proposed Multi-Scale Modeling Strategy.
PMRCS. The objective function to minimize is the air between the two load-displacement curves. The parameters resulting from the fitting (Table 1) are the ones implemented to simulate the slab-beam behaviour using the PMRCS approach.
a)
Figure 8. Numerical tie-beam, 2D mesh
Figure 7.a presents the finite element mesh used for the numerical study of the slab-beam using the local approach.
Local
Load (MN)
0.3
a)
b)
b)
Figure 7. Slab-beam, 2D mesh
In the frame of Monte Carlo methods, 10 randomly sampled results from every type of numerical tests mentioned in this article, are considered. Figure 7.b presents the coarsest finite element mesh that yields the true elastic solution. This mesh constitutes the scale of modeling for the global approach (step 1 of the strategy, section 2). Following that is the design of the PMRCS (step 2, section 2). Figure 8.a presents the mesh for the tiebeam simulations using the local approach. Figure 8.b presents the mesh for the 2D numerical simulations of tie-beam specimen using the PMRCS. The resulting data from these simulations are shown next: Figure 9 presents the load-displacement curves of the tie-beam numerical simulations with both approaches: local and macro. The results shown here with the macroscopic model are the best fit (to the results obtained with the local approach) of the load-displacement curves. The results of the tie-beam tests are fitted by dynamically changing the parameters of the
Macro
0.2
0.1
0.0 0.000
0.002
0.004
0.006
Displacement (m)
Figure 9. Numerical tie-beam, load-displacement curves Table 1: Model parameters related to the PMRCS approach
𝝁𝝈𝒄𝒓𝒊 𝒕 3.4
𝝈𝝈𝒄𝒓𝒊 𝒕 0.5
𝝁𝑬𝒔 5300.0
𝝈𝑬𝒔 200.0
𝜇𝜎𝑐𝑟𝑖 ,𝜎𝜎𝑐𝑟𝑖 , are the parameters of the 𝑡 𝑡 lognormal distribution function of the tensile strength, and 𝜇Ε′1 , 𝜎Ε′1 , are the parameters of the lognormal distribution function of the residual stiffness after cracking. The slab-beam test simulations Figure 10 presents the load-deflection curves obtained with both the local, and the macroscopic approaches.
9
C. Nader, P. Rossi and J-L. Tailhan
Figure 11 presents an example of the cracking pattern obtained with both approaches. Figure 12 presents the total cracks openingload curves from the local and the macroscopic models. Figure 13 presents the number of cracksload curves from the local and the macroscopic models. Figure 14 presents the largest crack widthload curves obtained with both models.
Local Macro
Total Crack opening (m)
0.006
0.004
0.002
Local 0.06 0.000
Macro
0.00
0.02
0.04
0.06
Load (MN)
Load (MN) 0.04
Figure 12. Numerical slab-beam, total cracks opening-load curves
From Figures 10 to 14 we note the following:
0.02
0.00 0.00
0.01
0.02
0.03
Displacement (m)
Figure 10. Numerical slab-beam, load-deflection curves
Figure 11. Numerical slab-beam, example of cracking pattern
10
We got similar results on the average load-deflection curves form the two approaches. The total number of cracks measured with the macroscopic model is lower than the one with the local model. This is rather an expected result when opting for the Multi-Scale Modeling Strategy: loss in information in order to gain in calculation time. Identical results are obtained concerning the total crack opening with both approaches. It is consistent with the fact that the load-deflection curves are similar. The crack opening of the largest crack is a little bit more important when opting for the Multi-Scale Modeling Strategy. It is still an expected result all the approach focusing on the macrocracking determination
C. Nader, P. Rossi and J-L. Tailhan Table 2. Computation time related respectively to the macro and local approaches of modelling Local Macro
Number of Cracks
20
0 0.02
0.04
0.06
Load (MN)
Figure 13. Numerical slab-beam, total number of cracks-load curves 0.0015 Local Macro Largest Crack Width (m)
Model used
Slab-beam Slab-beam
Local Macro
Calculation time (sec) ~54360 ~960
Therefore the Multi-Scale Modeling Strategy produces consistent information on the macrocracking process with less than 2% of the required calculation time (using a local approach). Remark: to give a more precise and honest idea of the computational time saved by using the Multi-Scale Modeling Strategy, it is necessary to take into account the computational time to get the material parameters of a given macro element model (in the frame of the numerical experiment performed on the tie-beams). The weight factor of this preliminary numerical study on the total computational time related to the structural analysis will depend, of course, on the size and the complexity of the considered structure. It is a kind of "uncompressible time". In the frame of the present example, this preliminary study has consumed 10000 seconds.
10
0.00
Structure
0.0010
6. CONCLUSIONS AND PERSPECTIVES 0.0005
A multi-scale strategy to develop a Probabilistic Model for Reinforced Concrete Structures (PMRCS) is introduced in this paper. This multi-scale strategy consists in building a macro model from numerical experimentations using validated local ones: the probabilistic explicit cracking model for concrete, and the interface element model with a Mohr-Coulomb law for steel-concrete bond. As a first validation of this Multi-Scale Modeling Strategy, a previously studied case of a slab-beam structural element is proposed. The numerical simulations (in 2D, plane stresses) have shown that the scientific approach proposed is promising: the global behaviour of the structure is correctly predicted, and the macro-cracking pattern is consistent with results given by the local approach. In the process, some information on
0.0000 0.00
0.02
0.04
0.06
Load (MN)
Figure 14. Numerical slab-beam, largest crack opening-load curves
Finally, it is most important to consider the gain in computational time when using the macro model, Table 2.
11
C. Nader, P. Rossi and J-L. Tailhan
the total number of cracks is lost (which was expected), but the information about the larger crack opening is relevant. The main objective of the PMRCS is to reduce the massive computational time required to get information about the cracking process in large structures. It can be considered that this objective was reached at least in the considered example. These results could still be improved, and the gain in calculation time would be even more acute for larger structures and/or problems necessitating 3D simulations. As perspectives go, it is now important to:
[6] Combescure, Ch., Dumontet, H. and
Voldoire F. 2013. Homogenized constitutive model coupling damage and debonding for reinforced concrete structures under cyclic solicitations. International Journal of Solids and Structures 50.24: 3861-3874. [7] Huguet, M. et al. 2014. Homogenized global nonlinear constitutive model for RC panels under cyclic loadings. 11th World Congress on Computational Mechanics (WCCM XI), Barcelona, Spain [8] Sun, Bin, Xuan, Wang, and Zhaoxia, Li. 2015. Meso-scale image-based modeling of reinforced concrete and adaptive multiscale analyses on damage evolution in concrete structures. Computational Materials Science 110: 39-53. [9] Rossi, P., and Wu, X. 1992. Probabilistic model for material behaviour analysis and appraisement of concrete structures. Magazine of concrete research 44.161: 271-280. [10] Tailhan, J-L., Dal Pont, S. and Rossi, P. 2010. From local to global probabilistic modeling of concrete cracking. Annals of Solid and Structural Mechanics 1.2: 103115. [11] Rossi, P., et al. 1994. Scale effect on concrete in tension. Materials and Structures 27.8: 437-444. [12] Rossi, P., Ulm, F-J and Hachi, F. 1996. Compressive behaviour of concrete: physical mechanisms and modeling. Journal of Engineering Mechanics 122.11: 1038-1043. [13] Rossi, P. 1993. Comportement dynamique des bétons: du matériau à la structure. Annales de l'Institut technique du bâtiment et des travaux publics. No. 511. Institut technique du bâtiment et des travaux publics, (in french). [14] User manua. 1994 – Module TACT, 3rd edition, CESAR – LCPC (in french). [15] De Soza, T. 2012. Notice d’utilisation du contact, Fascicule u2.04 :Mécanique non linéaire, Révision 8205, Code_Aster v10 (in french).
Generalize the proposed strategy in the frame of 3D numerical simulations. Validate the proposed strategy on larger, real-life structures.
7. ACKNOWLEDGEMENTS The authors gratefully acknowledge the funding support from France’s National Research Agency through the “MACENA” project (ANR-11-RSNR-012). REFERENCES [1] Rossi, P., and Richer, S 1987. Numerical
[2]
[3]
[4]
[5]
modelling of concrete cracking based on a stochastic approach. Materials and Structures 20.5: 334-337. Phan, T. S., et al. 2013.Numerical modeling of the rebar/concrete interface: case of the flat steel rebars." Materials and structures 46.6: 1011-1025. Phan, T. S., Tailhan, J-L and Rossi, P. 2013. 3Dnumerical modelling of concrete structural element reinforced with ribbed flat steel rebars. Structural Concrete 14.4: 378-388. Phan, T. S., Rossi, P. and Tailhan, J-L. 2015. Numerical modelling of the concrete/rebar bond. Cement and Concrete Composites 59: 1-9. Andriotis, Ch, Gkimousis, I. and Koumousis, V. 2015. Modeling Reinforced Concrete Structures Using Smooth Plasticity and Damage Models. Journal of Structural Engineering: 04015105. 12
C. Nader, P. Rossi and J-L. Tailhan
[16] Dunn, K. Response Surface Methods,
Process Improvement Using Data. 25065, Web. [17] Bentley, J. L. and Ottmann T. 1979. Algorithms for reporting and counting geometric intersections. Computers, IEEE Transactions on 100.9: 643-647.
13