New Zealand Journal of Marine and Freshwater Research, 2000, Vol. 34: 241-252 0028-8330/00/3402-0241 $7.00 © The Royal Society of New Zealand 2000
241
Development and application of a predictive model of riverine fish community assemblages in the Taranaki region of the North Island, New Zealand MICHAEL K. JOY RUSSELL G. DEATH Institute of Natural Resources—Ecology Massey University Private Bag 11 222 Palmerston North, New Zealand email:
[email protected] Abstract A predictive model of fish community composition using a reference condition approach is proposed for the Taranaki region of New Zealand. The model is used to quantify the effects of barriers on the migration of native fish in the region. Occurrence records of fish in streams without migratory barriers (reference sites) obtained from the New Zealand freshwater fish database were used to establish trajectories of occurrence for each of 12 fish species with altitude. The relative occurrence per site for each of the species was calculated and used as the probability of the presence of that species in that altitudinal range. Comparison of these probabilities with the fauna actually found at a test site expressed as an observed over predicted ratio (O/P) is then used to compare sites to quantify barrier effects on fish communities. In a similar way this process can be used to monitor the effectiveness of fish passes, where present on dams. Independent data from 85 sites sampled over the summer of 1997/98 were used to test the predictive model. As an example of a typical use of the methodology, the effect of a single hydrodam on fish communities is illustrated. Keywords diadromy; freshwater fishes; predictive model; dams
M99025 Received 5 May 1999; accepted 5 January 2000
INTRODUCTION The use of biological indicators to evaluate anthropogenic effects on running waters has been increasing worldwide in the last two decades. As fish are at or near the apex of food chains they integrate the ecological processes of streams and may therefore be well positioned to act as indicators of stress over large temporal and spatial scales (Hynes 1970). One of the most effective ways of using fish communities in bioassessment is with the reference condition approach (Harris 1995; Bailey et al. 1998). The reference condition approach is based on pre-established criteria that exist at a wide range of sites rather than one, or a few control sites. The reference sites then serve as replicates rather than the multiple collections within sites traditionally used (Reynoldson et al. 1995). If a large number of reference sites are sampled then the variation among communities should represent the range of acceptable conditions. Furthermore, if a habitat descriptor or set of descriptors explains a substantial part of the variation among the reference communities, then using this descriptor to characterise a site will lead to a more precise prediction of communities at unimpaired sites. In North America a multimetric reference site approach is taken. The Index of Biotic Integrity (IBI) uses several fish community attributes to assess biotic integrity based on unimpacted sites, and has been shown to be sensitive to a wide range of stresses (Karr 1981, 1991; Fausch et al. 1984; Karr et al. 1986; Leonard & Orth 1986; Miller et al. 1988; Steedman 1988; Hoefs & Boyle 1992). The IBI has been adapted for use in many regions (Fauch et al. 1990; Oberdorff & Hughes 1992; Karr 1994). However, the low number of species and high incidence of diadromy in the New Zealand fauna means that the effectiveness of this index is negated or at least substantially reduced. In Great Britain, North America, and Australia a multivariate predictive model approach using reference sites has been used effectively with macroinvertebrates to assess water quality (Wright et al. 1984; Moss et al.
242
New Zealand Journal of Marine and Freshwater Research, 2000, Vol. 34
1987; Reynoldson et al. 1995; Norris 1996). Using multivariate analysis to characterise invertebrate community structure, Wright et al. (1984, 1993), Wright (1995), and Reynoldson (1995) refined their expectations of community structure at test sites by first establishing groups of reference communities with cluster analysis and then finding environmental descriptors that differed among those groups. Finally, they used the values for the environmental descriptors observed at a test site to predict which community type would be present if the test site was unimpaired. This reference condition predictive model approach has the potential to be adapted for use with fish. As the requirement to move between the sea and fresh water is considered to be the most important factor influencing the distribution of native fish in New Zealand (Hayes et al. 1989; McDowall 1990, 1993; Jowett & Richardson 1996; Jowett et al. 1996) any predictive model of fish occurrence must take migration into account. New Zealand freshwater fish
differ in their instinctive drive and ability to migrate up stream and thus each species has a distinctive elevational trajectory of occurrence (Hayes 1989; McDowall 1990,1993,1996,1998; Joy etal. 2000). Therefore, successful predictive models for describing the distribution of diadromous native fish in New Zealand must take into account large-scale variables such as altitude, distance from the sea, and the presence or absence of barriers to migration (McDowall 1993, 1996; Joy et al. 2000). These properties are not accounted for by the IBI. The objective of this present study was to apply a reference condition approach with freshwater fish assemblages to assess the effect of migratory barriers on those fish in the Taranaki region. To effect this a predictive model was applied using a habitat descriptor as a predictor to explain variation in the reference communities and to characterise the test sites. Using this predictive model of occurrence, comparisons can be made between the predictions and the fish assemblages found at test sites.
Table 1 Summary of species found in the Taranaki region of New Zealand from the New Zealand Freshwater Fish Database (NZFFD) (McDowall & Richardson 1983; Richardson 1989). Species
Scientific name
Banded kokopu Bluegill bully* Brown mudfish* Brown trout Carp* Common bully Common smelt Crans bully Giant bully* Giant kokopu* Goldfish* Inanga Koaro Koura Lamprey* Longfin eel Perch* Rainbow trout Redfin bully Rudd* Shortfinned eel Shortjawed kokopu* Torrentfish Upland bully Yellowbelly flounder*
Galaxias fasciatus Gobiomorphus hubbsi Neochanna apoda Salmo trutta Cyprinus carpio Gobiomorphus cotidianus Retropinna retropinna Gobiomorphus basalis Gobiomorphus gobioides Galaxias argentus Carassiuus auratus Galaxias maculatus Galaxias brevipinnis Paranephrops planifrons Geotria australis Anguilla dieffenbachii Perca fluviatilis Oncorhynchus mykiss Gobiomorphus huttoni Scardinus erythrophthalmus Anguilla australis Galaxias postvectis Cheimarrichthys fosteri Gobiomorphus breviceps Rhombosolea leporina
* Present at 90%) are from electro-fishing, whereas the remainder were obtained using alternative fishing methods such as trapping and night spotlighting. No attempt has been made to assess biases that result from these different sampling methods and/or operators. For each of the entries in the database, the length of waterway sampled ranged from 10 to 350 m, with a mean of 78 m (SE = 49). The sampling dates span the years between 1978 and 1997, with 157 entries before 1986 and 275 after. There are 25 species offish and one crustacean recorded for the Taranaki region, 20 are native and 5 introduced (Table 1). The 432 entries contain information on fish species abundance and size, date and time of survey, stream name, map co-ordinates, survey method, altitude, distance inland, and whether the site is above a migratory barrier. Because of considerable variation in recording methods for abundance on database forms, the species occurrence records were converted to presence/absence data for each site.
Table 2 Pearson correlation coefficients for three axes of a DECORANA ordination of Dataset A from the New Zealand Freshwater Fish Database (NZFFD) sites n = 394 and Dataset B n = 296 sites in the Taranaki region, New Zealand. Environmental variable
Axis 1
Dataset A Site above dam Altitude Distance inland
-0.41 P< 0.001 -0.53 P< 0.001 -0.49 P< 0.001
0.27 0.32 P< 0.001 0.39 P< 0.001
Dataset B Width Depth Altitude % still % backwater % pool %run % riffle % rapid % cascade Site above dam Distance inland % mud % sand % fine gravel % coarse gravel % cobble % boulder % bedrock
-0.09 -0.02 0.41 P< 0.001 0.16 0.17 0.15 -0.13 0.01 0.10 0.19 0.32 P< 0.001 0.39 P< 0.001 -0.13 -0.17 -0.08 -0.03 0.10 0.12 0.10
0.14 -0.00 -0.48 P< 0.001 -0.08 -0.11 -0.07 0.09 0.04 -0.01 0.05 -0.37 P< 0.001 -0.51 P< 0.001 -0.08 0.17 0.06 0.04 -0.01 -0.01 -0.14
Axis 2
Axis 3 0.17 0.01 0.01 0.27 P< 0.001 0.05 0.36 P< 0.001 0.04 0.05 0.02 0.18 -0.04 -0.13 -0.13 -0.07 -0.17 0.02 0.23 P< 0.001 -0.01 -0.13 0.06 -0.08 -0.07
New Zealand Journal of Marine and Freshwater Research, 2000, Vol. 34
244
-
A
8 0 - Altitude
fAA
A^
Axis 2
Fig. 1 Axis 1 as a function of axis 2 for a detrended correspondence analysis for fish communities in the Taranaki region from the New Zealand Freshwater Fish Database using Dataset A 394 sites. Open symbols are sites with free access; closed symbols are sites above dams. Vector arrows show direction of influence of the three environmental variables used from the centroid.
A
40-
-
A A
No dam Dam A
0-
0
40
80
Axis 1 Species present in less than 5% ( 0.5 Type A) and
Joy & Death—A predictive model of fish community assemblage taxa with probabilities of occurrence greater than 25% (P > 0.25 Type B). The lower cut-off is required at higher elevations where low species numbers are expected. Within each of these two probability categories the number of taxa expected at a test site was calculated as the sum of individual probabilities of each of the taxa listed. The number of taxa expected in each probability cut-off range, expressed as a percentage of the total number of taxa listed, is then compared with the taxa captured at the test sites. The percentage of taxa observed is divided by the percentage of taxa expected to give an observed over predicted ratio (O/P) for each probability category, A high O/P ratio indicates the number of species found is more than predicted and low O/P ratio indicates lower number of species than expected. The procedures involved are illustrated with an example test site on the Mangatengehu Stream at 230 m elevation (Table 3). Four species were captured at this site—both eel species, redfin bully, and upland bully. The probabilities greater than 25% for each of
247
the taxa in the altitudinal range 221-260 m are shown under the two probability cut-off levels. The number of taxa predicted was calculated by summing the number of taxa with probabilities exceeding the two probability cut-offs 0.5 and 0.25. Thus, three taxa were predicted in the A range and four in the B range. The number of migratory species captured in those categories was three because upland bully is non-migratory and thus not included. Finally the fauna observed (O) was divided by the fauna predicted (P) resulting in the observed over predicted ratio (O/P) of 1.53 and 1.31 for type A and B, respectively. The mean of the two outputs gives a single output figure. Model
testing and application To test the ability of the model to discriminate between sites with and without migratory barriers, data independent of those used in the construction of model was used. During the summer of 1997/98 eighty-five sites on Taranaki ring plain streams were sampled at various altitudes by electro-fishing and
Table 3 Method for the calculation of number and percentage of taxa expected at a site in two-probability ranges P > 0.5 and P > 0.25, their relationship with observed values, and the resultant observed over predicted (O/P) ratio. Adapted from Moss et al. (1987). (NZFFD = New Zealand Freshwater Fish Database.)
NZFFD Site No. 17601 Mangatengehu Stream Taxon Gobiomorphus huttoni Retropinna retropinna Anguilla dieffenbachii Salmo trutta Gobiomorphus basalis Galaxias postvectis Anguilla australis Cheimarrichthys fosteri Galaxias maculatus Galaxias fasdatus Gobiomorphus cotidianus Galaxias argentus Geotria australis Gobiomorphus breviceps Galaxias brevipinnis Gobiomorphus hubbsi Gobiomorphus gobioides
Captured at test site S •/
^
S
No. oftaxa predicted (sum oftaxa with probability greater than category) No. oftaxa expected (sum of individual probabilities of occurrence) No. oftaxa captured (only if migratory) Percentage of predicted (taxa expected no. expected/no, predicted %) Percentage oftaxa observed (no. captured/no, predicted %) O/P ratio (percentage of taxa O/P of taxa expected)
Probability of occurrence cut-off levels Type A P> 0.50 Type BP> 0.25 0.54 0 0.83 0.58 0 0 0 0 0 0 0 0 0 0 0 0 0
0.54 0 0.83 0.58 0 0 0.33 0 0 0 0 0 0 0 0 0 0
3 1.96 3 0.65 1 1.53
4 2.30 3 0.57 0.75 1.31
New Zealand Journal of Marine and Freshwater Research, 2000, Vol. 34
248
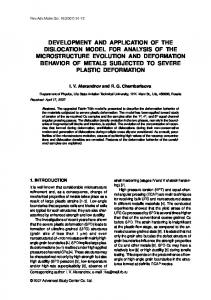
Fig. 5 Site map showing the positions of survey sites stars in relation to the Motukawa Dam on the Manganui River, Taranaki, New Zealand. Open symbols are sites with free access; closed symbols are sites above dams. Relative size of star indicates large or small observed/expected ratio.
Sireai
Mt Egmont National Park
spotlighting similar to the methods used in the NZFFD. The data was run through the model and the O/P ratio calculated for the two-probability cut-off levels. The test data consisted of 32 sites classified as having a migratory barrier and 53 sites thought to have free access. The O/P ratios for the type A and B cut-off levels were averaged and the resultant ratio for sites with free migratory access was found to be significantly greater than the ratio for sites with barriers (T 83 = 5.53; P< 0.0001). The mean O/P ratio for sites above dams was 1.03 (SE = 0.093) and with free access 1.77 (SE = 0.088), that is more fish species for a given altitude occurred in rivers with free access than with dams.
Application example using a single dam Fish occurrence details for eight sites above the Motukawa Dam on the Manganui River and 23 sites at varying elevations on tributaries entering the river below the dam were used to test the model. The Motukawa Dam on the Manganui River diverts most of the flow from the river via a channel to a hydroelectric scheme, although a small residual flow is left in the old riverbed (Fig. 5). These survey results were run through the model and mean O/P ratios for above and below the dam calculated. The resulting ratios for type A and B cut-off levels were averaged and the resulting ratio for sites without barriers was again found to be significantly greater than for sites with
Joy & Death—A predictive model of fish community assemblage
249
barriers (T 29 = 3.58; P= 0.001). The mean O/P ratio for sites on tributaries entering the Manganui River above the Motukawa dam was 0.76 (SE = 0.085) and with free access 1.31 (SE = 0.084). An alternative test Another approach for use of the model is to establish a range of acceptable O/P ratios for which if a site O/P ratio falls outside, the site fails. Bailey et al. (1998) suggested using the interquartile range of the reference distribution as acceptable. Thus, an O/P ratio falling below the first quartile would fail. Another approach is to use one standard deviation above or below the mean of the reference distribution as an acceptable range. To observe the reference distribution the 232 reference sites were run through the model (Fig. 6). The mean O/P ratio was 1.45 (SD = 0.67) and 65% of the sites fell within one standard deviation of the mean. If interquartile range criterion were used the cut-off O/P value would be 1.025, that is, values less than 1.025 would fail. In the Motukawa Dam example all but one of the eight sites above the dam would fail (87.5% fail) and of the 23 sites not effected by the dam, six (26%) would fail. If the standard deviation criterion is used as the range, an O/P ratio less than 0.78 would fail. For the Motukawa Dam, five of the eight sites above the dam (62%) would fail, whereas two (8%) of the 23 sites below the dam would fail.
DISCUSSION The multivariate analysis of environmental and habitat variables in this study highlighted elevation and distance from the sea as the most important factors affecting fish community structure in the Taranaki region. This result has been found in several other New Zealand studies which have concluded that diadromy is the most important factor influencing the distribution of native fish in New Zealand (Hayes et al. 1989; McDowall 1993, 1996; Jowett & Richardson 1996; Jowett et al. 1996; Richardson & Jowett 1996; Joy et al. 2000). Although diadromy also appears to be the overriding factor controlling the fish populations in this study, fish community assemblages are undoubtedly influenced by smallscale habitat variables, even if not at the scale measured in these surveys. The habitat variables recorded on the database cards generalise the measures over the reach surveyed and thus any important smallscale habitat variables may be obscured. Another potential problem related to use of the NZFFD data
0.50
1.00
1.50
2.00
2.50
3.00
3.50
4.00
Observed/predicted ratio
Fig. 6 Distribution of observed/predicted ratios for the 232 reference sites.
is the visual estimation of most measures included in the database and the subjectivity resulting from the many contributors. The grouping of sites into 10 elevational categories was also somewhat arbitrary, as there is a compromise between number of groups and the number of sites per group. The two probability cut-off levels (P > 0.5 and P > 0.25) used in the model gave similar results, however, and the lower probability cut-off level (P > 0.25) will be necessary at higher elevations where the number of species predicted is low. The use of the presence or absence of specified fish taxa at any point along the length of a water body to measure environmental impact is dependent on the use of reference sites based in that region. McDowall (1996) discussed the value of using the altitudinal trajectories of occurrence for individual species from the NZFFD and pointed out that these trajectories could be interpreted as the probability that the species will be found in each elevational range. He concluded that although adapting these trajectories using locally relevant species would have the disadvantage of reducing the number of sites available this would be offset by the fact that regional curves would be explicit to local conditions. McDowall (1998) found that trajectories offish occurrence differed between regions in New Zealand. Reynoldson
250
New Zealand Journal of Marine and Freshwater Research, 2000, Vol. 34
& Rosenberg (1996), using a similar predictive reference site model with macroinvertebrates, investigated the effect of reducing the number of reference sites and found that reducing the sites by up to 75% did not significantly reduce the predictive ability of the model. The 102 waterways in this study all originate on the slopes of Mount Taranaki and all emerge at a similar altitude from native forest into predominantly dairy farmland. Thus, the waterways all have similar underlying geology, gradient, and land-use attributes at similar elevations. This environmental homogeneity over an altitudinal gradient makes this region ideal for the implementation of a relatively simple predictive model using fish communities. The application of the model to different regions in New Zealand would require regionally based reference sites, which, because other regions are not so homogeneous, may require a more complicated model than that developed for Taranaki. This study was undertaken to provide a method for quantifying the effects of barriers to migration on native fish communities in the Taranaki region. To achieve this goal the fauna expected at any altitude in the absence of migratory barriers must be known. A predictive model based on unimpacted (reference) sites was chosen as having the potential to achieve this objective. The determination of the reference condition from reference sites is based on the premise that sites least affected by human activity will exhibit biological conditions most similar to those at natural pristine locations. Thus, the prediction technique outlined in this paper uses information from a number of sites to generate a statement on the fauna to be expected at an average site at the same altitude. The predictions in this model are intended to represent the natural long-term characteristics of the communities and are not intended to predict seasonal variations in the fauna. The average ratio for a series of sites with similar migratory access should be around unity but individual sites can be expected to take values above or below unity (e.g., Fig. 6). Unusually low O/P ratios are used as an indication of a migratory barrier and high O/P ratios indicate open access and high water and habitat quality. However, several samples are required (at least three) and the ratios averaged to lessen the effect of chance differences in sampling or differences in faunas owing to fine-scale variations. Where a fish pass has been installed on a dam the model can be used to monitor the effectiveness of the pass by comparing O/P ratios.
The use of an arbitrary cut-off point based on the reference distribution has been suggested by Bailey et al. (1998). If the interquartile or one standard deviation range criterion were used, the Motukawa Dam would fail. However, the interquartile cut-off would mean that 25% of the reference sites would also fail, and 18% of the reference sites would fail if the standard deviation cut-off were used. This highlights the difficulty in using an arbitrary cut-off. If there is an impact other than the dam a group of sites may fail even if the dam is not having an impact. This is because some sites will always fail with any arbitrary cut-off because of other factors impacting on the communities, now or historically.
CONCLUSION The symmetrical topography and homogeneity of land-use and habitat variables in relation to elevation on the Taranaki ring plain permitted the use of a single variable, altitude, as a predictor offish community structure. Reference sites were used to characterise least impacted conditions and provided the basis for community composition predictions. A procedure initially developed by Wright et al. (1984) using macroinvertebrates was adapted to enable the translation of probabilities offish occurrence into an observed over expected ratio. The ratio was then used as a measure of the condition of a test site in relation to the reference condition. Comparison of observed/predicted ratios above and below potential barriers permitted the assessment of the impact of migratory barriers or the effectiveness offish passes on fish community structure. Alternatively, the impact of a dam or the efficiency of a fish pass can be assessed using the O/P ratios from the model by using a predetermined pass/fail cut-off value. However, the comparison of above/below values is recommended to counteract the possibility of effects other than the dam under investigation impacting fish communities in the study waterway.
ACKNOWLEDGMENTS We thank Dean Caskey (Department of Conservation) and Hamish McWilliam (Taranaki Regional Council) for assistance in the field. Thanks to Rosemary Miller for her comments on the manuscript and persistence in setting up the original project. Thanks also to John Hayes, Ian Henderson, Bob McDowall, and Rowan Strickland for comments on early drafts of the paper. The research was funded by Department of Conservation grant 2355.
Joy & Death—A predictive model of fish community assemblage REFERENCES Bailey, R. C ; Kennedy, M. G.; Dervish, M. Z.; Taylor, R. M. 1998: Biological assessment of freshwater ecosystems using a reference condition approach: comparing predicted and actual benthic invertebrate communities in Yukon streams. Freshwater Biology 39: 765-774. Beals, E. W. 1984: Bray-Curtis ordination: an effective strategy for analysis of multivariate ecological data. Advances in Ecological Research 14: 1-55.
251
Karr, J. R. 1981: Assessments of Biotic integrity using fish communities. Fisheries (Bethseda) 6: 21-27. Karr, J. R. 1991: Biological integrity: a long neglected aspect of water resource management. Ecological Applications 1: 66-84. Karr, J. R. 1994: Using biological criteria to protect ecological health. In: Rapport, D.; Gaudet, C ; Calow, P. ed. Evaluating and monitoring the health of large scale ecosystems. New York, SpringerVerlag.
Fausch, K. D.; Karr, J. R.; Yant, P. R. 1984: Regional application of an index of biotic integrity based on stream fish communities. Transactions of the American Fisheries Society 113: 39-55.
Karr, J. R.; Fausch, K. D.; Angermeir, P. L.; Yant, P. R.; Schlosser, 1. J. 1986: Assessing biological integrity in running waters: a method and its rationale. Illinois Natural History Survey Special Publication 5. 28 p.
Fausch, K. D.; Lyons, J.; Karr, J. R.; Angermeir, P. L. 1990: Fish communities as indicators of environmental degradation. American Fisheries Society Symposium 8: 123-144.
Leonard, P. M.; Orth, D. J. 1986: Application and testing of an index of biotic integrity in small, coolwater streams. Transactions of the American Fish Society 115: 401-414.
Harris, J. N. 1995: The use offish in ecological assessments. Australian Journal of Ecology 20: 65-80.
McCune, B. 1994: Improving community analysis with the Beals smoothing function. Ecoscience 1: 82-86.
Hayes, J. W.; Leathwick, J. R.; Hanchet, S. M. 1989: Fish distribution patterns and their association with environmental factors in the Mokau River catchment, New Zealand. New Zealand Journal of Marine and Freshwater Research 23: 171-180.
McCune, B.; Mefford, M. J. 1997: Multivariate Analysis of Ecological Data 3.01. Gleneden Beach, Oregon, United States, MJM Software.
Hoefs, N. J.; Boyle, T. P. 1992: Contribution of fish community metrics to the Index of Biotic Integrity in two Ozark rivers In: McKenzie, D. H.; Hyatt, D. E.; McDonald, V. J. ed. Ecological indicators. London, Elsevier. Pp. 283-304. Hynes, H. B. N. 1970: The ecology of running waters. Toronto, University of Toronto Press. 555 p. Jowett, I. G.; Richardson, J. 1995: Habitat preferences of common, riverine New Zealand native fishes and implications for flow management. New Zealand Journal of Marine and Freshwater Research 29: 13-23.
McDowall, R. M. 1990: New Zealand freshwater fishes: a natural history and guide. Auckland, Heinemann Reed. 553 p. McDowall, R. M. 1993: Implications of diadromy for the structuring and modeling of riverine fish communities in New Zealand. New Zealand Journal of Marine and Freshwater Research 27: 453-462. McDowall, R. M. 1996: Biodiversity in New Zealand fishes, and the role of freshwater fishes as indicators of environmental health in New Zealand fresh waters. NIWA Consultancy Report MFE70502: 1-86.
Jowett, I. G.; Richardson, J.; McDowall, R. M. 1996: Relative effects of in stream habitat and land use on fish distribution and abundance in tributaries of the Grey River, New Zealand. New Zealand Journal of Marine and Freshwater Research 30: 463-475.
McDowall, R. M. 1998: Use of freshwater fishes as indicators of environmental health—further analyses. NIWA Consultancy Report MFE70509: 1-30. McDowall, R. M.; Richardson, J. 1983: The New Zealand freshwater fish survey; guide to input and output. Report, Ministry of Agriculture and Fisheries. Fisheries Research Division Information Leaflet Number 12: 1-15. Miller, D. L.; Leonard, P. L.; Hughes, R. M. 1988: Regional applications of an index of biotic integrity for use in resource management. Fisheries 13: 12-20.
Joy, M. K.; Henderson, 1. M ; Death, R. G. 2000: Diadromy and patterns of upstream penetration of freshwater fish in Taranaki, New Zealand. New Zealand Journal of Marine and Freshwater Research 34: in press.
Moss, D.; Furse, M. T.; Wright, J. F.; Armitage, P. D. 1987: The prediction of the macro-invertebrate fauna of unpolluted running-water sites in Great Britain using environmental data. Freshwater Biology 17: 41-52.
Jowett, 1. G.; Richardson, J. 1996: Distribution and abundance of freshwater fish in New Zealand rivers. New Zealand Journal of Marine and Freshwater Research 30: 239-255.
252
New Zealand Journal of Marine and Freshwater Research, 2000, Vol. 34
Morris, R. H. 1996: Predicting water quality using reference conditions and associated communities. In: Bailey, R. C ; Norris, R. H.; Reynoldson, T. B. ed. Study design and data analysis in benthic macroin vertebrate assessments of freshwater ecosystems using a reference site approach. Pp. 3253. Oberdorff, T.; Hughes, R. M. 1992: Modification of an index of biotic integrity based on fish assemblages to characterise rivers of the Seine Basin France. Hydrobiologia 228: 117-130. Reynoldson, T. B.; Bailey, R. C ; Day, K.. E.; Norris, R. H. 1995: Biological guidelines for freshwater sediment based on BEnthic Assessment of SedimenT the BEAST using a multivariate approach for predicting biological state. Australian Journal of Ecology 20: 198-219. Reynoldson, T. B.; Rosenberg, D. M. 1996: Sampling strategies and practical considerations in building reference data bases for the prediction of invertebrate community structure. In: Bailey, R. C ; Norris, R. H.; Reynoldson, T. B. ed. Study design and data analysis in benthic macroinvertebrate assessments of freshwater ecosystems using a reference site approach. Technical Information Workshop, Kalispell, Montana, North American Benthological Society. Pp. 1-31.
Richardson, J. 1989: The all-new freshwater fish database. Freshwater Catch 41: 20-21. Richardson, J.; Jowett, I. G. 1996: How does your catch measure up? Water and Atmosphere 4: 17-19. Steedman, R. J. 1988: Modification and assessment of an index of biotic integrity to quantify stream quality in southern Ontario. Canadian Journal ofFisheries and Aquatic Sciences 45: 492-501. Taranaki Catchment Commission. 1984: Surface hydrology: Taranaki Ring Plain water resources survey. Taranaki Regional Council 1995: Dams, weirs and fish passes in Taranaki: a photographic record and a summary of the available fish distribution data. Wright, J. F. 1995: Development and use of a system for predicting the macroinvertebrate fauna in flowing waters. Australian Journal of Ecology 20: 181-197. Wright, J. F.; Furse, M. T.; Armitage, P. D. 1993: RIVIPACS—a technique for evaluating the biological quality of rivers in the UK. European Water Pollution Control 3: 15-25. Wright, J. F.; Moss, D.; Armitage, P. D.; Furse, M. T. 1984: A preliminary classification of running water-sites in Great Britain based on macro-invertebrate species and the prediction of community type using environmental data. Freshwater Biology 14: 221-256.