African Journal of Biotechnology Vol. 8 (23), pp. 6588-6595, 1 December, 2009 Available online at http://www.academicjournals.org/AJB ISSN 1684–5315 © 2009 Academic Journals
Full Length Research Paper
Development and application of a real-time quantitative PCR assay for determining expression of benzo-apyrene-Inducible cytochrome P450 1A in Nile tilapia (Oreochromis niloticus) Abeer A. I. Hassanin1, Yoshino Kaminishi2*, Mohamed M. M. Osman3, Zamzam H. AbdelWahad4, Mohamed A. H. El-Kady5 and Takao Itakura6 1,2,5,6
Laboratory of Marine Biotechnology, Faculty of Fisheries, Kagoshima University, 4-50-20 Shimoarata, Kagoshima 890-0056, Japan. 1,3 Department of Animal Wealth Development, Faculty of Veterinary Medicine, Suez Canal University, Ismailia, Egypt. 4 Department of Animal Hygiene, Faculty of Veterinary Medicine, Suez Canal University, Ismailia, Egypt. 5 The National Institute of Oceanography and Fisheries, Alexandria, Egypt. Accepted 11 June, 2009
Cytochrome P4501A’s (CYP1A) constitute a ubiquitous family of proteins associated with the detoxification of organic compounds such as PCB (polychlorinated biphenyl), PAH (polyaromatic hydrocarbons) and dioxin. These compounds are documented to induce the CYP1A gene in a variety of tissues of many fish species. Consequently, changes in CYP1A gene expression have been used as a biomarker for contaminant exposure in fish populations using a variety of techniques. Of all of these methods, quantitative PCR appears to be the most sensitive. It has been used to assess impact of environmental pollution in marine ecosystems using different fish models. Subsequently, for measuring benzo-a-pyrene (BaP) induction of CYP1A mRNA in different organs of tilapia (Oreochromis niloticus), ribosomal protein large P0-like protein (RPLP0-like protein) and -actin genes as internal controls were selected based on previous studies to assess their expression variability. Real-time polymerase chain reaction (real-time PCR) analysis of liver, intestine, gills and kidney revealed a distinct induced expression in liver and intestine (127.1 and 79.3 in liver, 26 and 56.1 in intestine using RPLP0 and actin genes respectively as internal controls) with no detectable expression in the other organs studied. Key words: Benzo-a-pyrene, oreochromis, real-time PCR, internal control. INTRODUCTION Aquatic ecosystems serve as the ultimate sink for many environmental pollutants, which accumulate in fish species. Fish are among the most sensitive species to the toxicity of an AhR agonist, 2,3,7,8-tetrachlorodibenzop-dioxin, particularly at early developmental stages (Walker and Peterson, 1991; Walker et al., 1992; Dong et al., 2001, 2002; Carney et al., 2006). In addition, fish exposed to dioxin-like compounds show induction of CYP1A activity (Ethoxyresorufin-O-deethylase activity) and
*Corresponding author. E-mail:
[email protected]. Tel: 81-99-286-4221. Fax: 81-99-286-4015.
its mRNA (Kreamer et al., 1991; Stegeman and Hahn, 1994; Bucheli and Fent, 1995; Goksoyr, 1995; Goksoyr and Husoy, 1998; Fenet et al., 1998; Levine and Oris, 1999; Wong et al., 2001). Therefore, in fish, the CYP1A gene has been used as a useful biomarker of dioxin-like compounds for assessing the level of contamination in an aquatic environment (Williams et al., 1998; Moore et al., 2003; Fent, 2003). Real-time PCR (qRT-PCR) is a sensitive, reproducible and high-throughput method that can show subtle changes in relative quantities of a large number of genes, consuming small sample amounts (Bustin, 2002; Bustin and Nolan, 2004). Detection with SYBR Green has been recommended due to its adaptability to most quantification
Hassanin et al.
6589
Table 1. Oligonucleotide primers used in PCR amplification of tilapia RPLP0 cDNA fragments.
Primer F Long UPM Short UPM
Nucleotide Sequence 5'-CCCTCTCACCATCCCCCACTCC 5-'CTAATACGACTCACTATAGGGCAAGCAGTGGTAACAACGCAGAGT 5'- CTAATACGACTCACTATAGGGC
systems (Rasmussen et al., 1998; Schmittgen and Zakrajsek, 2000; Vandesompele et al., 2002). For accurate data interpretation a stable normalizer is mandatory. Housekeeping genes have been considered to be constitutively expressed and minimally regulated. Therefore, they have been widely used as internal RNA references for qualitative analysis and are used as reference genes (endogenous controls) for quantitative analysis in qRT-PCR assays (Carrillo-Casas et al., 2008). However, the mRNA expression of many internal controls varies with the experimental conditions and no single gene has been shown to be invariant per se (Thellin et al., 1999; Stürzenbaum and Kille, 2001; Radonic´ et al., 2004). Therefore, in this study, we determined the expression pattern of CYP1A mRNA in liver, intestine, gills and kidneys of tilapia after intraperitoneal injection of benzo-apyrene (BaP), a CYP1A inducer (Hahn and Stegeman, 1994) using real-time PCR and RPLP0, -actin mRNAs as internal controls.
4°C for further PCRs. Identification and cloning of O. niloticus ribosomal protein large P0-like protein (RPLP0) gene as an internal standard We designed one sense (F) primer specific to Tilapia RPLP0 for 3' RACE PCR. The primer sequence is shown in Table 1. The sense gene specific primer was used in combination with the universal primer mix (UPM) included in a RACE PCR kit (Clontec Inc) to generate partial sequence of O. niloticus ribosomal protein large P0-like protein gene. The cycle conditions for RACE PCR were as follows: 5 cycles of denaturation for 30 s at 94°C and annealing for 3 min at 58°C; 5 cycles of denaturation at 94°C for 30 s, annealing at 56°C for 30 s, and extension for 3 min at 72°C; and finally 35 cycles of denaturation at 94°C for 30 sec, annealing at 54°C for 30 s and extension at 72°C for 3 min. After purification using GFX PCR DNA and a gel band purification kit (GE Health Care, UK), the PCR products obtained were cloned into PT7BlueT-vector (Novagen, USA). Purified plasmids were directly sequenced by dye terminator cycle sequencing using an ABI PRISM dye terminator cycle sequencing kit (PE Biosystemes, USA) and an applied Biosystems 3130 xl DNA sequencer.
MATERIALS AND METHODS
Phylogenetic analysis of RPLP0-like protein gene
Treatment of fish
DNA sequences with the following Genbank accession numbers were retrieved from the database and used in the phylogenetic analysis: EU714144 {orange-spotted grouper (Epinephelus coioides) RPLP0}, EU081838 {yellow perch (Perca flavescens) RPLP0}, AY550965 {gilthead seabream (Sparus aurata) RPLP0}. In order to determine homology among RPLP0 family cDNAs or deduced amino acid sequences from various species, sequence alignment was performed by the CLUSTAL W method using Laser gene Megalign program (Ver 5.52,2003, DNASTAR Inc).
Nile tilapia (Oreochromis niloticus) with a mean weight of 500 g were obtained from a local fish farm and were treated with a single intraperitoneal injection of benzo-a-pyrene (100mg/ kg body weight) suspended in corn oil. Simultaneously with the treated fish, control fish of similar mean weight was intraperitoneally injected with an equivalent volume of the vehicle (corn oil). The treated and control fish were killed 24 h after the injection and samples of liver, kidney, gills and intestine were collected, immediately frozen in liquid nitrogen and stored at -80°C.
Primer design for real-time PCR reaction RNA isolation Total RNA was isolated from 2 g of each of the samples of frozen liver, kidney, gills and intestine according to the Standard Acid Guanidinium Thiocyante Phenol Choloroform (AGPC) extraction method (Chomczynski and Sacchi, 1978). Total RNA concentration and purity were determined spectrophotometrically as described by (Sambrook and Russel, 2001), and A260/A280 ratio were between 1.7 and 1.9.
Primers for Oreochromis niloticus CYP1A (accession no. FJ389 918), RPLP0 (accession no. FJ389919) and -actin (accession no. EU887951) genes (Table 2) were designed using Laser gene primer select program (Ver5.52, 2003, DNASTAR Inc), with melting temperatures (Tm) ranging from 58 - 60°C, and amplicon lengths of 50-150 bp. Optimal programmed primer annealing temperatures were designed closely so that the optimal annealing temperatures were close enough to run all reactions under the same thermal parameters.
Reverse transcription
Real-time PCR conditions and analysis
Reverse transcription (RT) was performed using PrimescriptTM RT reagent kit (Takara, Japan) according to the manufacturer’s instructions. Reactions were incubated for 15 min at 37°C then 5 s at 85°C to inactivate the reverse transcriptase. RT products were stored at
Each PCR reaction consisted of 10 µl of SYBR® Premix Ex TaqTM II (2X), 0.5 µl of each primer (10 µM), 2 µl of cDNA template (500 ng/ µl) and double distilled water to a final volume of 20 µl. Reactions were then analyzed on an ABI 7300 Real-Time PCR System under
6590
Afr. J. Biotechnol.
Table 2. Real-time PCR primers of Oreochromis niloticus CYP1A, RPLP0 and -actin genes.
Gene CYP1A gene
Direction F R F R F R
RPLP0 gene -actin gene
Sequence (5'-3') 5'-AGTTTGTTGCTCCTGCTGTATTGTT 5'-GGTTGGATAGTTTAGGATGCTGCA 5'-CCCTCTCACCATCCCCCACTCC 5'-TTGTCTGCCAGGAGGAAGGA 5'-GGGTCAGAAAGACAGCTACGTT 5'- CTCAGCTCGTTGTAGAAGGTGT
Location 1950 - 1974 2051 - 2074 1 - 22 74 - 93 42 - 63 164 - 185
Product size 124 bp 92 bp 143 bp
C
-1
CCTCTCACCATCCCCCACTCCGTCATCAATGGCTACAAGAGAGTCCTGGCTGTTGCTGTGGAGACAGACTACTCCTTCCCCCTGGCA
87
P
L
T
I
P
H
S
V
I
N
G
Y
K
R
V
L
A
V
A
V
E
T
D
Y
S
F
P
L
A
GACAAAGTCAAAGCCTTCCTGGCTGACCCATCTGCATTTGCTGTCGCAGCACCTGCAGCAGCTGCTGAGACTGCCGCAGCTCCAGCT
D
K
V
K
A
F
L
A
D
P
S
A
F
A
V
A
A
P
A
A
A
A
E
T
A
A
A
P
A
GCTGCTGCTAAGGAGGAGGCCAAGGAGGAGTCTGAGGAATCAGATGGCGACATGGGCTTCGGTTTGTTCGACTAATAAAATACAGCG A
A
A
K
E
E
A
K
E
E
S
E
E
S
D
G
D
M
G
F
G
L
F
D
*
AACAGAACCACATCTAATAAGAACATGATTCAATAAATAACGTAAGATACAAAAAAAAAAAAAAAAAAAAAAAAAAAAAAA
29
174
58
261 83 342
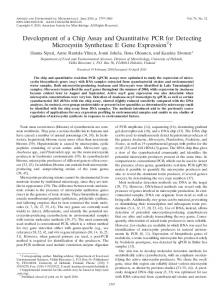
Figure 1. Nucleotide sequence (343 bp) of cytochrome RPLP0-like protein cDNA and its deduced amino acids (83) residues. Consensus sequence for polyadenylation signal is in bold. The stop codon, TAA, is marked with an asterisk.
the following conditions: 95°C for 10 s and 40 cycles of 95°C for 5 s followed by 60°C for 1 min. All standard dilutions, no template controls, and induced samples were run in triplicates .The fluorescence signals were measured at the end of each extension step. The threshold cycle (Ct) was determined for each sample using the exponential growth phase and the baseline signal from the fluorescence versus cycle number plots. To ensure that a single product was amplified, melt curve analysis was performed on the PCR products at the end of each PCR run. The amount of CYP1A mRNA, normalized to RPLP0-like protein and -actin mRNAs, was given by the formula: 2- CT; where CT is the threshold cycle indicating the fractional cycle number at which the amount of amplified CYP1A reached threshold. The CT value is determined by subtracting the average RPLP0-like protein CT value from the average CYP1A CT value. Then, the calculation of CT involves subtraction of the CT value of the calibrator (in our case the calibrator was average CT value of control fish response in the BaP studies) from CT value of each sample. Accordingly, CYP1A mRNA levels were reported as fold change in abundance relative to the average calibrator response.
Statistical analysis The statistical differences between the groups were determined, and the data expressed as mean ± standard deviation. Excel (Microsoft, NY) were used to analyze the data.
RESULTS Partial nucleotide sequence of RPLP0 gene The partial nucleotide sequence (Figure 1) was about 343 bp contained 249 bp of the open reading frame, and a 3' noncoding region of 93 bp. The sequence has one polyadenylation signal (AATAAA) and a poly A tail of 31 nucleotides. This sequence was aligned with Epinephelus coioides ribosomal protein LP0-like protein, Perca flavescens ribosomal protein LP0-like protein and Sparus
Hassanin et al.
6591
Table 3. Percent identities of deduced amino acid sequences of fish RPLP0 gene.
Orange-spotted grouper 84.3
Nile tilapia Orange-spotted grouper Yellow perch
Yellow perch 18.1 12.8
Gilthead seabream 18.1 12.8 72.2
Epinephelus coioides Oreochromis niloticus Perca flavescens Sparus aurata
190.5 180 160 140 120 100 80
60
40
20
0
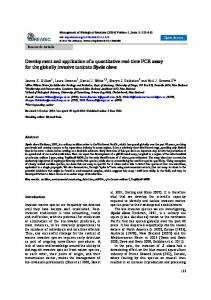
Nucleotide Substitutions (x100) Figure 2. Phylogenetic tree of RPLP0 genes in fishes.
Table 4. RT-PCR results for tilapia CYP1A, RPLP0 and -actin genes.
Sample name L.cont L.ind I.cont I.ind
CYP1A Mean Ct Std Dev Ct 25.06 0.02 15.49 0.09 30.75 0.52 25.24 0.59
RPLP0 Mean Ct Std Dev Ct 23.42 0.62 20.85 0.21 22.13 0.34 21.33 0.17
-Actin Mean Ct Std Dev Ct 21.09 0.09 17.83 0.13 23.02 0.14 23.32 0.44
L.cont = Liver control; L.ind = liver induced; I.cont = intestine control; I.ind = intestine induced.
aurata ribosomal protein LP0-like protein sequences by CLUSTAL W (Thompson et al., 1994) using Lasergene Megalign program, version 5.52, 2003 (DNASTAR Inc) and has been deposited in the GenBank/NCBI data bank with an accession number FJ389919. Comparison of amino acid sequences Table 3 showed the percent identities of deduced amino acid sequences of Nile tilapia (O. niloticus) RPLP0-like protein gene with the other fish RPLP0-like protein genes. The highest identity was 84.3% with orange-spotted grouper (Epinephelus coioides), followed by 18.1% with both yellow perch (Perca flavescens) and gilthead seabream (Sparus aurata). Phylogenetic analysis The phylogenetic tree based on the amino acid sequences were used to assess the relationship of RPLP0-like protein gene of O. niloticus with those of other fish species. Figure 2 clearly shows tilapia RPLP0-like protein
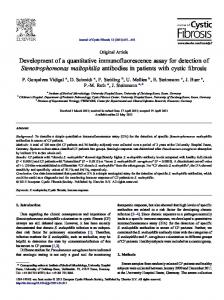
and E. coioides RPLP0-like protein to be more closely related to each other than to P. flavescens and S. aurata RPLP0-like protein gene. CYP1A mRNA level in different tissues of BaP treated fish RT-RCR results revealed that there was a large increase in CYP1A mRNA in liver and intestine (127.1 and 79.3 in liver, 26 and 56.1 in intestine using RPLP0 and -actin genes respectively as internal controls) (Tables 4, 5 and 6), (Figures 3 and 4) but no significant signals in gills and kidney were detected. DISCUSSION RT-RCR results revealed that there was a large increase in CYP1A mRNA in liver and intestine with no detectable expression in gills and kidney. The induction of CYP1A in liver and intestine provided a defensive mechanism against the pollutants entering from the external environment.
6592
Afr. J. Biotechnol.
Table 5. Amount of CYP1A mRNA, normalized to RPLP0-like protein mRNA.
Sample name L.cont L.ind I.cont I.ind
Tilapia CYP1A average Ct 25.06 15.49 30.75 25.24
RPLP0 gene average Ct 23.42 20.85 22.13 21.33
Ct 1.63 -5.36 8.62 3.92
-
Ct
Ct -6.99
2 127.1
-4.7
26
L.cont = Liver control; L.ind = liver induced; I.cont = intestine control; I.ind = intestine induced.
Table 6. Amount of CYP1A mRNA, normalized to -actin mRNA.
Sample name L.cont L.ind I.cont I.ind
Tilapia CYP1A average Ct 25.06 15.49 30.75 25.24
-actin gene average Ct 21.09 17.83 23.02 23.32
Ct 3.97 -2.34 7.73 1.92
-
Ct
Ct -6.31
2 79.3
-5.81
56.1
L.cont = Liver control; L.ind = liver induced; I.cont = intestine control; I.ind = intestine induced.
Figure 3. Tilapia CYP1A mRNA normalized to RPLP0- like protein mRNA.
Among different biochemical responses, CYP1A mRNA induction was considered to be a sensitive biomarker in response to persistent organic pollutants (POPs) contamination (Wong et al., 2000). The induction of CYP1A mRNA is of toxicological significance due to involvement in the activation and detoxification of procarcinogens and other toxicants (Nebert, 1989). Our results agreed with that of Chris et al. (2001), who studied the specific expression of cytochrome P4501A gene in gill,
intestine and liver of tilapia exposed to coastal sediments using the primer dropping polymerase chain reaction technique and found that following sediment exposure, there was a large increase in CYP1A mRNA in intestine and liver but no significant changes in gill tissues (In the first 3 days exposure, there was from 34-96 and 69156% induction of the CYP1A1 transcripts in intestine and liver, respectively. Following 7 days of exposure, a continued induction of high level of CYP1A1 mRNA in
Hassanin et al.
1. CYP1A
2. RPLP0 gene
6593
3. -actin
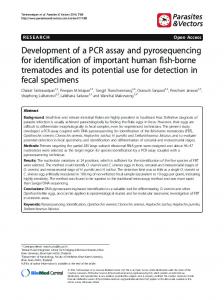
Figure 4. Real-time PCR results for tilapia CYP1A (1), RPLP0 (2), -actin (3) genes. Where L.cont = Liver control; L.ind = liver induced; I.cont = intestine control; and I.ind = intestine induced.
intestine (73-157%) was observed). The relatively low inducibility in gill tissue was supported by Leguen et al. (2000), demonstrating that gill cells had a significantly lower capacity (1.5-14%) of the biotransformation systems compared with hepatocytes. Liver CYP1A regulation and enzymatic activity shows species-specific responses to organic contaminants (Stein et al., 1993; Flammarion et al., 1998; Arinc et al., 2000; Whyte et al., 2000). It was reported that a single intra peritoneal injection of BaP induced liver CYP1A expression in various fish species such as Fundulus heteroclitus (>5 µg/g-BW, Willett et al., 2001), Turbot (>5 µg/g-BW, Scophthalmus maximus, Telli-Karakoc et al., 2002), Japanese medaka (Oryzias latips, >20 µg/g BW, Carlson et al., 2002). Oh et al. (2009) determined the expression pattern of CYP1A gene in brain, heart, liver, kidney, gonad, intestine, gill, spleen, and muscle of goldfish (Carassius auratus) after intraperitoneal exposure to benzo-a-pyrene (BaP) using quantitative RT-PCR and found that BaP-IP exposure significantly increased CYP1A gene expression in the intestine and gill as well as liver, which are known as major target tissue of xenobiotics. Neilson (1994) and Wong et al. (1996) owing the high level of expression of CYP1A in intestine with no detectable expression in gills to the fact that polycyclic aromatic hydrocarbons (PAHs) have very low water solubility, therefore ingestion of sediments and bottom detritus suggested being the major route of sedimentassociated contaminants intake by tilapia. Van Veld et al. (1990) reported that fish collected from PAHs contaminated sites could show CYP1A induction in the intestine, which is a major target tissue of xenobiotics uptake for highly lipophilic persistent organic pollutants (POPs) such as many AhR ligands (Van Veld et al., 1990; Wong et al., 2001). Analysis of gene expression requires sensitive, precise, and reproducible measurements for specific mRNA sequences. To avoid bias, real-time PCR is referred to one or several internal control genes. In our experiment we used RPLP0-like protein and -actin genes as internal
standards as both show nearly similar expression levels in both control and Bap treated tissues (Table 4). Hongbao Ma et al. (2006) mentioned that a gene that is to be used as a loading control (or internal standard) should have various features; the standard gene should have the same copy number in all cells, it should be expressed in all cells and a medium copy number is advantageous since the correction should be more accurate. They also suggested the use of mRNA for RPLP0 protein and -actin as commonly used internal standards. A reliable internal control should show minimal changes, whereas a gene of interest might change over the course of an experiment (Bustin et al., 2005; Dheda et al., 2005; Huggett et al., 2005). Thus, choosing an internal control is critical for gene expression quantification. Consequently, it is necessary to validate the expression stability of a control gene under specific experimental conditions prior to its use for normalization. In conclusion, we have developed a real-time quantitative PCR assay for analysis of CYP1A expression in different organs of Nile tilapia after intraperitoneal injecttion of benzo-a-pyrene and found distinct induced expression in liver and intestine with no detectable expression in gills and kidneys. The real-time assay has a high degree of sensitivity detecting down to 1000 molecules CYP1A −1 l total RNA. This validation study for real-time assay will enable more accurate and reliable normalization of real-time PCR results to encourage further studies directed toward a better understanding of the function of specific genes in Oreochromis niloticus. REFERENCES Arinc E, Sen A, Bozcaarmutlu A (2000). Cytochrome P4501A and associated mixed-function oxidase induction in fish as a biomarker for toxic carcinogenic pollutants in the aquatic environment. Pure Appl. Chem. 72: 985-994. Bucheli TD, Fent K (1995). Induction of cytochrome P450 as a biomarker for environmental contamination in aquatic ecosystem. Crit. Rev. Environ .Sci. 25: 201-268. Bustin SA (2002). Quantification of mRNA using real-time reverse tran-
6594
Afr. J. Biotechnol.
scription PCR (RT-PCR): trends and problems. J. Mol. Endocrionol. 29: 23-39. Bustin SA, Nolan T (2004). Pitfalls of quantitative real-time reversetranscription polymerase chain reaction. J. Biomol. Tech. 15: 155166. Bustin SA, Benes V, Nolan T, Pfaffl MW (2005). Quantitative real-time RT-PCR-a perspective. J. Mol. Endocrinol. 34: 597-601. Carlson EA, Li Y, Zelikoff JT (2002). Exposure of Japanese Medaka (Oryzias latipes) to benzo[a]pyrene suppresses immune function and host resistance against bacterial challenge. Aquat. Toxicol. 56: 289301. Carney SA, Prasch AL, Heideman W, Peterson RE (2006). Understanding dioxin developmental toxicity using the Zebrafish model. Birth Defects Res. A(76): 7-18. Carrillo-Casas EM, Herna´ndez-Castro R, Sua´rez-Gu¨emes F, Moctezuma AD (2008). Selection of the Internal Control Gene for Real-Time Quantitative RT-PCR Assays in Temperature Treated Leptospira. Curr. Microbiol. 56: 539-546. Chomczynski P, Sacchi N (1978). Single-step method of RNA isolation by acid guanidinium thiocyanate-phenol-chloroform extraction. Anal. Biol. Chem. 162: 156-159. Chris KC, Wong Yeung HY, Woo PS, Wong MH (2001). Specific expression of cytochrome P4501A1 gene in gill, intestine and liver of tilapia exposed to coastal sediments. Aquat. Toxicol. 54: 69-80. Dheda K, Huggett JF, Chang JS, Kim LU, Bustin SA, Johnson MA, Rook GAW, Zumla A (2005). The implications of using an inappropriate reference gene for real-time reverse transcription PCR data normalization. Anal. Biochem. 344: 141-143. Dong W, Teraoka H, Kondo S, Hiraga T (2001). 2, 3, 7, 8tetrachlorodibenzo- p-dioxin induces apoptosis in the dorsal midbrain of Zebrafish embryos by activation of arylhydrocarbon receptor. Neurosci. Lett. 303: 169-172. Dong W, Teraoka H, Yamazaki K, Tsukiyama S, Imani S, Imagawa T, Stegeman JJ, Peterson RE, Hiraga T (2002). 2, 3, 7, 8tetrachlorodibenzo- p-dioxin toxicity in the Zebrafish embryo: Local circulation failure in the dorsal midbrain is associated with increased apoptosis. Toxicol. Sci. 69: 191-201. Fenet H, Casellas C, Bontoux J (1998). Laboratory and field-caging studies on hepatic enzymatic activities in European eel and rainbow trout. Ecotoxicol. Environ. Saf. 40: 137-143. Fent K (2003). Ecotoxicological problems associated with contaminated sites. Toxicol. Lett. pp. 140-141, 353-365. Flammarion P, Migeon B, Garric J (1998). Statistical analysis of cyprinid ethoxyresorufin-O-deethylase data in a large French watershed. Ecotoxicol. Environ. Saf. 40: 144-153. Goksoyr A (1995). Use of cytochrome P4501A (CYP1A) in fish as a biomarker of aquatic pollution. Arch. Toxicol. Suppl. 17: 80- 95. Goksoyr A, Husoy AM (1998). Immunochemical approaches to studies of CYP1A localization and induction by xenobiotics in fish. In: Braunbeck T, Hinton DE, Streit B, editors. Fish Ecotoxicol. Basel: Birkhauser. pp. 165-202. Hahn ME, Stegeman JJ (1994). Regulation of cytochrome P4501A1 in teleosts: Sustained induction of CYP1A1 mRNA, protein, and catalytic activity by 2, 3, 7, 8-tetrachlorodibenzofuran in the marine fish Stenotomus chrysops. Toxicol. Appl. Pharmacol. 127: 187-198. Hongbao Ma, Kuan-Jiunn Shieh, Geroge Chen, X. Tracy Qiao, Mei-Ying Chuang (2006). Application of Real-time Polymerase Chain Reaction (RT-PCR). J. Am Sci. 2(3). Huggett J, Dheda K, Bustin SA, Zulma A (2005). Real-time RTPCR normalization; strategies and considerations. Genes Immun. 6: 279284. Kreamer GL, Squibb K, Gioeli D, Garte SJ, Wirgin I (1991). Cytochrome P4501A mRNA expression in feral Hudson River tomcod. Environ. Res. 55: 64-78. Leguen I, Carlsson C, Perdu-Durand E, Prunet P, Part P, Cravedi JP (2000). Xenobiotic and steroid biotransformation activities in rainboe trout gill epithelial cells in culture. Aquat. Toxicol. 48: 165-176. Levine SL, Oris JT (1999). CYP1A expression in liver and gill of rainbow trout following waterborne exposure: Implications for biomarker determination. Aquat. Toxicol. 46: 279-287. Moore MJ, Mitrofanov IV, Valentini SS, Volkov VV, Kurbskiy AV, Zhimbey EN, Eglinton LB, Stegeman JJ (2003). Cytochrome P4501A
expression, chemical contaminants and histopathology in roach, goby and sturgeon and chemical contaminants in sediments from the Caspian Sea, Lake Balkhash and the Ily River Delta, Kazakhstan. Mar. Pollut. Bull. 46: 107-119. Nebert DW (1989). The Ah locus L genetic differences in toxicity, cancer, mutation and birth defects. CRC Crit. Rev. Toxicol. 20: 137152. Neilson AH (1994). Persistence: Environmental Aspects. Organic Chemicals in the Aquatic Environment: Distribution, Persistence, and Toxicity. Lewis Publishers, London, pp. 183-213. Oh SM, Ryu BT, Kim HR, Chol K, Chung KH (2009). Molecular Cloning of CYP1A Gene and Its Expression by Benzo(a)pyrene from Goldfish (Carassius auratus). Environ. Toxicol. 24(3):225-34. Radonic A, Thulke S, Mackay IM, Landt O, Siegert W, Nitsche A (2004). Guideline to reference gene selection for quantitative realtime PCR. Biochem. Biophys. Res. Commun. 313: 856-862. Rasmussen R, Morrison T, Herrmann M, Wittwer C (1998). Quantitative PCR by continuous fluorescence monitoring of a double strand DNA specific binding dye. J. Biochem. 2: 8-11. Sambrook J, Russel DV (2001). Molecular cloning: a laboratory manual, 3rd ed edition, cold spring harbor laboratory, N.Y., 1: 7.13-7.17. Schmittgen TD, Zakrajsek BA (2000). Effect of experimental treatment on housekeeping gene expression: validation by real time, quantitative RT-PCR. J. Biochem. Biophys. Methods, 46: 69-81. Stegeman JJ, Hahn ME (1994). Biochemistry and molecular biology of monooxygenases: Current perspectives on forms, functions and regulation of cytochrome P450 in aquatic species. In: Malins DD, Ostrander GK. Editors. Aquatic Toxicology, Molecular, Biochemical and Cellular Perspectives. Boca Ranton, FI: Lewis Publishers. pp. 87-206. Stein JE, Collier TK, Reichert WL, Casillas E, Hom T, Varanasi U (1993). Bioindicators of contaminant exposure and sublethal effects in benthic fish from Puget Sound, WA, USA. Mar. Environ. Res. 35: 95-100. Stürzenbaum SR, Kille P (2001). Control genes in quantitative molecular biological techniques: the variability of invariance. Comp. Biochem. Physiol. 130: 281-289 Telli-Karakoc F, Ruddock PJ, Bird DJ, Hewer A, Van Schanke A, Phillips DH, Peters LD (2002). Correlative changes in metabolism and DNA damage in turbot (Scophthalmus maximus) exposed to benzo[a]pyrene. Mar. Environ. Res. 54: 511-515. Thompson JD, Higgins DG, Gibson TJ (1994). CLUSTAL W: Improving the sensitivity of progressive multiple sequence alignment through sequence weighting, positions-specific gap penalties and weight matrix choice. Nucleic Acids Res. 22: 4673-4680. Vandesompele J, De Preter K, Pattyn F, Poppe B, Van Roy N, De Paepe A, Speleman F (2002). Accurate normalization of real-time geometric averaging of multiple internal control genes. Genome Biol. 3:00341-003411. Van Veld PA, Westbrook DJ, Woodin BR, Hale RC, Smith CL, Huggett RJ, Stegeman JJ (1990). Induced cytochrome P450 in intestine and liver of spot (Leiostomus xanthurus) from a polycyclic aromatic hydrocarbon contaminate environment. Aquat .Toxicol. 17: 119-132. Walker MK, Peterson RE (1991). Potencies of polychlorinated dibenzop-dioxin, dibenzofuran, and biphenyl congeners, relative to 2,3,7,8tetrachlorodibenzo-p-dioxin for producing early life stage mortality in rainbow trout (Oncorhynchus mykiss). Aquat. Toxicol. 21: 219-238. Walker MK, Hufnagle Jr. LC, Clayton MK, Peterson RE (1992). An egg injection method for assessing early life stage mortality of polychlorinated dibenzo-p-dioxins, dibenzofurans, and biphenyls in rainbow trout (Oncorhynchus mykiss). Aquat. Toxicol. 22: 15-38. Whyte JJ, Jung RE, Schimitt CJ, Tillitt DE (2000). Ethoxyresorufin-Odeethylase (EROD) activity in fish as a biomarker of chemical exposure. Crit. Rev. Toxicol. 30: 347-570. Willett KL, Wassenberg D, Lienesch L, Reichert W, Di Giulio RT (2001). In vivo and in vitro inhibition of CYP1A-dependent activity in Fundulus heteroclitus by the polynuclear aromatic hydrocarbon fluoranthene. Toxicol. Appl. Pharmacol. 177: 264-271. Williams DE, Lech JJ, Buhler DR (1998). Xenobiotics and xenoestrogens in fish: Modulation of cytochrome P450 and carcinogenesis. Mutat. Res. 399: 179-192. Wong MH, Hung KM, Chiu ST (1996). Sludge-grown algae as feeds for
Hassanin et al.
aquatic organisms. Part II. Sludge-grown algae as feeds for aquatic organisms. Environ. Manage. 20: 375-384. Wong CKC, Yeung HY, Cheung RYH, Yung KKL, Wong MH (2000). Ecotoxicological assessment of persistent organic and heavy metal contamination in Hong Kong coastal sediment. Arch. Environ. Contamin. Toxicol. 38: 468-483.
6595
Wong CKC, Yeung HY, Woo PS, Wong MH (2001). Specific expression of cytochrome P4501A1 gene in gill, intestine and liver of tilapia exposed to coastal sediments. Aquat. Toxicol. 54: 69-80.