DISEASES OF AQUATIC ORGANISMS Dis Aquat Org
Vol. 108: 251–259, 2014 doi: 10.3354/dao02720
Published April 3
Validation of a quantitative PCR assay for detection and quantification of ‘Candidatus Xenohaliotis californiensis’ Carolyn S. Friedman*, Nate Wight, Lisa M. Crosson, Samuel J. White, Robyn M. Strenge School of Aquatic and Fishery Sciences, University of Washington, Box 355020, Seattle, Washington 98195, USA
ABSTRACT: Withering syndrome (WS), a serious disease affecting abalone Haliotis spp., is caused by infection from an intracellular Rickettsia-like organism (WS-RLO). Diagnosis of the disease currently relies on a combination of histological examination and molecular methods (in situ hybridization, standard PCR, and sequence analysis). However, these techniques only provide a semiquantitative assessment of bacterial load. We created a real-time quantitative PCR (qPCR) assay to specifically identify and enumerate bacterial loads of WS-RLO in abalone tissue, fecal, and seawater samples based on 16S rDNA gene copy numbers. The qPCR assay designed to detect DNA of the WS-RLO was validated according to standards set by the World Organisation for Animal Health. Standard curves derived from purified plasmid dilutions were linear across 7 logs of concentration, and efficiencies ranged from 90.2 to 97.4%. The limit of detection was 3 gene copies per reaction. Diagnostic sensitivity was 100% and specificity was 99.8%. The qPCR assay was robust, as evidenced by its high level of repeatability and reproducibility. This study has shown for the first time that WS-RLO DNA can be detected and quantified in abalone tissue, fecal, and seawater samples. The ability to detect and quantify RLO gene copies in a variety of materials will enable us to better understand transmission dynamics in both farmed and natural environments. KEY WORDS: Withering syndrome · Rickettsia-like organism · WS-RLO · Validation · Abalone · Haliotis spp. Resale or republication not permitted without written consent of the publisher
Withering syndrome (WS), a fatal disease of abalone Haliotis spp., is caused by infection with the intracellular rickettsial bacterium ‘Candidatus Xenohaliotis californiensis’ (a Rickettsia-like organism, RLO; Friedman et al. 2000). The WS-RLO infects posterior esophagus and digestive gland epithelial cells and has resulted in mortalities of wild and cultured abalones along the west coast of North America. Susceptibility to the WS-RLO and resultant disease varies among species (Friedman et al. 2000, Moore et al. 2000, Vilchis et al. 2005, Wetchateng et al. 2010). Black abalone H. cracherodii populations along much of
California, USA, are at 1 to 10% of their historical population size due, in part, to WS (Haaker et al. 1992, VanBlaricom et al. 1993, Altstatt et al. 1996, Friedman et al. 1997, Miner et al. 2006). Other abalone species such as wild and farmed red abalone H. rufescens, an important aquaculture species, and captive white abalone H. sorenseni, an endangered species, have also experienced WS-related mortalities in areas of California (Haaker et al. 1995, Moore et al. 2000, 2002, Friedman et al. 2007). Due to the inability to culture the WS-RLO, diagnosis currently relies on a combination of histological examination and molecular methods such as in situ hybridization and PCR (Andree et al. 2000,
*Corresponding author:
[email protected]
© Inter-Research 2014 · www.int-res.com
INTRODUCTION
Dis Aquat Org 108: 251–259, 2014
252
Antonio et al. 2000, Friedman et al. 2000, OIE 2009). While these techniques have allowed researchers and abalone culturists to monitor the pathogen and disease, they have limitations. For example, while the standard PCR test is highly sensitive and allows for species-specific detection, it only provides qualitative information on the presence or absence of target DNA and does not quantify target DNA. Histological examination is the existing gold standard method for determining WS-RLO presence and intensity (Burreson 2008, OIE 2009). However, it can only provide a semi-quantitative assessment of bacterial load. Furthermore, histology is expensive and time consuming. Here we validated and employed a high-throughput diagnostic test to rapidly identify and enumerate bacterial loads of WS-RLO. Quantitative real-time PCR (qPCR) allows simultaneous identification and quantification of target DNA sequences (Vadopalas et al. 2006, OIE 2009, Wight et al. 2009). We developed a qPCR assay for use in WS-RLO identification and quantification from tissue, fecal, and seawater samples. Since validation of molecular tests is essential prior to application, we validated the qPCR assay for analytical and diagnostic sensitivity and specificity according to the World Organisation for Animal Health (OIE 2009).
MATERIALS AND METHODS Sample collection
Table 1. Haliotis spp. Abalone species tested for diagnostic validation for the Rickettsia-like organism that causes withering syndrome (WS-RLO) Species
Pinto H. kamtschatkana Ezo H. discus hannai Red H. rufescens Black H. cracherodii White H. sorenseni Green H. fulgens Total
US state
n
WS-RLO exposed?
Washington Hawaii Hawaii California California California California California California
226 8 21 72 25 30 57 39 40 518
No No Yes No Yes No Yes Yes Yes
Station using wild broodstock collected from Puget Sound, Washington (Table 1). Posterior esophagus (PE) and/or digestive gland (DG) tissues were aseptically excised from each abalone according to Friedman et al. (2007). To compare WS-RLO quantification by histology and qPCR, parallel 2 to 3 mm cross sections of PE and DG were excised. The posterior section was preserved in 95% molecular grade ethanol for qPCR analysis and the anterior section was placed posterior side down in a histology cassette, fixed in Invertebrate Davidson’s solution (Shaw & Battle 1957) for 24 h, and stored in 70% ethanol for routine paraffin histology processing (Luna 1968). Deparaffinized 5 µm tissue sections were stained with hematoxylin and eosin and viewed by light microscopy. WS-RLO infections were blindly quantified according to the scale of Friedman et al. (1997; Table 2), where a histological score of 0 indicated no presence of WS-RLO and a score of 3 indicated heavy infection. At the University of Washington Pathogen Quarantine Facility (UWPQF), 40 ml fecal samples (n = 78) were collected in conical tubes using sterile transfer pipettes from tanks holding either WS-RLO infected
As the WS-RLO infects a variety of species, multiple species were included in the samples assayed. The following abalone (n = 518) were used in the development and/or validation of the qPCR assays: red Haliotis rufescens, white H. sorenseni, green H. fulgens, Ezo H. discus hannai, black H. cracherodii, and pinto H. kamtschatkana. The health history of all abalones used in the assays was known. Green (n = 40), Ezo (n = 29), Table 2. Haliotis spp. Histology scores compared with quantitative PCR results for naïve abalone and abalone exposed to the Rickettsia-like organism that white (n = 39), and red abalone (n = 25) causes withering syndrome (WS-RLO) were reared on abalone farms in either California or Hawaii. Wild black Histology Inclusions WS-RLO Quantitative PCR abalone (n = 87) were collected from score (20× field) history n % Mean SE the California mainland (Carmel) and positive copies mg−1 islands (San Nicolas Island), and wild red abalone (n = 72) were collected 0 0 Naïve 336 0.2 6.52 × 10⁻² 6.52 × 10⁻² 0 0 Exposed 24 62.5 5.06 × 10² 2.76 × 10² from Sonoma and Mendocino Coun1 1−10 Exposed 47 100 1.01 × 10⁶ 3.46 × 10⁵ ties in northern California. All pinto 2 11−100 Exposed 48 100 3.75 × 10⁶ 8.17 × 10⁵ abalone (n = 226) were produced at 3 >100 Exposed 24 100 4.90 × 10⁶ 1.56 × 10⁶ the NOAA Mukilteo Biological Field
Friedman et al.: qPCR assay validation of a rickettsial bacterium
253
Table 3. 16S rDNA targeted PCR primer (oligo) and probe sets specific for the Rickettsia-like organism that causes withering syndrome (WS-RLO); na: not applicable Designation
Sequence (5’ to 3’)
Length (bases)
Annealing temp (°C)
Expected product size (bp)
WSN1 F WSN1 R
AGT TTA CTG AAG GCA AGT AGC AGA TCT AAC TTG GAC TCA TTC AAA AGC
24 24
58.9 59
147
WS-RLO_P
TGC TTG GAA ATC TAC TCA GAA GAC ATG A
28
65.4
na
or uninfected (previously treated with oxytetracycline to remove RLO infections; Friedman et al. 2003, 2007) abalone. To pellet fecal material, each sample was centrifuged at 2000 × g (20 min at 4°C). The supernatant was decanted and the fecal pellet was processed immediately for DNA extraction as outlined below. In addition, 100 ml aliquots of seawater (n = 78) were collected in sterile beakers from the UWPQF tanks in conjunction with the fecal sampling. Seawater samples were individually passed through 0.1 µm Nuclepore track-etched polycarbonate membrane filters (Whatman). After filtration, the filters were individually stored in microcentrifuge tubes and held at −80°C until DNA extraction.
DNA extractions Abalone DNA was extracted from approximately 150 mg of ethanol-preserved PE and DG tissues using the QiaAmp DNA Stool Mini Kit (Qiagen) according to the manufacturer’s ‘Isolation of DNA from Stool for Pathogen Detection’ protocol. DNA was then eluted in 100 µl and stored at −20°C until use. Fecal samples were immediately processed as described above for abalone tissue, and DNA was stored at 4°C and analyzed via qPCR within 48 h of sample extraction. DNA from abalone seawater samples was extracted from filters by adding 200 µl Tris-EDTA buffer (pH 8.0) followed by an initial incubation step of 70°C for 10 min and vigorous vortexing for 2 min to facilitate bacterial lysis. Cells were further released from the filter by mashing with a sterile pestle for several minutes followed by a 5 min incubation at 95°C. DNA assayed within 48 h of being extracted was stored at 4°C, while that assayed over 48 h after being extracted was stored at −20°C until use.
PCR primer/probe design and optimization We designed qPCR primers (WSN1F and WSN1R; Table 3) based on WS-RLO 16S rDNA sequence
available in GenBank (AF133090). Using ClustalW (Thompson et al. 1994), sequences of the WS-RLO and closely related bacteria (Table 4) were analyzed to identify a region of 16s rDNA unique to the WSRLO bacterium. Using Primer3 (Rozen & Skaletsky 2000), primers were selected with the following characteristics: (1) amplify 100 to 300 bp of a unique WSRLO DNA region, (2) melting temperature of 60°C, and (3) minimal self-complementarity or primer dimer formation with the final selection of primers that amplified a 147 bp fragment of the WS-RLO 16S rDNA gene (Table 3). Amplify 3.0 (freeware available at http://engels.genetics.wisc.edu/amplify/) was used to run in silico PCR reactions with the primer set against the WS-RLO, closely related rickettsial 16S rDNA sequences identified using the BLAST algorithm (Table 4; Altschul et al. 1990), and known marine RLOs to estimate quality of the primers. Subsequently, concentrations of our WSN1 primers (Table 3) were selected using SYBR® Green I (Agilent Technologies) as those yielding the lowest quantification cycle (Cq; Bustin 2002) and a reaction efficiency of 90 to 110% (Stratagene 2004). Table 4. GenBank accession numbers of 16s rDNA sequences from Rickettsia and several other closely related bacteria used in sequence alignments for primer design and testing in silico with Amplify for assay specificity Species Anaplasma marginale Caedibacter caryophila Cowdria ruminantium Coxiella burnetii Ehrlichia sennetsu Ehrlichia risticii Ehrlichia phagocytophila Ehrlichia bovis Escherichia coli NHP bacterium Piscirickettsia salmonis Rickettsia prowazekii Rickettsia rickettsii Wolbachia pipientis
Accession no. M60313 X71837 X61659 M21291 M73225 M21290 M73224 U03775 J01695 U65509 X60783 M21789 M21293 X61768
254
Dis Aquat Org 108: 251–259, 2014
Primer3 was also used to develop a dual-labeled hydrolysis probe unique to the WS-RLO 16s DNA sequence to improve specificity of the assay (Table 3). The probe was synthesized with a 5’ FAM fluorophore and a 3’ Black Hole Quencher®-1 (Biosearch Technologies). Probe specificity requirements were the same as for primer design, except that GC content and length were optimized for a 70°C annealing temperature to ensure that the probe would anneal prior to primer annealing and extension. Probe concentrations were selected as the lowest yielding acceptable detection (Cq ≤ 30).
determination (R2), were calculated for all assays, and baseline thresholds were normalized to 400 raw fluorescent units. The number of WS-RLO gene copies was determined for each abalone DNA sample via regression analysis of the standard curve (Larionov et al. 2005). For tissue and fecal samples, gene copy numbers were calculated per gram of sample, while seawater samples were calculated as gene copy numbers per ng of genomic DNA extracted from the standard volume of water filtered.
qPCR validation Generation of a WS-RLO plasmid DNA standard curve for PCR The WSN1 primers and the P16RK3 plasmid DNA (Andree et al. 2000) that contains a 1550 bp fragment of the 16S rDNA gene of the WS-RLO were used to develop standard curves for the qPCR assay. Plasmid DNA was subsequently isolated using the QIAprep Spin Miniprep Kit (Qiagen) according to the manufacturer’s protocol prior to being linearized with the restriction enzyme Nco I (New England Biolabs). Plasmid concentration was measured spectrophotometrically using the Quant-IT™ PicoGreen® dsDNA Assay kit (Invitrogen) and a Genios Plate Reader (Tecan Systems). Subsequently, a 10-fold serial dilution was prepared in 1× Tris-EDTA buffer to obtain 1 copy to 30 million copies (using 2 µl of template) per PCR reaction. Plasmid standard curves were also generated using DNA from uninfected abalone digestive tissues.
Quantitative PCR reaction conditions and data interpretation Probe-based qPCR reactions were conducted in 96-well 0.2 µl PCR plates in 25 µl volumes using 12.5 µl 2× Immomix (Bioline), 320 nM of each primer, 200 nM of probe, 2 µl of DNA template, and 0.6 mg µl−1 bovine serum albumin. Quantitative PCRs were conducted using the following conditions: 10 min at 95°C, followed by 45 cycles of 15 s at 95°C, and 30 s at 60°C. All plasmid DNA standards and samples were tested in triplicate along with WS-RLO-free negative controls. Assayed samples were considered positive if the mean copy number of the triplicates was equal to or higher than the assay’s analytical sensitivity (determined as described below). Reaction efficiency and precision, based on the coefficient of
Efficiency and linear dynamic range To determine qPCR efficiency and linear dynamic range, 5 separate standard curves of the P16RK3 plasmid DNA were constructed. The standard curves ranged from 1 copy to 3 million gene copies, and 20 replicates of each curve were tested. Efficiencies were calculated from the slope of each standard curve using the formula E = [10(−1/slope)] − 1 (Stratagene 2004). Assays with an E between 90 and 110% were considered acceptable (Stratagene 2004). By plotting the Cq of each dilution and fitting the data to a straight line, the linear dynamic range of each curve was determined.
Analytical sensitivity and specificity Analytical sensitivity, or an assay’s lower limit of detection (LOD), was determined by testing 90 qPCR replicates of low copy number plasmid DNA (1, 3, and 10 gene copies) on multiple plates over multiple days. Assay selectivity, i.e. the ability to accurately quantify the target gene in samples with varying amounts of interferent (OIE 2009), was evaluated by adjusting genomic DNA (gDNA) concentrations of known WS-RLO-positive samples spanning the operating range of the plasmid standard curve. All samples were tested in triplicate to determine whether gDNA sample components influenced reaction efficiency and precision. An internal amplification control (IAC; Nolan et al. 2006) was used to detect total (no amplification) or partial inhibition (delay in Cq) of the qPCR assays. Multiplex reactions containing both the WS-RLO DNA specific primer/probe set and the IAC primer/ probe set (Nolan et al. 2006) were conducted on a subset of tissues from across all histological indices mentioned above (n = 30 each), on 30 seawater and
Friedman et al.: qPCR assay validation of a rickettsial bacterium
30 fecal samples. Differences in Cq values of the IAC among treatments were examined by least squares regression (JMP 10.0 SAS). We tested our qPCR assay for cross reactivity using DNA from 2 marine RLOs, Piscirickettsia salmonis and the shrimp necrotizing hepatopancreatitis (NHP) bacterium. Other closely related RLOs for which we did not have DNA were tested for possible cross reaction with our qPCR primers and probe in silico using Amplify 3.0 with 16s rDNA sequences in GenBank (Table 4). To ensure the presence of amplifiable DNA in all samples used to assess cross reactivity, nucleic acid from all samples negative for WS-RLO DNA by PCR was tested using universal small subunit (SSU) ribosomal RNA gene primers of Le Roux et al. (1999) and conditions as outlined by Friedman et al. (2005).
Diagnostic sensitivity and specificity Diagnostic sensitivity (DSe; rate of false negative reactions) and specificity (DSp; rate of false positive reactions) were determined according to OIE (2009) guidelines. We used animals of known infection status, as previously determined by histology, as a source of DNA from infected (n = 158) and uninfected abalone (n = 336). Infected abalone included those collected from within the WS-endemic zone in California or were infected in the laboratory, while uninfected abalone included individuals from areas devoid of the WS-RLO in California, pinto abalone reared at the NOAA Mukilteo Biological Field Station, and Ezo abalone from a farm in Hawaii (Table 1). The WS-RLO is able to infect a variety of abalone species, and we have not observed any differences in DNA quality or amplification among species examined (C. S. Friedman & L. M. Crosson pers. obs.). These animals were confirmed to be WS-RLO-positive or -negative by histology. All qPCR reactions were run in triplicate. Diagnostic sensitivity was calculated using the equation: [(Number of true positive samples)/ (Number of true positive + Number of false negative samples)] × 100. Diagnostic specificity was calculated using the equation: [(Number of true negative samples)/(Number of true negative + Number of false positive samples)] × 100. To determine the relationship between histology estimates of infection intensity and qPCR gene copy numbers, we compared the average gene copy numbers from a subset of the WS-RLO exposed (n = 143) and all uninfected samples to the corresponding histological score using abalone of known infection his-
255
tory. The 143 exposed animals included 119 with confirmed infections using histology and 24 samples from animals that had been exposed to the WS-RLO by cohabitation with known infected animals but showed no evidence of infection upon histological examination (Table 2).
Reproducibility and repeatability To evaluate the diagnostic reproducibility of the qPCR assay (inter-assay variation), we tested 3 WSRLO-positive samples from low to high copy number spanning the linear operating range of the assay for each of the tissue, fecal, and seawater sample types. Each sample was tested in triplicate once per day for 5 consecutive days across 2 different platforms, CFX96 (Bio-Rad) and Opticon2 (Bio-Rad), performed by separate operators in 2 different laboratories. Reproducibility was determined by calculating the coefficient of variation (CV) of the mean copy number among assays for each sample (Bustin et al. 2009). An inter-assay CV of 0 to 30% was considered acceptable (Pfaffl 2004). Repeatability (intra-assay variation) was determined by a single operator testing 6 WS-RLO-positive samples spanning the linear operating range of the assay for each of the tissue, fecal, and seawater sample types in replicates of 8 on the CFX96™ (Bio-Rad) platform. An intra-assay CV of 0 to 20% was considered acceptable (Pfaffl 2004).
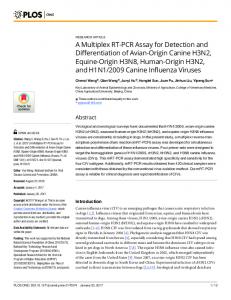
RESULTS Efficiency and linear dynamic range The reaction efficiency of the 5 WS-RLO-plasmid standard curves ranged from 90.2 to 97.4%, and the coefficients of determination (R2) ranged from 0.995 to 0.999 (mean ± SE = 0.997 ± 0.002). Based on reaction efficiency, the linear dynamic range of the assay was 2 to 30 million gene copies (Fig. 1). Presence of abalone DNA did not influence the standard curves.
Analytical sensitivity and specificity The ability of the qPCR assay to detect low plasmid copy numbers ranged from 38.9% (35/90) for 1 gene copy, 51.1% (46/90) for 2 gene copies, to 68.9% (62/90) for 3 gene copies. Based on a 50% certainty
Dis Aquat Org 108: 251–259, 2014
256
Additionally, when we initially employed SYBR Green I chemistry (Agilent Technologies) to test our selected primers using the qPCR assay, a single product was amplified upon melt curve analysis. The amplified fragment was sequenced, aligned, and identified using the BLAST algorithm as ‘Candidatus Xenohaliotis californiensis’ (WS-RLO; 100% pairwise identity).
35 30 25 20
30 000 000
3 000 000
Copy number
300 000
30 000
3000
300
30
3
15
Diagnostic sensitivity and specificity 1
Quantification cycle (Cq)
40
Fig. 1. Standard curve based on a cloned plasmid that contained a copy of a unique fragment of the 16s rDNA gene of the Rickettsia-like organism that causes withering syndrome (WS-RLO). Box plots (red) illustrate mean and 95% confidence intervals for the quantification cycle (Cq) of each standard (copy number) in relation to the raw data (small black squares). The standard curve was run 5 times in triplicate; the R2 value ranged from 0.995 to 0.999 (mean ± SE = 0.997 ± 0.002), and qPCR efficiencies ranged from 90.2 to 97.4%
cutoff as defined by OIE (2009), the minimum LOD of our qPCR assay was 2 gene copies. However, Bustin et al. (2009) recommended 3 copies as the most sensitive LOD theoretically possible. Therefore, the true minimum LOD was set to 3 gene copies per reaction, and only unknown samples whose average quantities were ≥3 gene copies (mean ± SE Cq = 41.31 ± 0.23, CV = 0.02) were considered positive. The Cq values for plasmid-based standard curves were similar among all 5 curves tested (p > 0.05). The primers and probe developed for qPCR were specific to the WS-RLO DNA target. Using Amplify 3.0, no amplification was predicted with bacteria other than the WS-RLO. In addition, qPCR primers were unable to amplify DNA from other closely related RLOs (Piscirickettsia salmonis and the shrimp NHP bacterium) assayed. The inclusion of the IAC (Nolan et al. 2006) in qPCR analyses from tissue (Cq = 30.49 ± 0.06) and fecal (Cq = 30.71 ± 0.04) samples confirmed a lack of PCR inhibition, as the multiplexed IAC Cq values were not delayed in any reactions. Mean IAC Cq was also not delayed in seawater samples; however, the mean Cq was slightly lower in extracted seawater samples (Cq = 29.62 ± 0.04) relative to reactions containing other DNA or those lacking any DNA template (Cq = 30.83 ± 0.167; p < 0.05). The mean IAC Cq for all sample types was 30.36 (± 0.03).
DSe was 100% and DSp was 99.7% for the qPCR assay. WS-RLO gene copy numbers per gram of tissue were determined for all tissue samples and averaged per histological reference group (Table 2). All samples that were diagnosed as infected via histology amplified via our qPCR (n = 158) assay. Of the 24 samples that had been previously exposed to the WS-RLO but showed no histological evidence of infection (0 rating), 62.5% of the samples contained amplifiable WS-RLO DNA (n = 24) as tested by qPCR (mean ± SE Cq = 38.02 ± 0.40, CV = 0.088) and had a mean gene copy number of 5.06 × 10² per gram of tissue (SE = 2.76 × 10²). A single unexposed sample of the 336 tested was amplified by qPCR. Presence of amplifiable DNA was demonstrated in all WS-RLO PCR negative samples by amplification of 18S rDNA. WS-RLO DNA was amplified from all fecal and seawater samples (n = 39 each) from the 6 tanks containing infected abalone. Fecal samples averaged 2.73 × 10⁷ gene copies per gram of fecal material (SE = 2.18 × 10⁷). Seawater samples averaged 1.35 × 10⁶ gene copies per ml of seawater (SE = 2.8 × 10⁵). No WS-RLO DNA was detected via qPCR from fecal and seawater samples (n = 39 each) from 6 tanks in which abalone had been medicated with oxytetracycline to remove WS-RLO infections.
Reproducibility and repeatability The CV of the qPCR mean inter-assay variability (reproducibility) was 27.98% for tissue, 11.29% for fecal, and 10.85% for seawater samples tested on the CFX96 (Bio-Rad) platform (Table 5). On the Opticon2 platform (Bio-Rad; Table 5), the CV was 16.78% for tissue, 19.48% for fecal, and 17.22% for seawater samples. Mean intra-assay variability (repeatability) was 10.33% for tissue, 16.25% for fecal, and 13.75% for seawater samples (Table 6).
Friedman et al.: qPCR assay validation of a rickettsial bacterium
257
Table 5. Haliotis spp. Reproducibility (inter-assay variability) of the qPCR assay for samples of abalone tissue, feces, and seawater that spanned the range of levels of Rickettsia-like organism that causes withering syndrome (WS-RLO) observed for each sample type and tested across multiple qPCR platforms. Each sample was assayed in triplicate WS-RLO copy number category
CFX96™ assay copy number Mean SD CV (%)
Opticon2™ assay copy number Mean SD CV (%)
Tissue Low Medium High
7.30 × 101 9.39 × 10² 1.04 × 10⁶
2.43 × 101 3.52 × 10² 1.37 × 10⁵ Mean
33.23 37.48 13.23 27.98
5.23 × 101 1.05 × 10³ 8.99 × 10⁵
4.47 × 100 2.47 × 10² 1.64 × 10⁵ Mean
8.55 23.51 18.29 16.78
Fecal Low Medium High
2.36 × 101 3.60 × 10³ 1.71 × 10⁴
4.19 × 100 3.37 × 10² 1.15 × 10³ Mean
17.78 9.36 6.71 11.29
2.13 × 101 3.02 × 10³ 1.54 × 10⁴
4.21 × 100 6.50 × 10² 2.63 × 10³ Mean
19.78 21.54 17.12 19.48
Water Low Medium High
1.91 × 101 2.04 × 10² 3.36 × 10³
2.16 × 100 1.62 × 101 4.31 × 10² Mean
11.31 7.96 13.26 10.85
2.08 × 101 1.75 × 10² 2.14 × 10³
3.56 × 100 4.93 × 101 1.36 × 10² Mean
17.18 28.13 6.35 17.22
Table 6. Haliotis spp. Repeatability (intra-assay variability, CFX96™ assay) of the qPCR assay for samples of abalone tissue, fecal, and seawater samples that were positive for Rickettsia-like organism that causes withering syndrome (WS-RLO) and that spanned the observed range in copy number for each tissue type. Each sample was assayed in triplicate Log10 WS-RLO copy number
Mean
qPCR copy number SD CV (%)
Tissue 1 2 4 4 5 5
8.85 × 100 1.02 × 10² 2.21 × 10⁴ 7.81 × 10⁴ 3.04 × 10⁵ 6.07 × 10⁵
2.09 × 100 1.52 × 101 1.13 × 10³ 3.64 × 10³ 2.35 × 10⁴ 3.60 × 10⁴ Mean
23.61 14.90 5.12 4.67 7.74 5.93 10.33
Fecal 1 2 2 3 4 5
1.86 × 101 2.28 × 10² 3.97 × 10² 7.33 × 10³ 4.83 × 10⁴ 1.58 × 10⁵
4.33 × 100 3.22 × 101 8.23 × 101 7.61 × 10² 9.21 × 10³ 1.57 × 10⁴ Mean
23.28 14.09 20.74 10.39 19.06 9.94 16.25
Water 1 1 2 2 3 3
1.65 × 101 2.07 × 101 7.58 × 101 4.13 × 10² 2.03 × 10³ 2.46 × 10³
3.30 × 100 5.38 × 100 4.64 × 100 4.95 × 101 2.21 × 10² 1.83 × 10² Mean
19.97 26.03 6.13 12.01 10.91 7.44 13.75
DISCUSSION Using guidelines outlined by the World Organization for Animal Health (OIE 2009), our qPCR assay reliably detected and quantified WS-RLO DNA in abalone tissue, fecal, and seawater samples based on primer sets targeting the 16S rDNA region of the WSRLO genome. The assays proved to be reproducible and repeatable with high diagnostic specificity (99.7%) and sensitivity (100%). The detection limit of the qPCR assay was low and comparable to Burge et al. (2011), whose qPCR detection limit was 3 copies per reaction for the oyster herpesvirus gene, but was lower than that reported by Corbeil et al. (2010) for abalone herpesvirus in which the limit of detection was 30 copies. In addition, the linear dynamic range of our standard curve ranged over 7 log values. Keeling et al. (2012) and Burge et al. (2011) also reported linearity of the standard curve over 7 log values, while Corbeil et al. (2010) reported linearity over a 4 log range. Cq regression analysis illustrated the robustness of our qPCR assay, which had a high coefficient of determination (mean R2 = 0.997, SE = 0.002), acceptable efficiencies (E = 90.2 to 97.4%), and low variation within (CV = 10.33−16.25%) and among (CV = 10.85−27.98%) assays, depending on the sample type (tissue, fecal, or seawater). This low variation, paired with the lack of assay inhibition, demonstrated by the multiplexed IAC (Nolan et al. 2006), indicates that the qPCR assay was highly reproducible, precise, and robust. qPCR platforms
258
Dis Aquat Org 108: 251–259, 2014
may vary due to differences in sensitivity, dynamic itor WS-RLO gene copies and thereby enable culturrange of minimum and maximum target concentraists to detect early signs of bacterial proliferation. In tions, range of concentrations that can be measured addition, environmental fecal and seawater samples linearly, and software (Sigma-Aldrich 2008). The could provide insight into WS-RLO presence in wild necessity of testing a PCR assay on different PCR populations of abalone without handling the abalone platforms is demonstrated in Table 5, in which in all in situ, which may be very important in the conservabut 1 sample, the Opticon2 (BioRad) detected slightly tion and restoration of the many declining abalone fewer gene copies from tested samples as compared species within the range of WS (Leet et al. 2001, to those detected by the BioRad CFX96. A robust Moore et al. 2002). assay may vary among PCR platforms but remain The development and validation of PCR assays for within acceptable limits as observed with the WSWS will enable researchers to acquire a better underRLO qPCR assay developed in this study. standing of the transmission dynamics of this disease. Our qPCR assay was able to detect target DNA in This qPCR assay will allow more precise and quantimore abalone exposed to the WS-RLO than were tative monitoring of the WS-RLO, recognizing the identified as infected using histology. The qPCR proxy nature of this assay. Given that many abalone assay identified 22.5% more potentially infected species are in decline globally (e.g. 2 endangered individuals than did histology, which is similar to the species in the USA, http://ecos.fws.gov/tess_public/ results of Friedman et al. (2007) in which PCR depub/SpeciesReport.do, and 1 in Canada, www.sara tected WS-RLO DNA in 30% of exposed abalone that registry.gc.ca/species/speciesDetails_e.cfm?sid=603), did not contain visible colonies in an experiment the ability to assess the health status of threatened, using Haliotis sorenseni. As demonstrated in Table 2, endangered, or selected captive broodstock will by the time abalone reach a histology score of 1 (1−10 enable managers and conservation aquaculturists to colonies per 20× field of view), a high number of gene manage restoration and captive rearing actions. copies (1 × 10⁶) was detected. Histology scores of 2 (11−100 colonies) and 3 (>100 colonies) contained Acknowledgements. This research was funded, in part, by 3.71 and 4.85 times more copies of the WS-RLO a grant from the National Sea Grant College Program, rDNA gene than did those at a score of 1. It is imporNational Oceanic and Atmospheric Administration (NOAA), US Department of Commerce, under project numbers tant to note that DNA-based PCR assays do not deR/FISH-208 and R/F-200B through the California Sea Grant tect a viable agent or infection and serve as a proxy Program, the School of Aquatic and Fishery Sciences at the for infection or exposure, while histological examinaUniversity of Washington, and the California Department of tion shows clear evidence of infection but may not Fish and Game. We thank R. Hedrick and P. Varner for sharing rickettsial DNA, G. VanBlaricom for assistance with anienable one to discern the taxonomy of the agent mal collection, and S. Brombacker for assistance with animal (Burreson 2008, OIE 2009, Burge et al. 2011). Disparmaintenance. We also thank 3 anonymous reviewers for ity in detection between histological and PCR assays their editorial comments. The views expressed herein are may be attributed to a variety of causes such as subthose of the authors and do not necessarily reflect the views sampling error due to the small size of tissues examof NOAA or any of its sub-agencies. Any use of trade product or firm name herein is for descriptive purposes only and ined, presence of focal infections, and/or an inability does not imply endorsement by the US government. The US to detect early infections using histology. Visual congovernment is authorized to reproduce and distribute this firmation of PCR results is needed, especially when paper for governmental purposes. testing a new species, tissue, or site for a particular pathogen (Burreson 2008). LITERATURE CITED This is the first study to demonstrate that WS-RLO can be detected and quantified in abalone fecal and ➤ Altschul SF, Gish W, Miller W, Myers EW, Lipman DJ (1990) seawater samples. Our novel qPCR provides a useful, Basic local alignment search tool. J Mol Biol 215:403−410 non-lethal tool for biological monitoring of WS-RLO ➤ Altstatt JM, Ambrose RF, Engle JM, Haaker PL, Lafferty KD, Raimondi PT (1996) Recent declines of black abalone by allowing researchers to look at quantifiable bacteHaliotis cracherodii on the mainland coast of central Calrial loads and how they relate to clinical signs of disifornia. Mar Ecol Prog Ser 142:185−192 ease and mortality. Laboratory trials that track disAndree KB, Friedman CS, Moore JD, Hedrick RP (2000) A polymerase chain reaction for detection of genomic DNA ease progression in tissue, fecal and seawater samples of a Rickettsiales-like prokaryote associated with witherover time are ongoing and examine the correlation ing syndrome in black abalone (Haliotis cracherodii). between bacterial loads and clinical signs of the disJ Shellfish Res 19:213−218 ease. Abalone health experts may be able to utilize ➤ Antonio DB, Andree KB, Moore JD, Friedman CS, Hedrick RP (2000) Detection of Rickettsiales-like prokaryotes fecal and seawater DNA profiling with qPCR to mon-
Friedman et al.: qPCR assay validation of a rickettsial bacterium
➤
➤ ➤ ➤
➤
➤
➤
➤
➤
➤
➤ ➤
(RLPs) by in situ hybridization in black abalone Haliotis cracherodii with withering syndrome. J Invertebr Pathol 75:180−182 Burge CA, Strenge RE, Friedman CS (2011) Detection of the oyster herpesvirus in commercial bivalves in northern California, USA: conventional and quantitative PCR. Dis Aquat Org 94:107−116 Burreson EM (2008) Misuse of PCR assay for diagnosis of mollusc protistan infections. Dis Aquat Org 80:81−83 Bustin SA (2002) Quantification of mRNA using real-time reverse transcription PCR (RT-PCR): trends and problems. J Mol Endocrinol 29:23−39 Bustin SA, Benes V, Garson JA, Hellemans J and others (2009) The MIQE guidelines: minimum information for publication of quantitative real-time PCR experiments. Clin Chem 55:611−622 Corbeil S, Colling A, Williams LM, Wong FYK and others (2010) Development and validation of a TaqMan® PCR assay for the Australian abalone herpes-like virus. Dis Aquat Org 92:1−10 Friedman CS, Thomson M, Chun C, Haaker PL, Hedrick RP (1997) Withering syndrome of the black abalone Haliotis cracherodii (Leach): water temperature, food availability, and parasites as possible causes. J Shellfish Res 16: 403−411 Friedman CS, Andree KB, Beauchamp KA, Moore JD, Robbins TT, Shields JD, Hedrick RP (2000) ‘Candidatus Xenohaliotis californiensis’, a newly described pathogen of abalone, Haliotis spp., along the west coast of North America. Int J Syst Evol Microbiol 50:847−855 Friedman CS, Trevelyan G, Robbins TT (2003) Development of an oral administration of oxytetracycline to control losses due to withering syndrome in cultured red abalone Haliotis rufescens. Aquaculture 224:1−23 Friedman CS, Estes RM, Stokes NA, Burge CA and others (2005) Herpes virus in juvenile Pacific oysters, Crassostrea gigas from Tomales Bay, California, coincides with summer mortality episodes. Dis Aquat Org 63: 33−41 Friedman CS, Scott BB, Estes-Strenge RM, Vadopalas B, McCormick TB (2007) Oxytetracycline as a tool to manage and prevent losses of the endangered white abalone, Haliotis sorenseni, caused by withering syndrome. J Shellfish Res 26:877−885 Haaker PL, Richards DV, Friedman CS, Davis GE, Parker DO, Togstad H (1992) Mass mortality and withering syndrome in black abalone Haliotis cracherodii in California. In: Shephard SA, Tegner MJ, Guzman del Proo SA (eds) Abalone of the world. Blackwell Scientific, Oxford, p 214–224 Haaker PL, Harris SL, Taniguchi IK, Friedman CS (1995) Withering syndrome in California: Does it occur in subtidal populations? J Shellfish Res 14:267 Keeling SE, Johnston C, Wallis R, Brosnahan CL, Gudkovs N, McDonald WL (2012) Development and validation of real-time PCR for the detection of Yersinia ruckeri. J Fish Dis 35:119−125 Larionov A, Krause A, Miller W (2005) A standard curve based method for relative real time PCR data processing. BMC Bioinformatics 6:62 Le Roux F, Audemard C, Barnaud A, Berthe F (1999) DNA probes as potential tools for the detection of Marteilia refringens. Mar Biotechnol (NY) 1:588−597 Leet WS, Dewees CM, Klingbeil R, Larson EJ (2001) CaliforEditorial responsibility: Mike Hine, Fouras, France
➤
➤
➤
➤
➤
➤
➤
➤ ➤
259
nia’s living marine resources: a status report. California Department of Fish and Game Publ. SG01–11, Sacramento, CA, p 87−97 Luna LG (1968) Manual of histological staining methods of the Armed Forces Institute of Pathology, 3rd edn. McGraw-Hill, New York, NY Miner CM, Altstatt JM, Raimondi PT, Minchinton TE (2006) Recruitment failure and shifts in community structure following mass mortality limit recovery prospects of black abalone. Mar Ecol Prog Ser 327:107−117 Moore JD, Robbins TT, Friedman CS (2000) Withering syndrome in farmed red abalone Haliotis rufescens: thermal induction and association with a gastrointestinal Rickettsiales-like prokaryote. J Aquat Anim Health 12:26−34 Moore JD, Finley CA, Friedman CS, Robbins TT (2002) Withering syndrome and restoration of southern California abalone populations. Calif Coop Oceans Fish Invest Rep 43:112−119 Nolan T, Hands RE, Ogunkolade W, Bustin SA (2006) SPUD: a quantitative PCR assay for the detection of inhibitors in nucleic acid preparations. Anal Biochem 351:308−310 OIE (World Organisation for Animal Health) (2009) Manual of diagnostic tests for aquatic animals, 6th edn. OIE, Paris Pfaffl MW (2004) Quantification strategies in real-time PCR. In: Bustin SA (ed) A-Z of quantitative PCR. International University Line, La Jolla, CA, p 87–112 Rozen S, Skaletsky HJ (2000) Primer 3 on the WWW for general users and for biologist programmers. In: Krawetz S, Misener S (eds) Bioinformatics methods and protocols: methods in molecular biology, Vol. 132. Humana Press, Totowa, NJ, p 365–386 Shaw BL, Battle HI (1957) The gross and microscopic anatomy of the digestive tract of the oyster, Crassostrea virginica (Gmelin). Can J Zool 35:325−347 Sigma-Aldrich (2008) qPCR technical guide: detection methods, primer and probe design, instrumentation and applications guide. Sigma-Aldrich, St. Louis, MO Stratagene (2004) Introduction to quantitative PCR: methods and application guide. Stratagene, La Jolla, CA Thompson JD, Higgins DG, Gibson TJ (1994) CLUSTAL W: improving the sensitivity of progressive multiple sequence alignment through sequence weighting, position-specific gap penalties and weight matrix choice. Nucleic Acids Res 22:4673−4680 Vadopalas B, Bouma J, Jackels C, Friedman CS (2006) Application of quantitative PCR for simultaneous identification and quantification of larval abalone. J Exp Mar Biol Ecol 334:219−228 VanBlaricom GR, Ruediger JL, Friedman CS, Woodard DD, Hedrick RP (1993) Discovery of withering syndrome among black abalone populations at San Nicolas Island, California. J Shellfish Res 122:185−188 Vilchis LI, Tegner MJ, Moore JD, Friedman CS, Riser KL, Robbins TT, Dayton PK (2005) Effects of ocean warming on the growth, reproduction and survivorship of red and green abalones in southern California. Ecol Appl 15: 469−480 Wetchateng T, Friedman CS, Wight NA, Lee PY and others (2010) Withering syndrome in the abalone Haliotis diversicolor supertexta. Dis Aquat Org 90:69−76 Wight NA, Suzuki J, Vadopalas B, Friedman CS (2009) Development and optimization of quantitative PCR assays to aid Ostrea lurida Carpenter 1864 restoration efforts. J Shellfish Res 28:33−41 Submitted: August 8, 2013; Accepted: January 6, 2014 Proofs received from author(s): March 12, 2014