J. N. Am. Benthol. Soc., 2005, 24(4):990–1008 q 2005 by The North American Benthological Society
Development and evaluation of a diatom-based Index of Biotic Integrity for the Interior Plateau Ecoregion, USA YI-KUANG WANG1
AND
R. JAN STEVENSON2
Department of Zoology, Michigan State University, East Lansing, Michigan 48824 USA
LYTHIA METZMEIER3 Kentucky Division of Water, Frankfort, Kentucky 40601 USA Abstract. We developed an Index of Biotic Integrity (IBI) for the Interior Plateau Ecoregion (IPE), USA, which assessed effects of human disturbance on the biotic condition of stream diatom communities. We selected 7 metrics from 59 diatom attributes at reference and impaired sites (training sites), based on significant differences between site groups using the Mann–Whitney U test, high separation power, and a low coefficient of variation. We calculated IBIs by summing metrics for a site after transforming them to a discrete 1, 3, 5 scale or a continuous 0–10 scale. Both discrete and continuous scaling systems successfully separated reference and impaired sites, and IBI scores were significantly related to agricultural land use in IPE watersheds. We then tested the diatom IBI using a 2nd data set from IPE streams (test sites), processed by slightly different sampling methods and taxonomic references, and classified sites as reference or impaired based on the same criteria used for the training-site data set. Diatom IBI scores differed significantly between reference and impaired streams and correctly classified 80% of sites in the test-site data set. Compared with other diatom IBIs, our measure showed higher separation power among sites and provided an accurate characterization of stream impairment in study watersheds. The developed diatom IBI can be a useful tool for stream and watershed management. Key words: diatoms, indicators, metrics, Index of Biotic Integrity, streams, Interior Plateau Ecoregion, environmental assessment.
The US Environmental Protection Agency (USEPA) reported that 40% of streams and rivers surveyed by states in 1996 were threatened or polluted (USEPA 1998). The report identified agriculture, hydro-modification, urban runoff, and untreated waters from storm sewers as key pollution sources (USEPA 1998). All of these sources significantly affect stream ecosystem structure and function (Carpenter et al. 1998, Mac et al. 1998, Karr and Chu 1999). Pressures on aquatic resources through water use and habitat alteration are expected to increase because of increasing population (Mac et al. 1998), so effective methods of assessing stream health are urgently needed to maintain ecosystem sustainability. Indices of Biotic Integrity (IBI) have been de1 Present address: Center for General Education, Nan-Hua University, Chia-Yi, Taiwan 622, ROC. E-mail:
[email protected] 2 E-mail address:
[email protected] 3 Present address: Texas Natural Resource Conservation Commission, Houston, Texas 77023 USA. E-mail:
[email protected]
veloped to detect structural and functional differences between a test community and the reference condition (sensu Cairns 1977, Karr and Dudley 1981, Barbour et al. 1999, Stevenson and Hauer 2002). IBIs usually contain structural metrics, such as diversity indices, relative abundance of species, and pollution-sensitive species or functional groups, that respond to human disturbance (Barbour et al. 1999). This multimetric approach is effective for evaluating human disturbance (Fore et al. 1994) and has been used widely for standardizing assessment and communicating the biotic condition of streams across the USA (Barbour et al. 1996, 1999). Diatoms have a long history of use in environmental monitoring in Europe, North America, and elsewhere (Stevenson and Smol 2002), although development and use of diatom-based IBIs have been restricted to the USA (Bahls 1993, KYDOW 1993, Hill et al. 2000, Fore 2002). For example, Bahls (1993) used both the sum and minimum values of 4 diatom metrics to evaluate environmental conditions at sites. The Kentucky Division of Water (KYDOW) used the sum of 5 metrics to assess biotic integrity (KY-
990
2005]
DIATOM INDEX
OF
DOW 1993), whereas Hill et al. (2000) demonstrated the relationships of 10 periphyton metrics to environmental variables. However, none of the above, or other, studies have assessed the ability of these approaches to signal impairment. Identifying and solving environmental problems requires assessment of important ecological attributes, such as biotic condition, as well as identification of the stressors and human activities causing impairment. Most diatom-based metrics, used individually or in an IBI, have been developed to indicate abiotic stressors such as eutrophication (Pan et al. 1996), increased salinity (Blinn 1993), altered pH (Dixit et al. 1999), and climate change (Pienitz and Vincent 2000). Bioindicators of stress are valuable complements to measurements of abiotic stressors, and biotic indicators involving diatoms and other autotrophs are useful in this regard (Stevenson and Smol 2002). However, emphasis also should be placed on developing diatom indicators to assess, protect, and help restore the structure and function of ecologically important primary producers in streams. We developed diatom indicators of biotic condition and a diatom-based multimetric IBI using a data set from the Interior Plateau Ecoregion (IPE). We tested the hypothesis that diatom attributes could distinguish among streams with contrasting extents of human activity in watersheds. We selected a set of diatom metrics for a multimetric IBI and tested its ability to detect human disturbance in the watersheds as indicated (inversely) by % forested land use. We then tested the robustness of the diatom IBI using a test-site data set from the same ecoregion, but processed by different technicians and using different taxonomic references. Robustness is important because different taxonomic references have historically identified specimens (especially diatoms) to different names, and use of different technicians may reduce the precision of identifications. Last, we compared the performances of our IBI with existing diatom IBIs by comparing their relative powers to separate reference and impaired sites in the test-site data set. Methods Study area and data set used to develop the IBI The geology of the IPE is mostly limestone, with some sandstone and shale in the south-
BIOTIC INTEGRITY
991
western region (McDowell 1986). Most soils in the region were formed from limestones (Bailey and Winsor 1964). Mean annual rainfall ranges from 127 cm in the south to 101.6 cm in the north, and mean annual average temperature is 13.38C (USDA 1938). Land use in the IPE is mostly cropland and pasture with some woodland and forest (USEPA 1997). We developed the diatom-based IBI from data generated by the biological sampling program of the KYDOW. We used data from 19 impaired and 7 reference streams from the IPE (training sites; Fig. 1). We chose to use KYDOW data collected during spring (between 20 April and 15 June) from 1992 to 1995 because data were readily available in spring, and spring is the season when diatom taxa are most diverse in Kentucky streams (KYDOW 1993). Low-flow conditions and high temperature are natural stressors for diatoms during summer and autumn. Thus, impacts of nutrient enrichment and sedimentation on diatoms and periphyton may be more evident during spring than summer or autumn. Spring rains occur almost weekly and periphyton accrual may peak within 10 d after a flood (RJS, unpublished data). KYDOW personnel randomly sampled 5 rocks of similar size from stream riffles .5 d after floods. This time lag allowed periphyton recovery from disturbance. Diatoms were collected qualitatively by removing them from sampled rocks with a toothbrush. Diatoms in each sample were acidcleaned and identified using keys mainly from Patrick and Reimer (1966, 1975), and 500 valves were counted. KYDOW personnel collected multiple samples from the same sites during this period, so we randomly selected one sample from each site for the IBI training-site data set. We designated stream sites as either reference or impaired based on criteria in Mills et al. (1997) and additional landuse information. During the 1st phase of reference-site selection, we considered sites as reference if the streams had intact riparian vegetation, no towns or communities along the stream bank, no gravel-mining activity or hydrologic modification in the watershed, and no major wastewater treatment discharges. During the 2nd phase of reference-site selection, we cross-referenced past state biological and chemical data for each site and confirmed these data with field reconnaissance by KYDOW personnel. We also added the criteria that reference
992
FIG. 1.
Y.-K. WANG
ET AL.
[Volume 24
Study area and locations of sampling sites in Kentucky (USA) and the Interior Plateau Ecoregion.
sites have a 100-m forested riparian buffer zone and occur in watersheds that were .50% forested, with ,20% of the total watershed consisting of agricultural, urban, and suburban land uses. We classified all streams not meeting the above criteria as impaired sites. Reference sites showed lower average stream order, and lower total P, total N, and Cl2 concentrations than impaired sites (Table 1). Diatom attributes tested We developed the diatom IBI based on methods in USEPA rapid bioassessment protocols (Barbour et al. 1999), but with some modifications. First, we compiled a large pool of diatom attributes (potential metrics) because relatively
few attributes have been evaluated in the literature. We classified attributes into 7 categories: biotic indices, diversity indices, growth form, sensitive species, tolerant species, similarity, and taxonomic composition (Appendix 1). Second, we selected potential metrics from the set of biotic community attributes listed in Appendix 1 when they distinguished reference from impaired sites through a set of tests described below. Last, we selected final metrics from the set of potential metrics as those with the highest separation power and lowest coefficient of variation (CV). We calculated attributes in the biotic indices category based on relative abundance and autecological values of species. We determined autecological values by reviewing literature docu-
TABLE 1. Summary statistics of environmental variables for reference and impaired sites in the training-site data set (KYDOW 1993). TP 5 total P, TN 5 total N.
TP (mg/L)
TN (mg/L)
Cl2 (mg/L)
Conductivity (mS/cm)
pH
Stream order
Reference 25th percentile 50th percentile 75th percentile
0.006 0.009 0.027
0.22 0.35 0.44
2.35 3.60 5.05
197 277 369
7.7 7.9 8.2
3 3 4
Impaired 25th percentile 50th percentile 75th percentile
0.046 0.220 0.258
0.80 1.85 3.42
4.75 5.85 9.58
251 391 433
8.0 8.1 8.2
3 4 5
2005]
DIATOM INDEX
OF
menting habitat characteristics where taxa were most abundant (Lowe 1974, Bahls 1993, KYDOW 1993). We used 2 commonly applied indices, the Kentucky Diatom Pollution Tolerance Index (KYDPTI; KYDOW 1993) and the Montana Diatom Pollution Index (MTDPI; Bahls 1993), both of which are expected to decrease with increasing impairment (Stevenson and Pan 1999). Both indices are sums of products of species’ pollution-tolerance values (PTVs, ui) and the proportional relative abundance (pi) for all species (Spiui). These indices are available from us upon request (http://www.msu.edu/;rjstev). We used the Shannon Diversity index (Shannon and Weaver 1949), the Pielou evenness index (Pielou 1966), species richness, and the number of diatom genera for the diversity index category; all of these attributes are commonly used in bioassessments (Stevenson and Lowe 1986). Species diversity and evenness are hypothesized to decrease with impairment (Sheehan 1984, Odum 1985), whereas response of diatom species richness to disturbance is unpredictable and depends on the type of stressors (Patrick 1973, Stevenson 1984). Diatom growth form represents morphological adaptation to environmental conditions and community successional stages (Peterson and Stevenson 1992, Peterson 1996; see Appendix 2). We based metrics in this category on genus-level identification, assuming that species in the same genus have a similar growth form. Motile diatoms have a raphe, can move on and around silt particles and, thus, may show increased abundances in streams with high sedimentation. Erect and stalked diatoms are susceptible to hydraulic disturbance, whereas low-growing (prostrate) diatoms may indicate high grazing, hydraulic disturbance, or early diatom succession (Stevenson 1996). Last, high abundance of unattached growth forms can indicate stagnant water or presence of upstream dams. By definition, sensitive species are more abundant in reference than impaired streams, whereas tolerant species occur in relatively low abundance in reference streams and thrive in impaired streams. Thus, we hypothesized that sensitive and tolerant diatom species would decrease and increase with impairment, respectively (sensu Sheehan 1984, Rapport and Whitford 1999). We characterized species sensitivity and tolerance based on assigned PTVs from KYDPTI and MTDPI species tables. Species with
BIOTIC INTEGRITY
993
the highest PTVs (4) were designated sensitive, whereas species with the lowest PTVs (1) were designated as tolerant. We also calculated richness and relative abundance of sensitive and tolerant species. For the similarity attribute, we hypothesized that similarity between reference and impaired sites would decrease with increasing impairment (Sheehan 1984, Odum 1985, Rapport and Whitford 1999). We used 3 similarity metrics. First, we calculated the average assemblage similarity between a site and all reference sites using the Bray–Curtis index (Bray and Curtis 1957). Second, we calculated the % reference species, defined as the relative abundance of species observed in all reference sites that occurred at a site. Third, we calculated the number of distinct reference species as those species appearing primarily in reference (vs impaired) sites as identified by indicator-species analysis (Dufrene and Legendre 1997, McCune and Grace 2002). For the latter, we calculated indicator values (IV) for each species based on the product of: 1) the exclusiveness of species occurrences in a site group (relative abundance of species in that site group vs at all sites), and 2) the probability that the species would be observed at sites in that group. We assigned each species to an indicator group based on which group had the maximum IV (IVmax). We used a Monte Carlo method to determine statistical significance of IVmax and designation of a species as an indicator for the reference group (McCune and Grace 2002). For the taxonomic composition category, we hypothesized that species- and genus-level community dominance varied with impairment (Sheehan 1984, Rapport and Whitford 1999). For example, Achnanthes minutissima Ku¨tzing is a very common species in undisturbed streams (K. Manoylov and RJS, Michigan State University, unpublished data), and is expected to decrease with impairment (Stevenson and Bahls 1999). Environmental responses of taxonomic groups may be regulated by genetic and phenotypic similarities among species within genera, families, and higher-level taxa. This concept is the basis for widely used ordinal invertebrate metrics such as % Ephemeroptera, Plecoptera, and Trichoptera (see Barbour et al. 1999). Genus-based attributes summarize the average response of congeneric species to impairment; thus, the proportion of individuals in one genus
994
Y.-K. WANG
ET AL.
[Volume 24
TABLE 2. Methods for calculating scores using the 1, 3, 5 and 0–10 scaling systems (see text for details). X 5 value of the metric. 1, 3, 5 scaling Score
Calculation
Value of metric decreases with impairment 5 .25th percentile of reference sites 3 ,25th percentile of reference and .50th percentile of impaired sites 1 .50th percentile of impaired sites Value of metric increases with impairment 5 ,75th percentile of reference sites 3 .75th percentile of reference and ,50th percentile of impaired sites 1 .50th percentile of impaired sites
can be used as a genus-level attribute of biotic condition. For genera with many species in a sample, the % of species in the sample from that same genus also can be used as an attribute. We considered Achnanthes Ku¨tzing, Cocconeis Ehrenberg, Cyclotella Ku¨tzing, Cymbella Agardh, Fragilaria Lyngbye, Frustulia Rabenhorst, Gomphonema Agardh, Rhoicosphenia Grunow, and Synedra Ehrenberg to be clean-water genera, and Amphora Ehrenberg, Navicula Bory, Nitzschia Hassall, and Surirella Turpin to be genera with no clear nutrient preference (Bahls 1993; Appendix 1). We based Achnanthes and Navicula classification on Achnanthes and Navicula sensu lato (i.e., as defined before recent separation of some species into other genera; see Round 1990). We divided the % Achnanthes attribute by the sum of % of Achnanthes and Navicula in the denominator to reduce the variance of the attribute. Similarly, we divided % Cymbella by the sum of % Cymbella and Navicula.
0–10 scaling Score 10 to
Calculation (X/90th percentile of reference sites) 3 10
1 10 to
(1 2 X/90th percentile of impaired sites) 3 10
1
evaluated the separation power of potential metrics using box plots. We defined separation power as the degree of overlap between boxes (i.e., 25th and 75th quartiles) in box plots of the values of the metric for reference and impaired sites (Barbour et al. 1996, 1999). We assigned a separation power of 3 when boxes did not overlap between the 2 site groups, a value of 2 when interquartile ranges overlapped but did not reach medians, a value of 1 when only one median was within the interquartile range of the other box, and a value of 0 when both medians were within the range of the other box. We selected final metrics based on separation power and CV. We excluded metrics with separation power ,3 and CV .1. When metrics were similar to each other (e.g., % sensitive species and % number of sensitive species), we chose one based on a combination of highest separation power and lowest CV. Scaling systems and IBI calculation
Metric selection We selected diatom attributes based on the following analyses. To begin, we eliminated attributes with medians of 0 for both reference and impaired sites because low values would prevent identification of differences between these 2 site groups. We evaluated the ability of remaining attributes to separate reference and impaired sites using Mann–Whitney U tests (Mann and Whitney 1947). We identified potential metrics when these tests showed significant differences (a 5 0.05) between site groups. We
We used 2 scaling systems to normalize the ranges of metrics (Table 2). First, we used a 1, 3, 5 scaling system, which has been commonly used in developing fish and macroinvertebrate IBIs (Karr 1981, Kerans and Karr 1994, Barbour et al. 1999). For metrics that decreased with impairment, we scored sites as 5 if the value of the metric was .25th percentile of reference site values, 3 if the value was between the 25th percentile of reference and the 50th percentile of impaired site values, and 1 if the value was ,50th percentile of impaired site values. For metrics
2005]
DIATOM INDEX
OF
BIOTIC INTEGRITY
995
that increased with impairment, we scored sites as 5 if the value of the metric was ,75th percentile of reference site values, 3 if the value was between the 75th percentile of reference and the 50th percentile of impaired site values, and 1 if the value was .50th percentile of impaired site values. Second, we used a 0–10 scaling system on the ranges of metrics (sensu Hill et al. 2000). For metrics that decreased with impairment, we divided the value of the metric for each site by the 90th percentile of reference site values, and multiplied by 10. We used the 90th percentile to avoid distortion of scores by potentially extreme maximum values. For metrics that increased with impairment, we divided the metric value by the 90th percentile of impaired site values, subtracted this value from 1, and multiplied the result by 10. Total IBI values were the sums of metric scores based on each scaling system. We examined the relationship between IBI and land use in watersheds using linear regression with the training-site data set. We obtained landuse data from US Geological Survey maps (resolution 5 1:250,000), and classified landuse coverage according to the Level II classification system (Anderson et al. 1976). We defined the watershed as the upstream land surface contributing hydrologically to conditions at the sampling sites, and we derived watershed boundaries from 30 m 3 30 m digital elevation grids using digital hydrological modeling with Arc/ Info software (version 7, ESRI, Redlands, California). We used arcsine square-root transformations to normalize the proportional landuse data.
reference from impaired conditions at test sites. Criterion 1 was the 25th percentile of IBI scores at reference sites from the training-site data set, and criterion 2 was the average of the 75th percentile of IBI scores at impaired sites and the 25th percentile of IBI scores at reference sites from the training-site data set. We tested the 2 criteria independently using each scaling system. We applied the 2 criteria to the test-site data set to determine which combination of criterion and scaling system correctly classified a higher % of the impaired sites based on agreement between biological data and the a priori landuse characterizations. We also applied diatom indices from Hill et al. (2000), KYDOW (1993), and Bahls (1993) to the test-site data set to determine the relative performance of our IBI and these other indices. We tested these indices using the box-plot separation ratio, in which we divided the distance between boxes (defined by the difference between the 25th quartile of reference sites and the 75th quartile of test sites) by the median IBI score of reference sites. We included 5 diatom metrics used by Hill et al. (2000) as attributes (diatom taxa richness, % dominant taxa, % acidophilic genera, % motile genera, and % eutraphentic genera), all 5 KYDOW (1993) metrics (diatom taxa richness, Shannon Diversity index, KYDPTI, average similarity to reference sites, and % sensitive species), and all of Bahl’s (1993) metrics (Shannon Diversity index, diatom pollution index, siltation index, and similarity index) in our tests.
Independent testing of metrics and IBI
Metric selection
We tested the IBI using a different data set from a project designed to evaluate relationships among Stream Algae, Invertebrates, and Nutrients (SAIN Project). We sampled 30 SAIN sites (test sites) from the IPE in spring 1996 (Fig. 1). We cleaned diatoms with HNO32, counted 600 valves/site, and identified valves following the taxonomy of Krammer and Lange-Bertalot (1986, 1988, 1991a, b). We then compared SAIN reference and impaired test sites defined using the same criteria as used for the KYDOW training sites. We used 2 criteria to determine if IBI scores developed from training sites could distinguish
We classified 29 of the 55 diatom attributes in Appendix 1 as potential metrics after the initial evaluation (medians . 0, Mann–Whitney U test). We eliminated % Cyclotella individuals and % Frustulia individuals because the medians of both attributes were 0 for reference and impaired sites. We rejected 24 attributes (e.g., species richness and number of genera) because Mann–Whitney U tests indicated nonsignificant differences between reference and impaired sites. We then compared the 29 potential metrics, based on separation power, CV, and redundancy. We removed Kentucky (KY) % sensitive in-
Results
996
Y.-K. WANG
ET AL.
[Volume 24
TABLE 3. Seven component diatom metrics of the diatom Index of Biotic Integrity and metric values corresponding with scores based on the 1, 3, 5 scaling system, and minimum and 90th-percentile values of each metric used to calculate scores in the 0–10 scaling system (see text for details). Values were obtained from the training-site data set. KYDPTI 5 Kentucky Diatom Pollution Tolerance Index. 1, 3, 5 scoring system
0–10 scoring system
Metric
1
3
5
Minimum
90th percentile
KYDPTI KY % no. sensitive species No. of distinct reference species Average similarity to reference sites % Achnanthes/(Achnanthes 1 Navicula) % no. of Cymbella species % no. of Navicula species
,2.3 ,5.7 ,3.0
2.3–2.8 5.7–16.2 3.0–5.0
.2.8 .16.2 .5.0
2.1 0 0
3.5 21.2 8.0
,0.35
0.35–0.46
.0.46
0.24
0.54
,11.7
11.7–27.9
.27.9
0.40
85.0
,3.0 .32.0
3.0–15.0 32.0–25.0
.15.0 ,25.0
0 9.1
18.2 38.5
dividuals, KY % tolerant individuals, Montana (MT) number of tolerant species, MT % number of tolerant species, % reference species, % Achnanthes individuals, % Amphora individuals, and % Gomphonema individuals because of low separation power, and we elminated MT % tolerant individuals, % Achnanthes minutissima individuals, % Cocconeis individuals, % Cymbella/(Cymbella1Navicula), % Cymbella individuals, % Synedra individuals, % number of Synedra species, and % erect individuals because their CVs were .1. MTDPI and KYDPTI showed similar separation power and CV, so we removed MTDPI because it was redundant with KYDPTI and because KYDPTI was based on the accumulated knowledge of regional flora. We selected KY % number of sensitive species over KY number of sensitive species because the former had a lower CV. We excluded % number of Cocconeis species because only a few species occurred in the study sites. We selected % number of Navicula species over % Navicula individuals because we expected that % number of Navicula species would be more appropriate for and transferable across other ecoregions. In addition, we eliminated Shannon Diversity and evenness indices because both attributes increased with impairment, a nonpredicted response (Appendix 1). We selected 7 metrics for the IBI (Table 3), and normalized the scoring criteria of each metric based on the 1, 3, 5 and 0–10 scaling systems (Table 3) so the total IBI scores could be calculated. These metrics represented different aspects of diatom assemblages, despite being sig-
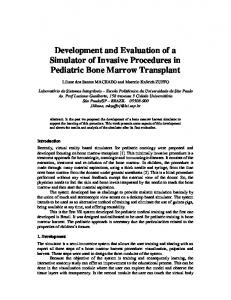
nificantly correlated (Table 4). Percent number Navicula species increased with impairment, whereas all other metrics decreased with impairment (Table 3). Box plots for each metric showed good separation between reference and impaired sites (Fig. 2). Tests of metrics and IBI Total IBI scores, calculated using either scaling system, differed significantly between reference and impaired sites in the training-site data set (Mann–Whitney U test, both p , 0.001; Fig. 3). IBI increased significantly with % forest cover in watersheds (r2 5 0.63, p , 0.001; Fig. 4). Percent forest cover also was strongly positively correlated with the component metrics, especially % number of Cymbella species, KY % number of sensitive species, and KYDPTI (Table 5). IBI and its component metrics were strongly negatively correlated with % agriculture land use (Table 5), but were not correlated with % urban land use in watersheds (p . 0.05). Application of the IBI, calculated using either scaling system, and criteria developed from the training sites to the test-site data set indicated significant differences between reference and impaired sites (Mann–Whitney U test, both p , 0.001; separation power 5 3; Figs 5, 6). The critical values of criterion 1 (the average of the 75th percentile of the impaired sites and the 25th percentile of the reference sites) were 39.5 and 25.0 for the 0–10 and 1, 3, 5 scoring systems, respectively. Twenty-four of 30 (80%) sites were cor-
2005]
DIATOM INDEX
OF
BIOTIC INTEGRITY
997
TABLE 4. Pairwise correlations among component diatom metrics of the diatom Index of Biotic Integrity. KYDPTI 5 Kentucky Diatom Pollution Tolerance Index, Ach 5 Achnanthes, Nav 5 Navicula. * 5 p , 0.05, ** 5 p , 0.01, *** 5 p , 0.001.
Metric KY % no. of sensitive species No. of distinct reference species Average similarity to reference sites % Ach/(Ach 1 Nav) % no. of Cymbella species % no. of Navicula species
KYDPTI
KY % no. of sensitive species
No. of distinct reference species
Average similarity to reference sites
% Ach/ (Ach 1 Nav)
% no. of Cymbella species
0.77*** 0.58**
0.87***
0.47*
0.65***
0.54**
0.55** 0.79***
0.63*** 0.96***
0.56** 0.83***
20.68***
20.74***
rectly classified under the 0–10 scoring system based on criterion 1. Four impaired sites were classified as reference sites. Twenty-five of 30 (83%) sites were correctly classified under the 1, 3, 5 system based on criterion 1. Three reference sites were classified as impaired. The critical values of criterion 2 (the 25th percentile of the reference condition) were 47.5 and 29 for the 0– 10 system and 1, 3, 5 system, respectively. Many of the reference sites in the test-site data set were misclassified as impaired when criterion 2 was used. Twenty of 30 (67%) sites were correctly categorized under the 0–10 system based on criterion 2. Only 18 of 30 sites (60%) were correctly classified under the 1, 3, 5 scoring system based on criterion 2. Therefore, we used criterion 1 to distinguish reference and impaired test sites. The 3 IBIs from the literature (Hill et al. 2000, KYDOW 1993, Bahls 1993) indicated significant differences between reference and impaired test sites; however, the box-separation ratios of these 3 indices were lower than that of our IBI (Table 6). Two component metrics of the KYDOW (1993) IBI (Shannon Diversity index and species richness) gave the opposite of expected responses to human disturbance (i.e., increased with impairment [as % agriculture]; r 520.61, p , 0.01; r 520.27, p . 0.05, respectively). The separation power of the 2 other component metrics of the KYDOW (1993) IBI (KYDPTI and average similarity to reference sites) was 3. Except for the Shannon Diversity index, component met-
20.55**
0.34 0.65***
0.60**
20.75***
20.61**
20.79***
rics in the Bahls (1993) IBI (average similarity to reference sites, siltation index, and MTDTI) successfully separated reference from impaired test sites. One component metric of the Hill et al. (2000) IBI (% dominant taxa) gave the opposite of expected response to human disturbance (higher values for reference than impaired sites). The separation power of 2 other component metrics in the Hill et al. (2000) IBI (taxa richness and acidophilic genera) was 1. The separation power of the remaining 2 component metrics of the Hill et al. (2000) IBI (eutraphentic genera and motile genera) was 3. Discussion The diatom IBI that we developed for the IPE separated reference from impaired sites in both training-site and test-site data sets. IBI scores were good indicators of impairment caused by human disturbance, as measured by % forested land use in the watershed. Moreover, our diatom IBI was more powerful than 3 existing indices when applied to streams in the IPE. Criterion development and assessment of impairment Criteria for distinguishing reference and impaired sites or contrasting biological conditions at sites (e.g., good, fair, poor) using IBIs or single metrics may be established with many methods, including levels desired by the public, percentiles of frequency distributions of condi-
998
Y.-K. WANG
ET AL.
[Volume 24
FIG. 2. Box plots of component diatom metrics for reference and impaired sites in the training-site data set (Table 3). Boxes show interquartile ranges (25th and 75th percentiles), middle lines are medians, whiskers are 1.5 interquartile ranges beyond the boxes, and dots are outliers. KYDPTI 5 Kentucky Diatom Pollution Tolerance Index, Ach 5 Achnanthes, Nav 5 Navicula, ref 5 reference.
2005]
DIATOM INDEX
OF
BIOTIC INTEGRITY
999
FIG. 4. Relationship between Index of Biotic Integrity (IBI) score from the training-site data set and % forest cover in watersheds (% forest).
creasing sample sizes. An extensive discussion of misclassification and evaluation of criteriondeveloping methods is beyond the scope of our paper, but an evaluation of the causes of misclassification in our test-site data set indicated several sources of error and possible remedies. The 1st type of misclassification, characterizing reference sites as impaired, occurred when the biotic integrity of several misclassified sites was underestimated during IBI validation with the test-site data. This type of error may have FIG. 3. Box plots of total Index of Biotic Integrity (IBI) scores of reference sites and impaired sites in the training-site data set. Description of box plots as in Fig. 2. A.—1, 3, 5 scaling system. B.—0–10 scaling system.
tions at all sites or reference sites, or thresholds in stressor–response relationships (Stevenson et al. 2004). We found fewer misclassifications of reference and impaired sites in the test-site data set when the criterion was the average of IBIs for the 25th percentile of reference site values and 75th percentile of impaired site values than when the criterion was the IBI for the 25th percentile of reference site values alone. The latter method of criterion development is more standard than the former (Barbour et al. 1999). The sample size in the training-site data set was only 26, and the difference between misclassification rates of the 2 methods may decrease with in-
TABLE 5. Pearson correlation coefficients between the diatom Index of Biotic Integrity (IBI) and its component diatom metrics and % land use in test-site watersheds. KYDPTI 5 Kentucky Diatom Pollution Tolerance Index, Ach 5 Achnanthes, Nav 5 Navicula. * 5 p , 0.05, ** 5 p , 0.01, *** 5 p , 0.001. Metric IBI KYDPTI KY % no. of sensitive species No. of distinct reference species Average similarity to reference sites % Ach/(Ach 1 Nav) % no. of Cymbella species % no. of Navicula species
% forest
% agriculture
0.82*** 0.69*** 0.80***
20.75*** 20.73*** 20.63***
0.64***
20.49*
0.52**
20.50**
0.55** 0.84***
20.47* 20.71***
20.69***
0.70***
1000
Y.-K. WANG
ET AL.
[Volume 24
FIG. 5. Box plots of component diatom metrics for reference and impaired sites of the test-site data set (Table 3). Description of box plots as in Fig. 2. KYDPTI 5 Kentucky Diatom Pollution Tolerance Index, Ach 5 Achnanthes, Nav 5 Navicula, ref 5 reference.
2005]
DIATOM INDEX
OF
BIOTIC INTEGRITY
1001
TABLE 6. Box separation ratios of diatom Indices of Biotic Integrity (IBI) from our study based on the 1, 3, 5 scaling system and the 0–10 scaling system, Bahls (1993), Kentucky Division of Water (KYDOW 1993), and Hill et al. (2000, diatom metrics only). Box separation ratios were calculated for the test-site data set (see text for details).
FIG. 6. Box plots of total Index of Biotic Integrity (IBI) score of reference sites and impaired sites from the test-site data set. Description of box plots as in Fig. 2. A.—1, 3, 5 scaling system. B.—0–10 scaling system.
occurred for several reasons. First, geographical and temporal variation in environmental conditions and variable taxonomy may decrease the separation power of the number of distinct reference species. We elected to retain the number of distinct reference (native) species in our IBI because this attribute, more than other metrics, is probably highly valued by citizens. However, the separation power of the number of distinct reference species decreased from 3 with the training-site data set to 2 with the test-site data set, regardless of which scaling system was used.
IBI
Box separation ratio
Our study: 0–10 system Our study: 1, 3, 5 system Bahls (1993) KYDOW (1993) Hill et al. (2000)
0.14 0.15 0.03 0 0
Second, samples in the training-site and testsite data sets were analyzed by different technicians who used different taxonomic references. Rapid changes in diatom nomenclature present a challenge to ecologists in bioassessment (Kociolek and Stoermer 2001, Stoermer 2001). Such taxonomic inconsistency should reduce precision and accuracy of metrics that use few sensitive species. However, cross-referenced taxonomic data bases containing names, illustrations and photographs, keys, and literature citations can reduce taxonomic inconsistency (e.g., see US Geological Survey National Water-Quality Assessment Program taxonomy workshops; http://diatom.acnatsci.org/nawqa/). Despite these potential taxonomic problems, our IBI separated reference from impaired sites with higher statistical significance and consistency than those of previously published diatom IBIs. Third, misclassification of reference sites as impaired could have resulted from highly correlated metrics that multiplied effects of small changes in biological condition. This type of error is difficult to check, but it may be corrected if measurements or indicators of stressor conditions do not exceed criteria. Multiple lines of evidence, such as examining responses of fish and/or invertebrate metrics in the same sites, also could be used to help validate classifications. The 2nd type of misclassification, characterizing impaired sites as reference sites, can be corrected a posteriori by using 2 methods. First, a site could be classified as impaired on the basis of one component metric that was below a critical value or percentile (1-metric criterion). For example, 2 test sites misclassified as reference
1002
Y.-K. WANG
sites had KYDPTI values ,3 (using the 1, 3, 5 scaling system). We could choose to reclassify these sites as impaired based on a 1-metric criterion. Second, we could tally the number of component metrics below certain values or percentiles for each site and then reclassify sites as impaired if too few component metrics met the criteria. For example, we could have correctly classified 2 test sites as impaired had we checked for sites with $3 metrics with low scores (e.g., score of 1 using the 1, 3, 5 scaling system). IBI development We included both genus- and species-based attributes in our metrics. An obvious advantage of using genus-based metrics is the relative ease of identifying diatom genera vs species; however, use of genera is conservative and may mask responses of individual species, which may have different environmental optima, sensitivities, and tolerances (Hill et al. 2001). Hill et al. (2001) found that several genus-based metrics discriminated environmental conditions with no loss of power compared with speciesbased metrics, although fewer environmental contrasts could be inferred by suites of genera than suites of species. We found that genusbased metrics, such as % number of Cymbella species, were good indicators of biotic conditions in the IPE. However, these metrics may be most suitable for regional use in specific aquatic habitats in small geographic areas, rather than for national or international use because the number of species/genera is likely to be correlated with the size and habitat diversity of the region. In this context, the likelihood of all congeneric species responding similarly to impairment should be inversely related to size of the regions studied. Thus, genus-based metrics may not be as transferable among regions as speciesbased metrics. For example, in our study, % Achnanthes individuals (we present this simple metric rather than the more complex metric Achnanthes/[Achnanthes1Navicula] for ease of comparison) decreased with impairment, which was negatively correlated with % forested land use. In contrast, in Europe, Kelly (1998) classified Achnanthes as a genus that prefers median nutrient levels. Nevertheless, genus-based metrics may be potentially useful environmental indicators, particularly for some stressors and with-
ET AL.
[Volume 24
in regions where sets of congeneric species respond similarly to impairment (Hill et al. 2001). Shannon Diversity and species richness are commonly used as metrics in diatom-based environmental assessments (Bahls 1993, KYDOW 1993, Hill et al. 2001), despite their variable relationships with pollution (Stevenson and Pan 1999). For example, Archibald (1972) and van Dam (1982) both found that Shannon Diversity increased with impairment (as was the case in our study), whereas Stevenson (1984) reported that diversity did not change with increasing pollution. This variable relationship probably results from several factors, including different effects of pollution on evenness, standard counting methods that provide poor estimates of species richness, and low natural richness in some habitats (Patrick et al. 1954, Stevenson and Lowe 1986, McCormick and Odell 1996; see review in Stevenson and Smol 2002). Thus, responses of diversity indices to stressors probably depend on the type and severity of pollution, and may be too unpredictable for use in general assessment. However, we did find the number of distinct reference taxa was a good metric for our IBI as long as we limited consideration to reference species. This metric is different from total species richness because it constrains the species counted to those that occurred in reference conditions. Constraining richness estimates to species with special attributes may improve reliability of metrics. We recommend using the 0–10 scaling system for IBI scoring because of its fine scale (Hill et al. 2000). We observed no distinct difference in correct assessment of sites using the 1, 3, 5 vs 0–10 scaling systems, but the 0–10 system is analytically simpler to compute and, thus, easier for naı¨ve users to implement accurately. Comparison between multimetric IBI and single metrics The advantages of using a multimetric system over a univariate assessment include: 1) the assumed greater certainty of multimetrics in detecting impairment, and 2) the transferability of multimetrics among habitats both within and among regions (Barbour et al. 1999). Our multimetric diatom IBI had a higher separation power and lower CV than all single metrics except the KYDPTI when applied to the test-site data set. Ideally, multimetric indices should be
2005]
DIATOM INDEX
OF
constructed to reflect multiple types of stressors occurring within the region of interest. Multimetric systems can provide more thorough integration of the overall system condition (Gerritsen 1995) because no single metric is sensitive to all types of stressors (Karr 1999). Moreover, multimetrics can compensate for erroneous responses of a few metrics, and may incorporate metrics related to multiple ecological attributes that are valued by both decision makers and stakeholders. We believe that high correlations among metrics within our diatom IBI were caused by the dominance of a single covarying set of stressors from agricultural land use in our study region. In our study, fewer streams would have been misclassified had we used more than just the multimetric IBI in the assessment. A potential consequence of using a multimetric IBI is that it can mask responses of individual metrics because of averaging (Suter 1993). We recommend developing a new approach that better characterizes biological condition at a site. Meaningful metrics that represent different ecological conditions should be examined. Then each metric should be weighted in the total IBI score. An individual criterion could be based on a metric indicating a valued ecological attribute of sufficient public or ecological concern that merits specific management attention (Campbell 2001). For example, low scores of metrics, such as KYDPTI and % number of sensitive taxa, that are highly correlated with % forested land use in the watershed could be used to set the minimum criteria for water-quality standards. The number of metrics not meeting predefined benchmarks could be used as another criterion. Different management actions, ranging from further study to restoration or protection, could be triggered by different kinds of violations. Correct classification of sites in the IPE could be improved by establishing minimum acceptable criteria for individual ecologically significant metrics as well as diatom-based IBI scores. More extensive study of periphyton assemblages with all algae and algal functional groups could provide useful indices of periphyton function (Niyogi et al. 2002). We must address the value of the ecological structure and function of periphyton assemblages more directly and develop means of assessing those attributes. We suggest that scores of multimetric indices should be used primarily to summarize overall
BIOTIC INTEGRITY
1003
ecological conditions and communicate results. Distinguishing between metrics of valued ecological attributes and metrics diagnosing stressors provides resource managers with specific information, management targets, and strategies for action. Acknowledgements We thank the Kentucky Division of Water for gathering, organizing, and sharing data, Andrew Alverson, Vanessa Lougheed, Kalina Manoylova, Scott Rollins, and Lei Zheng for helpful comments on the manuscript, and Robert Forbes for help with the GIS analysis. The SAIN Project was supported by the Water and Watershed Program (US Environmental Protection Agency, Star Program, Agreement #R824783). Literature Cited ANDERSON, J. R., E. E. HARDY, J. T. ROACH, AND R. E. WITMER. 1976. A land use and land cover classification system for use with remote sensor data. Professional Paper 964. US Geological Survey, Reston, Virginia. ARCHIBALD, R. E. M. 1972. Diversity in some South Africa diatom assemblages and its relation to water quality. Water Research 6:1229–1238. BAHLS, L. L. 1993. Periphyton bioassessment methods for Montana streams. Montana Department of Health and Environmental Sciences, Helena, Montana. (Available from: Montana Department of Health and Environmental Sciences, Helena, Montana 59620 USA.) BAILEY, H. H., AND J. H. WINSOR. 1964. Kentucky soils. University of Kentucky Agricultural Experiment Station, Lexington, Kentucky. (Available from: University of Kentucky Agricultural Experiment Station, Lexington, Kentucky 40601 USA.) BARBOUR, M. T., J. GERRITSEN, G. E. GRIFFITH, R. FRYDENBORG, E. MCCARRON, J. S. WHITE, AND M. L. BASTIAN. 1996. A framework for biological criteria for Florida streams using benthic macroinvertebrates. Journal of the North American Benthological Society 15:185–211. BARBOUR, M. T., J. GERRITSEN, B. D. SNYDER, AND J. B. STRIBLING. 1999. Rapid bioassessment protocols for use in wadeable streams and rivers. EPA 841B-99-002. Office of Water, US Environmental Protection Agency, Washington, DC. BLINN, D. W. 1993. Diatom community structure along physicochemical gradients in saline lakes. Ecology 74:1246–1263. BRAY, J. R., AND J. T. CURTIS. 1957. An ordination of
1004
Y.-K. WANG
the upland forest communities of southern Wisconsin. Ecological Monographs 26:325–349. CAIRNS, J. 1977. Quantification of biological integrity. Pages 171–187 in R. K. Ballentine and L. J. Guarria (editors). Integrity of water. US Environmental Protection Agency, Washington, DC. CAMPBELL, D. E. 2001. Proposal for including what is valuable to ecosystems in environmental assessments. Environmental Science and Technology 35: 2867–2873. CARPENTER, S. R., N. F. CARACO, D. L. CORRELL, R. W. HOWARTH, A. N. SHARPLEY, AND V. H. SMITH. 1998. Nonpoint pollution of surface waters with phosphorus and nitrogen. Ecological Applications 8:559–568. DIXIT, S. S., J. P. SMOL, D. F. CHARLES, R. M. HUGHES, S. G. PAULSEN, AND G. B. COLLINS. 1999. Assessing water quality changes in the lakes of the Northeastern United States using sediment diatoms. Canadian Journal of Fisheries and Aquatic Sciences 56:131–152. DUFRENE, M., AND P. LEGENDRE. 1997. Species assemblages and indicator species: the need for a flexible asymmetrical approach. Ecological Monographs 67:345–366. FORE, L. S. 2002. Using diatoms to assess the biological condition of large rivers in Idaho (USA). Freshwater Biology 47:2015–2037. FORE, L. S., J. R. KARR, AND L. L. CONQUEST. 1994. Statistical properties of an index of biological integrity used to evaluate water resources. Canadian Journal of Fisheries and Aquatic Sciences 51: 1077–1087. GERRITSEN, J. 1995. Additive biological indices for resource management. Journal of the North American Benthological Society 14:451–457. HILL, B. H., A. T. HERLIHY, P. R. KAUFMAN, R. J. STEVENSON, F. H. MCCORMICK, AND C. B. JOHNSON. 2000. Use of periphyton assemblage data as an index of biotic integrity. Journal of the North American Benthological Society 19:50–67. HILL, B. H., R. J. STEVENSON, Y. PAN, A. H. HERLIHY, P. R. KAUFMANN, AND C. B. JOHNSON. 2001. Comparison of correlations between environmental characteristics and stream diatom assemblages characterized at genus and species levels. Journal of the North American Benthological Society 20: 299–310. KARR, J. R. 1981. Assessment of biotic integrity using fish communities. Fisheries 6(6):21–27. KARR, J. R. 1999. Defining and measuring river health. Freshwater Biology 41:221–234. KARR, J. R., AND E. W. CHU. 1999. Sustaining living rivers. Hydrobiologia 422/423:1–14. KARR, J. R., AND D. R. DUDLEY. 1981. Ecological perspective on water quality goals. Environmental Management 5:55–68. KELLY, M. G. 1998. Use of the trophic diatom index to
ET AL.
[Volume 24
monitor eutrophication in rivers. Water Research 32:236–242. KERANS, B. L., AND J. R. KARR. 1994. Development and testing of a benthic index of biotic integrity (B-IBI) for rivers of the Tennessee Valley. Ecological Applications 4:768–785. KOCIOLEK, J. P., AND E. F. STOERMER. 2001. Taxonomy and ecology: a marriage of necessity. Diatom Research 16:433–442. KRAMMER, K., AND H. LANGE-BERTALOT. 1986. Bacillariophyceae, Teil 1: Naviculaceae. Gustav Fischer Verlag, Stuttgart, Germany. KRAMMER, K., AND H. LANGE-BERTALOT. 1988. Bacillariophyceae, Teil 2: Bacillariaceae, Epithemiaceae, and Surirellaceae. Gustav Fischer Verlag, Stuttgart, Germany. KRAMMER, K., AND H. LANGE-BERTALOT. 1991a. Bacillariophyceae, Teil 3: Centrales, Fragilariaceae, and Eunotiaceae. Gustav Fischer Verlag, Stuttgart, Germany. KRAMMER, K., AND H. LANGE-BERTALOT. 1991b. Bacillariophyceae, Teil 4: Achnanthaceae. Gustav Fischer Verlag, Stuttgart, Germany. KYDOW (KENTUCKY DIVISION OF WATER). 1993. Methods for assessing biological integrity of surface waters. Kentucky Department of Environmental Protection, Frankfort, Kentucky. (Available from: Kentucky Department of Environmental Protection, 14 Reilly Road, Frankfort, Kentucky 40601 USA.) LOWE, R. L. 1974. Environmental requirements and pollution tolerance of freshwater diatoms. EPA670/4-74-005. US Environmental Protection Agency, Cincinnati, Ohio. MAC, M. J., P. A. OPLER, C. E. PUCKETT HAECKER, AND P. D. DORAN. 1998. Status and trends of the nation’s biological resources. Volume 1. US Geological Survey, US Department of the Interior, Reston, Virginia. (Available from: http://biology. usgs.gov/s1t/SNT/) MANN, H. B., AND D. R. WHITNEY. 1947. On a test of whether one of two random variables is stochastically larger than the other. Annals of Mathematical Statistics 18:50–60. MCCORMICK, P. V., AND M. B. O’DELL. 1996. Quantifying periphyton responses to phosphorus in the Florida Everglades: a synoptic–experimental approach. Journal of North American Benthological Society 15:450–468. MCCUNE, B., AND J. B. GRACE. 2002. Analysis of ecological communities. MjM software design, Gleneden Beach, Oregon. MCDOWELL, R. C. 1986. The geology of Kentucky: a text to accompany the geologic map of Kentucky. US Geological Survey, US Department of the Interior, Reston, Virginia. (Available from: US Geological Survey, US Department of the Interior,
2005]
DIATOM INDEX
OF
12201 Sunrise Valley Drive, Reston, Virginia 20192 USA.) MILLS, M. R., R. E. HOUP, J. F. BRUMLEY, AND K. L. SMATHERS. 1997. Reference reach fish community. Technical Report No. 52. Division of Water, Kentucky Department for Environmental Protection, Frankfort, Kentucky. (Available from: Division of Water, Kentucky Department for Environmental Protection, 14 Reilly Road, Frankfort, Kentucky 40601 USA.) NIYOGI, D. K., W. M. LEWIS,JR., AND D. M. MCKNIGHT. 2002. Effects of stress from mine drainage on diversity, biomass, and function of primary producers in mountain streams. Ecosystems 5:554–567. ODUM, E. P. 1985. Trends expected in stressed ecosystems. BioScience 35:419–422. PAN, Y., R. J. STEVENSON, B. HILL, A. HERLIHY, AND G. COLLINS. 1996. Using diatoms as indicators of ecological conditions in lotic systems: a regional assessment. Journal of North American Benthological Society 15:481–495. PATRICK, R. 1973. Use of algae, especially diatoms, in the assessment of water quality. Pages 46–95 in J. Cairns and K. L. Dickson (editors). Biological methods for the assessment of water quality. ASTM STP 528. American Society for Testing and Materials, Philadelphia, Pennsylvania. PATRICK, R., M. H. HOHN, AND J. H. WALLACE. 1954. A new method for determining the pattern of the diatom flora. Notulae Natureae No. 259. Academy of Natural Sciences of Philadelphia, Phildelphia, Pennsylvania. PATRICK, R., AND C. W. REIMER. 1966. The diatoms of the United States. Volume 1. Academy of Natural Sciences of Philadelphia, Philadelphia, Pennsylvania. PATRICK, R., AND C. W. REIMER. 1975. The diatoms of the United States. Volume 2. Academy of Natural Sciences of Philadelphia, Philadelphia, Pennsylvania. PETERSON, C. G. 1996. Response of benthic algal communities to natural physical disturbance. Pages 375–403 in R. J. Stevenson, M. L. Bothwell, and R. L. Lowe (editors). Algal ecology: freshwater benthic ecosystems. Academic Press, New York. PETERSON, C. G., AND R. J. STEVENSON. 1992. Resistance and resilience of lotic algal communities: importance of disturbance timing and current. Ecology 73:1445–1461. PIELOU, E. C. 1966. The measurement of diversity in different types of biological collections. Journal of Theoretical Biology 13:131–144. PIENITZ, R., AND W. F. VINCENT. 2000. Effect of climate change relative to ozone depletion on UV exposure in subarctic lakes. Nature 404:484–487. RAPPORT, D. J., AND W. G. WHITFORD. 1999. How ecosystems respond to stress. BioScience 49:193–203. ROUND, E. F. 1990. The diatoms: biology and mor-
BIOTIC INTEGRITY
1005
phology of the genera. Cambridge University Press, Cambridge, UK. SHANNON, C. E., AND W. WEAVER. 1949. The mathematical theory of communication. University of Illinois Press, Urbana, Illinois. SHEEHAN, P. J. 1984. Effects on community and ecosystem structure and dynamics. Pages 51–99, 147–190 in P. J. Sheehan, D. R. Miller, G. C. Butler, and Ph. Bourdeau (editors). Effects of pollutants at the ecosystem level. SCOPE 22. Scientific Committee on Problems of the Environment (SCOPE), International Council of Scientific Unions (ICSU). John Wiley and Sons, Chichester, UK. STEVENSON, R. J. 1984. Epilithic and epipelic diatoms in the Sandusky River, with emphasis on species diversity and water quality. Hydrobiologia 114: 161–175. STEVENSON, R. J. 1996. An introduction to algal ecology in freshwater benthic habitats. Pages 3–30 in R. J. Stevenson, M. L. Bothwell, and R. L. Lowe (editors). Algal ecology: freshwater benthic ecosystems. Academic Press, New York. STEVENSON, R. J., AND L. L. BAHLS. 1999. Periphyton protocols. Pages 6–1 to 6–22 in M. T. Barbour, J. Gerritsen, B. D. Snyder, and J. B. Stribling. Rapid bioassessment protocols for use in streams and wadeable rivers: periphyton, benthic macroinvertebrates, and fish. 2nd edition. EPA 841-B-99-002. Office of Water, US Environmental Protection Agency, Washington, DC. STEVENSON, R. J., B. C. BAILEY, M. C. HARASS, C. P. HAWKINS, J. ALBA-TERCEDOR, C. COUCH, S. DYER, F. A. FULK, J. M. HARRINGTON, C. T. HUNSAKER, AND R. K. JOHNSON. 2004. Interpreting results of ecological assessments. Pages 85–111 in M. T. Barbour, S. B. Norton, H. R. Preston, and K. W. Thornton (editors). Ecological assessment of aquatic resources: linking science to decisionmaking. Society of Environmental Toxicology and Chemistry, Pensacola, Florida. STEVENSON, R. J., AND F. R. HAUER. 2002. Integrating Hydrogeomorphic and Index of Biotic Integrity approaches for environmental assessment of wetlands. Journal of the North American Benthological Society 21:502–513. STEVENSON, R. J., AND R. L. LOWE. 1986. Sampling and interpretation of algal patterns for water quality assessments. Pages 118–149 in B. G. Isom (editor). Rationale for sampling and interpretation of ecological data in the assessment of freshwater ecosystems. ASTM STP 894. American Society Testing and Materials, Philadelphia, Pennsylvania. STEVENSON, R. J., AND Y. PAN. 1999. Assessing environmental conditions in rivers and streams with diatoms. Pages 11–40 in E. F. Stoermer and J. P. Smol (editors). The diatoms: applications for the environmental and earth sciences. Cambridge University Press, Cambridge, UK.
1006
Y.-K. WANG
STEVENSON, R. J., AND J. P. SMOL. 2002. Use of algae in environmental assessments. Pages 775–804 in J. D. Wehr and R. G. Sheath (editors). Freshwater algae of North America: ecology and classification. Academic Press, New York. STOERMER, E. F. 2001. Diatom taxonomy for paleolimnologists. Journal of Paleolimnology 25:393–398. SUTER, G. W. 1993. A critique of ecosystem health concepts and indices. Environmental Toxicology and Chemistry 12:1533–1539. USDA (US DEPARTMENT OF AGRICULTURE). 1938. Soils and man: 1938 yearbook of agriculture. US Department of Agriculture, Washington, DC. USEPA (US ENVIRONMENTAL PROTECTION AGENCY). 1997. Level III ecoregions of the continental Unit-
ET AL.
[Volume 24
ed States (revision of Omernik 1987). National Health and Environmental Effects Research Laboratory, US Environmental Protection Agency, Corvallis, Oregon. (Available from: http://www. epa.gov/wed/pages/ecoregions/levelpiii.htm) USEPA (US ENVIRONMENTAL PROTECTION AGENCY). 1998. 1998 National water quality inventory report to Congress. EPA 841-F-00-006. Office of Water, US Environmental Protection Agency, Washington, DC. VAN DAM, H. 1982. On the use of measures of structure and diversity in applied diatom ecology. Nova Hedwigia 73:97–115. Received: 19 March 2003 Accepted: 7 March 2005
APPENDIX 1. Diatom population and community attributes, their descriptions, and their expected response (R) to impairment. KYDPTI 5 Kentucky Diatom Pollution Tolerance Index, MTDPI 5 Montana Diatom Pollution Index, 1 5 attribute expected to increase with impairment, 2 5 attribute expected to decrease with impairment, V 5 variable response.
Attributes/Metric
Taxonomic level
Biotic index KYDPTI
Species
MTDPI
Species
Description
R
Weighted average of average abundance and tolerance value Weighted average of relative abundance and tolerance value
2 2
Diversity index Shannon Diversity Evenness index Species richness No. of genera
Species Species Species Genus
Measure of evenness and richness Measure of species composition evenness Number of species in the count Number of genera in the count
2 2 V 2
Growth form % prostrate individuals % erect individuals % stalked individuals % unattached individuals % motile individuals
Genus Genus Genus Genus Genus
Relative Relative Relative Relative Relative
1 2 V 1 1
Sensitive species KY % sensitive individuals KY no. of sensitive species KY % no. of sensitive species
Species Species Species
2 2 2
MT % sensitive individuals MT no. of sensitive species MT % no. of sensitive species
Species Species Species
No. of distinct reference species
Species
Relative abundance of KYDPTI sensitive species No. of KYDPTI sensitive species % of no. of sensitive species to total no. of species in the count Relative abundance of MTDPI sensitive species No. of MTDPI sensitive species % of no. of sensitive species to total no. of species in the count No. of species found primarily in reference sites Relative abundance of KYDPTI tolerant species No. of KYDPTI tolerant species % of no. of tolerant species to total no. of species in the count
1 1 1
Tolerant species KY % tolerant individuals KY no. of tolerant species KY % no. of tolerant species
Species Species Species
abundance abundance abundance abundance abundance
of of of of of
prostrate genera erect genera stalked genera unattached genera motile genera
2 2 2 2
2005]
DIATOM INDEX
OF
BIOTIC INTEGRITY
1007
APPENDIX 1. Continued.
Attributes/Metric MT % tolerant individuals MT no. of tolerant species MT % no. of tolerant species Similarity Average similarity to reference sites
Taxonomic level
Description
R
Species Species Species
Relative abundance of MTDPI tolerant species No. of MTDPI tolerant species % of no. of tolerant species to total no. of species in the count
1 1 1
Species
Mean Bray–Curtis similarity in species composition to reference sites % of species found in reference sites that occurred in impaired sites No. of species found primarily in reference sites not in impaired sites
2
Relative abundance of Achnanthes minutissima Ratio of Achnanthes to Achnanthes and Navicula combined Ratio of Cymbella to Navicula and Cymbella combined Relative abundance of dominant species Relative abundance of Achnanthes Relative abundance of Amphora Relative abundance of Cocconeis Relative abundance of Cyclotella Relative abundance of Cymbella Relative abundance of Fragilaria Relative abundance of Frustulia Relative abundance of Gomphonema Relative abundance of Navicula Relative abundance of Nitzschia Relative abundance of Rhoicosphenia Relative abundance of Surirella Relative abundance of Synedra % of no. of Achnanthes species % of no. of Amphora species % of no. of Cocconeis species % of no. of Cyclotella species % of no. of Cymbella species % of no. of Fragilaria species % of no. of Frustulia species % of no. of Gomphonema species % of no. of Navicula species % of no. of Nitzschia species % of no. of Rhoicosphenia species % of no. of Surirella species % of no. of Synedra species
2 2
% reference species
Species
No. of distinct reference species
Species
Taxonomic composition % Achnanthes minutissima individuals % Achnanthes/(Achnanthes 1 Navicula)
Species Genus
% Cymbella/(Cymbella 1 Navicula)
Genus
% % % % % % % % % % % % % % % % % % % % % % % % % % %
Species Genus Genus Genus Genus Genus Genus Genus Genus Genus Genus Genus Genus Genus Genus Genus Genus Genus Genus Genus Genus Genus Genus Genus Genus Genus Genus
dominant species Achnanthes individuals Amphora individuals Cocconeis individuals Cyclotella individuals Cymbella individuals Fragilaria individuals Frustulia individuals Gomphonema individuals Navicula individuals Nitzschia individuals Rhoicosphenia individuals Surirella individuals Synedra individuals no. of Achnanthes species no. of Amphora species no. of Cocconeis species no. of Cyclotella species no. of Cymbella species no. of Fragilaria species no. of Frustulia species no. of Gomphonema species no. of Navicula species no. of Nitzschia species no. of Rhoicosphenia species no. of Surirella species no. of Synedra species
2 2
2 1 2 V 2 1 2 2 2 2 V V 2 V 2 2 V 2 2 2 2 2 2 V V 2 V 2
1008
Y.-K. WANG
APPENDIX 2. Classifications of growth form and motility for diatom genera. P 5 prostrate, E 5 erect, S 5 stalked, U 5 unattached, V 5 variable, M 5 motile.
Genus
Growth form
Achnanthes Amphipleura Amphora Anomoeoneis Asterionella Biddulphia Caloneis Cocconeis Cyclostephanos Cyclotella Cymatopleura Cymbella Denticula Diatoma Diploneis Epithemia Eunotia Fragilaria Frustulia Gomphoneis Gomphonema
P P P P U E P P U U P, M S P U P P E V P S S
Genus
Growth form
Gyrosigma Hannaea Hantzschia Melosira Meridion Navicula Neidium Nitzschia Opephora Pinnularia Rhoicosphenia Rhopalodia Simonsenia Stauroneis Stenopterobia Stephanodiscus Surirella Synedra Tabellaria Thalassiosira
P, M E P, M U E P P P, M E P S P P P P, M U P, M E U U
ET AL.
[Volume 24