AQUATIC CONSERVATION: MARINE AND FRESHWATER ECOSYSTEMS
Aquatic Conserv: Mar. Freshw. Ecosyst. 21: 324–337 (2011) Published online in Wiley Online Library (wileyonlinelibrary.com). DOI: 10.1002/aqc.1197
Development and evaluation of a fish‐based index to assess biological integrity of Mediterranean streams ENRIC APARICIOa,b,*, GERARD CARMONA‐CATOTa,c, PETER B. MOYLEc and EMILI GARCÍA‐BERTHOUa a Institute of Aquatic Ecology, University of Girona, Girona, Catalonia, Spain b United Research Services S.L., Barcelona, Catalonia, Spain c Department of Wildlife, Fish and Conservation Biology, University of California, Davis, California, USA ABSTRACT 1. A multimetric Index of Biotic Integrity (IBI) based on fish data was developed to assess the ecological status of Iberian streams, in the context of the European Water Framework Directive. 2. Fish assemblages were determined by electrofishing at 114 sites from 10 basins of the Júcar River Basin District. The sampled streams were typical Mediterranean streams with strong variation in flow, a species‐poor and tolerant fish fauna, and low ecological specialization of the fish species. These features make it difficult to employ metrics based on species richness, trophic specialization, and reproductive strategy, which are typical of IBIs and similar indices. 3. The proposed IBI (IBI‐Jucar) is composed of five metrics related to fish health, age‐structure, and abundance and richness of native and alien species. IBI‐Jucar was validated by demonstrating high correlation with various measures of environmental degradation and with several biotic and habitat indices. It was also highly correlated with the European Fish Index (EFI+), despite different methods used for development and contrasting metrics obtained. 4. The results underline the complementarity of different biotic indices and show that indices based on fish can be a valuable tool for determining environmental quality, even in species‐poor Mediterranean streams. Copyright # 2011 John Wiley & Sons, Ltd. Received 18 September 2010; Revised 17 March 2011; Accepted 16 April 2011 KEY WORDS:
ecological status; ecosystem health; index of biotic integrity; Water Framework Directive
INTRODUCTION Biological assessments are crucial tools for measuring the ecological integrity of freshwater ecosystems and for protecting aquatic life. The European Water Framework Directive (WFD) considers fish to be an essential biotic element for determining the ecological status of running waters (EC, 2000). Indeed, fish are sensitive indicators of the quality of stream habitat because they integrate multiple effects of degraded environments while acting as continuous monitors (Hellawell, 1978); in addition, fish are relatively easy to capture and identify, and they have long been used as indicators of stream ecosystem health (Karr, 1981; Fausch et al., 1990; Angermeier and Davideanu, 2004). A widely used fish‐based approach to assess fresh waters is the Index of Biological Integrity (IBI), first developed by Karr (1981) and Karr et al. (1986). It is based on the biotic integrity concept,
referred to as ‘the ability to support and maintain a balanced, integrated, adaptive community of organisms having a species composition, diversity, and functional organization comparable to that of the natural habitat of the region’ (Karr and Dudley, 1981). The IBI is a multimetric index that uses fish assemblage attributes as metrics to assess water quality (Karr, 1981) and ecological condition of streams and catchments (Moyle and Randall, 1998). The original IBI was composed of 12 metrics that reflected fish species richness and composition, number and abundance of indicator species, trophic organization and function, reproductive behaviour, fish abundance, and condition of individual fish. Most fish‐based indices are derived from the original IBI and are popular in the USA (Plafkin et al., 1989; Fausch et al., 1990) and Europe (Oberdorff and Hughes, 1992; Pont et al., 2006, 2007). They use a series of metrics, based on
*Correspondence to: E. Aparicio, Institute of Aquatic Ecology, University of Girona, E‐17071 Girona, Catalonia, Spain. E‐mail:
[email protected]
Copyright # 2011 John Wiley & Sons, Ltd.
325
IBI MEDITERRANEAN STREAMS
assemblage structure and function, integrated into a numerical index scaled to reflect the ‘health’ of the assemblage. They also use the ‘reference condition approach’ (Hughes et al., 1998; Bailey et al., 2004), which involves comparing observed fish assemblages with a reference assemblage that is in natural or near‐natural state. Although the fundamentals of the IBI are widely accepted, difficulties in developing indices for regions with species‐poor, tolerant fish faunas have been noted (Moyle and Marchetti, 1999; Ferreira et al., 2007). The development of an IBI for Mediterranean streams of the Iberian Peninsula thus presents a number of potential problems. First, an IBI relies on the existence of undisturbed (reference) sites yet stream ecosystems on the Iberian Peninsula have been modified for hundreds if not thousands of years by impoundment, pollution, flow regulation and water abstraction, agricultural and urban development, and introduction of alien species (Elvira, 1995; García de Jalón, 2006; Lacorte et al., 2006; Berzas et al., 2009). Not only are undisturbed sites unlikely to exist but the rate of stream modification has been accelerating in recent decades. For example, the distribution of most native fishes has decreased by more than 50% during the last 100 years in Catalonia, NE Spain (Aparicio et al., 2000). While the ‘least disturbed’ or ‘best available’ sites are sometimes used as alternatives to reference sites (Whittier et al., 2006), the WFD requires pristine or near‐pristine reference sites (Schmutz et al., 2007). However, it is almost impossible to find stream reaches where native fish assemblages have not been altered. A second complication for developing a Mediterranean IBI is that the streams naturally support few fish species, most endemic to a few river basins (Almaça, 1995; Doadrio, 2001). In the Iberian Peninsula, most stream reaches typically have a fish assemblage of four or fewer native species (Doadrio, 2001; Ferreira et al., 2007). In contrast, stream reaches where the IBI was originally developed contained 40–50 native species (Karr et al., 1986). This situation makes developing Mediterranean fish‐based indices a challenging task (Moyle and Randall, 1998; Moyle and Marchetti, 1999; Ferreira et al., 2007). A third difficulty is that many IBI metrics rely on classifying species by trophic, habitat, tolerance, and reproductive guilds. However, relatively little is known about the ecology of many fishes in Mediterranean areas, especially the Iberian Peninsula (Doadrio, 2001; Maceda‐Veiga and de Sostoa, 2011), and generalizations about their ecology may be confounded by flexible life histories (Wootton, 1990). Mediterranean streams undergo major inter‐annual and inter‐seasonal flow variations (Gasith and Resh, 1999) and in this harsh environment few fishes show strong habitat or trophic specializations (Poff and Allan, 1995). Most Iberian freshwater fishes are invertivores or omnivores, have wide tolerances to abiotic variability, and are habitat and feeding generalists, well adapted to survive in changing environments (Magalhães et al., 2002). Although several guild classifications exist (Balon, 1975; Welcomme et al., 2006; Noble et al., 2007), standard criteria for guild delineation and selection of appropriate guilds are lacking (Kwak and Peterson, 2007). Maceda‐Veiga and de Sostoa (2011) recently provided new tolerance indicator values for fish in NE Spain but many of the species studied are not present in other parts of the Iberian Peninsula, including the area studied in this paper. Overall, these problems suggest that while a fish‐based index can be a useful tool for evaluating stream conditions, each Copyright # 2011 John Wiley & Sons, Ltd.
region needs to have a customized index. Each index has to take into account not only local conditions and history but the rationale of the IBI concept. The first IBI index in Spain (IBICAT), developed to assess streams in Catalonia (Sostoa et al., 2003), has been shown to have poor correlation with other biotic indices and inconsistencies among river basins because of a combination of the problems mentioned above (Benejam et al., 2008). Two indices have been developed for the Guadiana basin (Magalhães et al., 2008; Hermoso et al., 2010), which has different species composition and higher richness than the other Mediterranean catchments in the Iberian peninsula (Doadrio, 2001), making it difficult to adapt them to other regions. Another index used in Iberian streams is the European Fish Index (EFI), developed within the FAME project (FAME Consortium, 2004). The EFI is a standardized fish‐based assessment method applicable across a wide range of European streams (Pont et al., 2006, 2007). This index is based on a predictive model that derives reference conditions from abiotic environmental descriptors of individual sites, and then quantifies on a statistical basis the deviation of the observed fish assemblage structure from these reference conditions. The metrics used are based on species guilds describing the main ecological and biological characteristics of the fish community. Because of several limitations observed in the performance of the index, a new version (EFI+) was developed to improve performance in Mediterranean ecoregions (EFI+ Consortium, 2009). The objectives of this study are: (i) to propose a new fish index that is not based on a reference condition for selecting metrics, which does not use metrics based on ecological preferences of species (e.g. guilds), and is capable of assessing assemblages with low species richness, and (ii) to compare the index with the EFI+ and other biotic indices. First, metrics were developed based on different levels of ecological organization to evaluate Iberian streams, and then the index was applied to assess the streams in the Júcar River Basin District (SE Spain).
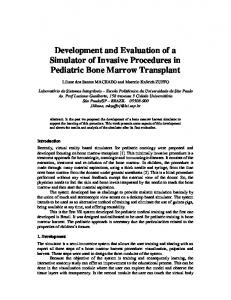
METHODS Study area The Júcar River Basin District (JRBD) comprises an area of 42 989 km2 in the eastern Iberian Peninsula and consists of 10 basins draining to the Mediterranean Sea (Figure 1). The largest stream of this region is the Júcar River, with a drainage area of 21 600 km2, a length of ca 500 km, and an average flow of 43 m3 s‐1. The average annual precipitation is about 500 mm yr‐1, ranging from 200 mm in the south to 1000 mm in the NW mountain ranges (Ninyerola et al., 2005). The climate is Mediterranean, with annual rainfall varying markedly from year to year but following a predictable seasonal pattern, with dry summers and rain precipitation mainly in the spring and autumn. Streams of this region have high seasonal and annual flow variation with severe droughts and floods. The highest flows occur during the wet autumn and spring months and the lowest towards the end of the dry summer months (Robles et al., 2002). Human population within the JBRD is about 5.16 million inhabitants (year 2009; INE, 2010), concentrated mainly in the coastal areas. Agriculture, livestock, and industry are the main economic activities (Robles et al., 2002). The region is Aquatic Conserv: Mar. Freshw. Ecosyst. 21: 324 –337 (2011)
326
E. APARICIO ET AL.
Figure 1. Location of the Júcar River Basin District and the sampling sites (n = 114) used for the development of the Index of Biotic Integrity.
under increasing pressure for exploitation of its water resources. The natural flow regimes have been altered considerably through construction of dams and other channel modifications (Sánchez‐Navarro et al., 2007). Major streams (i.e. Júcar, Cabriel, Turia, and Mijares) are strongly regulated from their middle reaches to the mouth, although upper parts of their catchments and small tributaries are less affected by water retention structures. In regulated streams, flows below dams are lower than historic flows in winter when reservoirs store water and higher during summer when water is released from the dams for irrigation. Pollution mainly affects the middle and lower reaches of the main streams owing to industrial and urban wastewater discharge. More information on the basin is available elsewhere (http://www.chj.es).
Data sources and sampling protocols Data on fish assemblages, environmental characteristics and human impacts were collected from 114 sites in the JRBD (Figure 1). Environmental characteristics of the sampling sites are shown in Table 1. Fish were sampled by electrofishing following the CEN 14011 standard protocol (CEN, 2003). A single upstream pass was made and block nets were not used to enclose the sampling area. Sites were electrofished for transects of about 50–200 m in length (5–50 channel widths), which included all geomorphic channel units present in the reach (i.e. riffles, pools, and runs). Fish were identified to species, measured (fork length, mm), weighed (g), examined for disease and anomalies, and then released at the same location. All fish sampling was conducted during summer base‐flow conditions from June to September of 2008 and 2009. Several variables were used to characterize reach level habitat and human disturbance at each site. Data were Copyright # 2011 John Wiley & Sons, Ltd.
collected either in situ or from national geographical information databases. Reach‐level habitat evaluation was conducted using the Rapid Bioassessment Protocol (HABITAT‐EPA), which rates 10 habitat parameters on substrate composition, channel morphology, instream cover, riparian conditions and bank erosion to derive a station habitat score (Barbour et al., 1999). Two disturbance variables (land‐use change and flow regulation) were used to estimate the extent of human influence on the catchment. The CORINE Land Cover database (available at http://www.eea.europa.eu) was used to quantify land‐use variables in a Geographic Information System (ArcGIS 9.2, ESRI, Redlands, California). Land use was categorized as urbanized areas, including urban and industrial units (% ARTIFICIAL), agricultural areas (%AGRICULTURE), and forested areas (%FOREST), and then the percentages of each category were calculated within the drainage basin immediately upstream. To estimate the extent of alteration of the natural flow regime by impoundment, each site was classified as either regulated or non‐regulated, based on upstream reservoir capacity and inflows from unregulated tributary streams in the stretch between the dam and the site. Data from biotic and abiotic indices routinely applied for ecological monitoring in the Iberian Peninsula were gathered to be compared with the new fish index. The indices compared were: the Riparian vegetation quality index, QBR (Munné et al., 2003); the Fluvial habitat index, IHF (Pardo et al., 2002); two indices based on diatoms, IPS (Specific Pollution Sensitivity index; CEMAGREF, 1982) and IBD (Diatom Biological Index; Prygiel and Coste, 1993), and a macroinvertebrate index, IBMWP (Iberian Biological Monitoring Working Party, Alba‐Tercedor et al., 2002). Data for these indices during 2007–2009 were obtained from the JRBD’s management authority (Confederación Hidrográfica del Júcar) for the same Aquatic Conserv: Mar. Freshw. Ecosyst. 21: 324–337 (2011)
327
IBI MEDITERRANEAN STREAMS
Table 1. Descriptive statistics of the environmental characteristics of sampling sites (n = 114) Variable
Mean
Median
Standard deviation
Range
Stream width (m) Water depth (cm) River slope (m km−1) Elevation (m) Pool (%) Run (%) Riffle (%) Boulders (%) Cobble (%) Gravel (%) Sand (%) Silt (%) pH Conductivity (μS cm−1)
6.8 39 8.9 528 36.2 39.3 23.5 22.3 35.1 12.2 5.2 20.0 8.0 951
5.1 36 6.2 530 30.0 37.5 21.4 16.5 34.3 6.6 0.0 14.1 8.1 852
7.4 16 7.8 387 27.2 25.0 18.1 22.3 23.6 15.4 8.2 21.4 0.4 427
1.8–60 11–102 0.2–41.4 10–1360 0–100 0–100 0–80 0–88 0–83 0–57 0–34 0–100 6.3–9.0 140–2510
sites where fish sampling was conducted. For sites sampled more than once in this period, mean values of the indices were calculated. The European Fish Index (EFI+) was also computed for the 114 fish sampling sites, using the software available at http://efi‐plus.boku.ac.at. EFI+ consists of two different fish metrics that vary with river type (salmonid and cyprinid river types) and ranges between 0 and 1. The EFI+ software requires as input data: site location (ecoregion and river region) and 12 environmental variables (geology, sediment size, altitude, flow regime, lakes, upstream drainage area, air temperature, river slope, distance from source, wetted width, sampling strategy and method, and fished area) to predict the reference values for the fish assemblage. Environmental variables needed for EFI+ calculation were obtained from topographical maps and GIS databases. All study sites were classified by the EFI+ software as ‘cyprinid river type’. Twelve high elevation sites dominated by brown trout (Salmo trutta) were reclassified as ‘salmonid river type’, but this had little affect on the results. The cyprinid type uses the metrics ‘richness of rheophilic spawning species’ and ‘density of lithophilic spawning species’. The index for the salmonid type is composed of two metrics: density of species intolerant to oxygen depletion and density of fish ≤150 mm (total length) of species intolerant to habitat degradation. A congeneric surrogate species was used to input data for an endemic species (Squalius valentinus) not considered in the EFI+ software.
Development of the IBI Development of an IBI typically begins with selection of metrics that are likely to differ among disturbed and undisturbed/ reference sites. To overcome the need for reference sites when they are not available, an alternative is to construct a set of metrics from expert knowledge that use recognized and accepted interpretations of ecological conditions and ecosystem health (Maitland, 2004; Scardi et al., 2008). The WFD requires determining the ecological status of streams by using abundance, composition, and age structure of fish assemblages; it was thus considered appropriate to develop a set of metrics following the definition of fish status of Moyle et al. (1998). They established three levels of fish ‘health’ (individual, population, and community), each of which adds different information. At the individual level, a healthy fish should have a robust body free of diseases and lesions and Copyright # 2011 John Wiley & Sons, Ltd.
reasonable growth rates for the region. Possible metrics for this level are condition (weight–length relationship), percentage of anomalies, and growth rate. Condition and growth rate were not used because they are rarely available from routine biomonitoring, although they could be included in the index when available. At the population level, positive fish status is defined by presence of multiple age classes (evidence of reproduction) and viable population size. Metrics for this level could be the number of age classes and abundance (catch‐per‐unit‐effort or density). Finally, at the community level, the fish assemblage should be dominated by native species, be resilient to extreme environmental events and have persistent composition through time. Possible metrics are loss of native species, number and abundance of alien species, and a measure of similarity of the assemblage at a particular site at different dates. Although the similarity measure could be valuable to test for resilience and persistence of fish assemblages, temporal data are rarely available in Spain and elsewhere, so this metric was not used. The new fish index (IBI‐Jucar) is based on five metrics and is intended to be an indicator of the degree to which Iberian streams have had their capacity to support native fishes reduced, through flow regime and habitat alteration, pollution, and invasions of alien species. It was recognized that the Iberian landscape has been altered by human activity for thousands of years, but the widespread decline of native fishes reflects more recent, accelerated processes of degradation. It was assumed that minimal human disturbance is reflected in an abundant and diverse native fish fauna with complex age‐structures and absence of alien species (Kennard et al., 2005). Degraded conditions are reflected in lower native species richness and abundance, with most age classes missing, and high abundance of alien species.
IBI Metrics Percentage of individuals with anomalies (DELT) This metric assumes that fish are more likely to develop deformities, eroded fins, lesions, and tumours (DELT anomalies) in degraded conditions, mainly when chronically exposed to stressful conditions (e.g. high temperatures), low water quality, contaminants, or pathogens (Sanders et al., 1999; Benejam et al., 2010a). Parasitic infestations were not included because they are often unrelated to water quality (Simon and Lyons, Aquatic Conserv: Mar. Freshw. Ecosyst. 21: 324 –337 (2011)
328
E. APARICIO ET AL.
1995). This metric was calculated as percentage of total fish captured with evident anomalies.
Age structure of native fish populations (SIZE_CLASS) The presence of multiple age‐classes reflects the persistence of favourable conditions over the years and overall high habitat quality (Munkittrick and Dixon, 1989; Torralva et al., 1997). Age determination is methodologically complex and time consuming, so the number of cohorts in samples was estimated from length–frequency analysis. Five expected size classes were set: fry, juveniles, and three classes of older fish (Table 3). The length groups chosen for the analysis were based on size and longevity data for each species (Doadrio, 2001). This metric was calculated as the number of size classes present for each species at a given site. The metric score for the whole water body was the mean of scores for all native species.
Abundance of native fishes (CPUE) High abundance of native fish is a good indicator of high‐quality water and unaltered stream habitats (Paller et al., 1996; Gafny et al., 2000). This metric was measured as catch‐per‐unit‐effort (CPUE). Catch data among sites were standardized by using the area electrofished (number of fish per hectare). Because multiple‐pass electrofishing for quantitative population estimates was not conducted, differential capture probabilities among sites could result in biased abundance data. However, one‐pass electrofishing has been shown to be highly correlated with population estimates from multiple‐pass depletion sampling (Lobón‐Cerviá and Utrilla, 1993; Reid et al., 2009), so it was assumed that the level of accuracy required to detect differences in abundance was achieved. High variability in abundance of young‐of‐year could disrupt assessment of abundance (Angermeier and Karr, 1986), thus only fish longer than 40 mm FL were used to compute CPUE. This metric was scored independently for each native species at each site and averaged for the final score of the site.
Loss of native species (LOSS_NATIVE) Loss of native species was assessed by comparing expected (‘theoretical’) assemblages in the absence of human impact with actual (‘sampled’) assemblages, based on presence/ absence data. Some indices rely on this metric alone to assess ecological status (Kennard et al., 2006; Hermoso et al., 2010). The expected assemblage of fishes can be determined through several approaches. For example, logistic regression models (Oberdorff et al., 2001) and artificial neural networks (Joy and Death, 2004) have been used to predict fish assemblages as a function of one or more independent environmental variables. All these procedures require large datasets to construct the model, including data from a number of reference sites, not available in the JRBD. Hence, a simpler approach was chosen based on the concept of environmental filters (Poff, 1997; Chessman, 2006). In this conceptual model, environmental factors operating at a wide range of scales successively exclude a proportion of a regional species pool, leaving a residual local assemblage to occupy a particular site. This model may be harder to use in regions with a high number of species but seems reliable for streams with low species richness such as Iberian streams. The environmental filters were used to include each species in the expected assemblage of a site if: (i) the Copyright # 2011 John Wiley & Sons, Ltd.
species was native to the basin; (ii) the altitude of the site was within the altitudinal range of the species in the region; and (iii) the stream habitat was within the types favoured by the species based on published information and the authors’ experiences. Rare species were only included in the expected assemblage if historical records indicated their presence in the specific stream reach. The percentage loss of native species was calculated as the number of species missing at a site divided by the expected total number species, expressed as a percentage.
Alien fish pressure (ALIEN_FISH) This metric was intended to reflect the number of alien species established as well as the proportional abundance of alien individuals in relation to native fish. Therefore, the percentage of alien species and the percentage abundance of alien individuals were averaged for each site.
Metric scoring Each metric was scored on a continuous scale from 0 to 10 except for DELT anomalies (Minns et al., 1994; Hughes et al., 1998). For positive metrics, i.e. those that decrease as disturbance increases (SIZE_CLASS, CPUE), minimum values were given a score of 0 and maximum values were given a score of 10, and intermediate metric scores were interpolated linearly. Negative metrics (ALIEN_FISH, LOSS_NATIVE) were scored similarly, with the minimum and maximum values reversed. Minimum and maximum values for CPUE metrics were defined as the 5th and 95th percentile values observed for each individual species in all sites. For species that showed variation in catch‐per‐unit‐effort with catchment area, the 5th and 95th percentile values to score the CPUE metric were set according to the maximum density line approach (MDL; Miller et al., 1988), using quantile regressions (Cade and Noon, 2003). DELT anomalies were incorporated within the index following Lyons (2006). Points were subtracted if sufficient individuals with anomalies (DELT) were found, but the lack of such individuals did not add points to the overall index score. Because of the scarcity of data on fish health in the Iberian Peninsula, guidelines for scoring this metric were based on IBIs developed in North America (Ohio EPA, 1987; Fausch et al., 1990). The metric was scored as follows: frequency of affected fish >6%, score = 10; >4–6%, score = 7.5; >2–4%, score = 5; 0.5–2%, score = 2.5; 60–80, good condition; and >80, very good condition.
Index validation and relative contribution of metrics A biotic index must have a demonstrable empirical relationship with environmental perturbation to be meaningful (Kwak and Peterson, 2007). Validation of IBI scores was obtained by relating the scores to measures of human disturbance and other biotic indices. Bivariate relationships were analysed Aquatic Conserv: Mar. Freshw. Ecosyst. 21: 324–337 (2011)
329
IBI MEDITERRANEAN STREAMS
using Spearman’s correlation coefficient, which are Pearson’s correlations based on ranks; they have the advantage of being adequate to describe any monotonous relationship and not assuming bivariate normality. Large correlation tables were adjusted for multiple comparisons with Holm’s sequential method. Smoothing curves (LOESS) were used to describe the nonlinear relationships in scatterplots. Principal component analysis (PCA) was used to examine relationships among biotic indices. All statistical analyses were performed using the software R version 2.11.0 (R Development Core Team, 2010). To evaluate the relative contribution of each metric to IBI scores, a reduced index was calculated by removing sequentially one metric from the full IBI, and calculating the percentage difference between each reduced index and the overall index (Minns et al., 1994). Because DELT was incorporated within the index in a different manner from the other metrics, it was not included in this analysis. If all the other four metrics contributed uniformly, the differences would be 25%.
RESULTS Fish assemblages In total, 22 species from nine families were collected from JRBD streams. Of these species, 10 (45%) were alien or translocated (Table 2). At the basin scale, richness of native fishes ranged from one species in small basins to nine species in the largest (Júcar). The highest richness of native species per site was six species with a mean of 1.8 species (SD = 1.1), whereas for alien species it was five species with a mean of 1.0 species (SD = 1.2). Fish abundance (CPUE, fish ha‐1) varied
greatly among sites; the mean for native fish per site was 1295 fish ha‐1 (SD = 1885; range 0–12 500 fish ha‐1) whereas for alien fish the mean was 601 fish ha‐1 (SD = 1406; range 0–8392 fish ha‐1). All streams had a rather similar longitudinal assemblage structure dominated by three widespread and abundant species: brown trout (Salmo trutta) in upstream sections, and eastern Iberian barbel (Barbus guiraonis) and eastern Iberian chub (Squalius valentinus) in middle and lower sections. The most frequent alien fishes were the Pyrenean gudgeon (Gobio lozanoi), an Iberian native translocated to the study area, and bleak (Alburnus alburnus) (Table 2).
Fish metrics and biotic indices The 5th and 95th percentile values used to score the fish abundance metric (CPUE) and length‐class intervals used to score age‐structure metrics (SIZE_CLASS) are shown in Table 3. CPUE data for genera Parachondrostoma and Squalius were pooled because of the low occurrence of some species. Fish density of B. guiraonis and Squalius spp. showed variation with catchment area. For both taxa, density decreased as catchment area increased. Therefore, the 5th and 95th percentile values of CPUE at a site were calculated using linear equations obtained by quantile regression of CPUE as a function of catchment area, both log10‐transformed, and then back‐transforming the dependent variable using anti‐logarithms (Figure 2; Table 3). The predicted species richness used to score the loss of native species (LOSS_NATIVE) is shown in Figure 3. Metrics with the highest mean scores were percentage loss of native species (LOSS_NATIVE) and alien fish percentage (ALIEN_FISH, Table 4), which also accounted for the largest differences between the full IBI and reduced indices (LOSS_ NATIVE, 32%; ALIEN_FISH, 30%). CPUE showed the
Table 2. Fish species found at Júcar Basin Water District sites (n = 114), percentages of occurrence and abundance, and CPUE statistics. Alien fish refers to species not native to Júcar streams Species name
Native fish Anguilla anguilla Achondrostoma arcasii Barbus guiraonis Barbus haasi Cobitis paludica
Common name
Family
n
% occurrence
CPUE (fish ha−1)
% abundance Mean
SD
Range
Anguillidae Cyprinidae Cyprinidae Cyprinidae Cobitidae
37 125 1016 131 43
13.8 8.9 47.2 12.2 5.7
0.8 2.5 20.7 2.7 0.9
76.7 1013.0 728.5 276.1 390.7
64.5 2101.6 832.0 280.6 424.1
10–278 27–7500 17–3571 14–1133 27–1389
Parachondrostoma arrigonis Parachondrostoma miegii Parachondrostoma turiense Salaria fluviatilis Salmo trutta Squalius pyrenaicus Squalius valentinus
European eel Bermejuela Eastern Iberian barbel Iberian redfin barbel Southern Iberian spined‐loach Júcar nase Ebro nase Turia nase Freshwater blenny Brown trout Southern Iberian chub Eastern Iberian chub
Cyprinidae Cyprinidae Cyprinidae Blenniidae Salmonidae Cyprinidae Cyprinidae
7 16 43 36 453 36 1441
1.6 0.8 5.7 4.9 29.3 1.6 42.3
0.1 0.3 0.9 0.7 9.2 0.7 29.3
427.5 539 205.4 118.3 468.3 474.2 1412.9
405.9 ‐ 347.1 65.4 627.6 200.6 1789.4
22–833 539 26–1055 50–174 14–3174 274–675 34–8929
Alien fish Alburnus alburnus Carassius auratus Cyprinus carpio Esox lucius Gambusia holbrooki Gobio lozanoi Lepomis gibbosus Micropterus salmoides Oncorhynchus mykiss Pseudochondrostoma polylepis
Bleak Goldfish Common carp Northern pike Eastern mosquitofish Pyrenean gudgeon Pumpkinseed Largemouth bass Rainbow trout Iberian straight‐mouth nase
Cyprinidae Cyprinidae Cyprinidae Esocidae Poeciliidae Cyprinidae Centrarchidae Centrarchidae Salmonidae Cyprinidae
807 59 41 1 56 315 67 109 45 26
22.0 8.1 12.2 0.8 7.3 22.8 7.3 12.2 6.5 0.8
16.4 1.2 0.8 0.0 1.1 6.4 1.4 2.2 0.9 0.5
1541.6 289.8 120.3 14 401.1 679.7 133.4 264.6 177.8 647
1779.4 272.7 148.5 ‐ 419.8 1458.7 153.7 387.6 299.3 ‐
5–6532 22–854 20–653 14 14–1444 10–7333 37–507 12–1566 10–946 647
Copyright # 2011 John Wiley & Sons, Ltd.
Aquatic Conserv: Mar. Freshw. Ecosyst. 21: 324 –337 (2011)
330
E. APARICIO ET AL.
Table 3. Percentile CPUEs and size class intervals used to score the CPUE and SIZE_CLASS metrics. CPUE data for genera Parachondrostoma and Squalius were pooled because of the low occurrence of some species. Percentile values of CPUE (y) for Barbus guiraonis and Squalius spp. were calculated as a function of log10‐catchment area (x), and then back‐transforming the dependent variable using anti‐logarithms Species
Anguilla anguilla Achondrostoma arcasii Barbus guiraonis Barbus haasi Cobitis paludica Parachondrostoma arrigonis Parachondrostoma miegii Parachondrostoma turiense Salaria fluviatilis Salmo trutta Squalius pyrenaicus Squalius valentinus
5th percentile
95th percentile
CPUE
CPUE
(fish ha−1)
(fish ha−1)
10.6 24.9 y = 2.77–0.37x 16.2 65.5
176.2 4553.6 y = 3.69–0.11x 354.5 1092.6
23.4 51.4 16.5
424.4 213.7 703.9
y = 1.83 + 0.01x
y = 4.37–0.30x
lowest contribution to the overall index score (average of differences between full IBI and reduced index = 18%). The mean IBI score for all sites was 62.8, which lies at the lower end of the ‘good condition’ category of the proposed score classification. The other biotic and habitat indices followed a similar tendency, with mean values located in the fair to good condition ranges (Table 4). All fish metrics were significantly correlated with one another except for the DELT metric. DELT scores were calculated only when fish with abnormalities were present
10000
A
CPUE (fish ha-1)
95th percentile
1000
100
5th percentile
10 10
100
1000
10000
100000
Catchment area (km2) 100000
CPUE (fish ha-1)
B 95th percentile
10000
1000
100
5th percentile
10 10
100
1000
10000
100000
Catchment area (km2) Figure 2. Catch per unit effort of (A) Barbus guiraonis and (B) Squalius spp. (S. valentinus and S. pyrenaicus pooled) by catchment area, showing quantile regressions of 5th and 95th percentiles. Copyright # 2011 John Wiley & Sons, Ltd.
Size class interval (mm) 1
2
3
4
5
‐ 50–70 100–200 60–90 50–70
‐ 70–90 200–280 90–120 70–90
‐ 90–100 280–360 120–150 90–100
‐ >100 >360 >150 >100
≤ 60 ≤ 50 ≤ 80
60–90 50–70 80–150
90–120 70–90 150–200
120–150 90–100 200–240
>150 >100 >240
≤ 60
60–90
90–120
120–140
>140
≤ ≤ ≤ ≤
‐ 50 100 60 50
(n = 13) so there are 101 missing values (Table 5). The sign of these fish metrics agreed with the expected response: e.g. sites that have lost more species (high LOSS_NATIVE) had more introduced fish (high ALIEN_FISH) and lower native fish abundance (low CPUE). The metric most correlated with other metrics was LOSS_NATIVE, and the least correlated metric was SIZE_CLASS. IBI‐Jucar scores declined with increased catchment disturbance and were negatively correlated with percentage of agricultural and artificial land‐use and positively correlated with the percentage of forest land (Table 6, Figure 4). IBI‐Jucar scores were also affected by hydrological alteration: sites strongly regulated yielded significantly lower IBI‐Jucar scores than unregulated ones (ANCOVA, F1, 109 = 15.2; P = 0.0002), after accounting for differential land‐use ( F1, 109 = 99.5; P < 0.0001) (Figure 4). All biotic indices were significantly correlated, even after adjusting for multiple comparisons (Table 6). Some of the relationships were clearly nonlinear (Figure 5), with diatom indices having a convex relationship with the rest of the indices (i.e. the average value changed little when other indices were still increasing) and IBMWP having a more concave relationship. The fish indices (EFI+ and IBI‐Jucar) were more tightly correlated with habitat indices (IHF, HABITAT_EPA, %FOREST) than with diatom indices (IPS and IBD). The IBMWP was correlated with both habitat and diatom indices (Table 6). EFI+ and IBI‐Jucar were highly correlated (rS = 0.73) but the former was slightly better correlated with diatom indices and local habitat indices (IHF, HABITAT_EPA) while IBI‐Jucar was better correlated with IBMWP and the landscape indicator (%FOREST). A PCA summarizes these results and the first axis explains most of the variation (56%, eigenvalue = 5.07) demonstrating that it measures overall ecological status and that that all indices are correlated (Figure 6). The diatom indices, particularly the IBD, were less related to the rest and were distinguished by the second axis, which explained 11% of the variation (eigenvalue = 1.01). The PCA also shows that IBMWP is slightly more correlated than other indices with diatom indices, and that biotic indices, except the diatom indices, are well correlated with the habitat indices. Aquatic Conserv: Mar. Freshw. Ecosyst. 21: 324–337 (2011)
331
IBI MEDITERRANEAN STREAMS
DISCUSSION Justification of IBI‐Jucar
Figure 3. Map showing the predicted fish species richness for the streams of the Júcar River Basin District used to score the LOSS_NATIVE metric.
Biotic integrity of the Júcar streams IBI‐Jucar scores ranged from 0 to 100, with a median of 69. IBI‐Jucar classes showed that most of the sites (55%) were below good condition, and overall 27% had a deficient or poor condition. High IBI‐Jucar scores were usually associated with the upper reaches and some tributaries of the Mijares, Palancia, Turia, and Júcar streams. Several coastal streams of the southern part also had good values. Low IBI‐Jucar scores were mostly linked to middle and lower mainstem reaches affected by regulation, highly altered channels, or close proximity to urban areas (Figure 7).
The lack of suitable reference conditions poses a problem in the development of indices of biotic integrity in regions with a long legacy of human modification. The alternative approach used in developing the IBI‐Jucar, which included the selection of metrics based on sound ecological principles, proved to be clearly useful for measuring stream integrity. First, IBI‐Jucar was significantly correlated with measures of habitat quality and of human disturbance, such as land use and flow regulation. Land use is linked to biotic integrity of streams by influencing nutrient input, sediment input, hydrology, and channel characteristics (Roth et al., 1996; Allan et al., 1997). Impoundment alters flow regimes, which disrupts the biological performance of native species in many ways, such as changing reproductive cycles, recruitment, and abundance (Freeman et al., 2001; Lytle and Poff, 2004). This leads to declines of populations and reductions in distribution (Aparicio et al., 2000; Clavero et al., 2004). Second, IBI‐Jucar is strongly correlated with other biotic indices that have been extensively validated (see Benejam et al., 2008 and references therein), in particular macroinvertebrate indices and the EFI+. Finally, all the IBI‐Jucar metrics (except DELT) were significantly correlated with each other, despite being measurements of quite different aspects of fish assemblages, such as species composition (LOSS_NATIVE), abundance (CPUE), size structure (SIZE_CLASS), and dominance of exotic species (ALIEN_FISH). The loss of native species (LOSS_NATIVE) and invasion by exotics (ALIEN_FISH) have been widely recognized as one of the main consequences of degradation of aquatic ecosystems in the Iberian Peninsula (Godinho and Ferreira, 1998; Aparicio et al., 2000; Doadrio, 2001; Hermoso et al., 2011). These two metrics had the greatest influence on the IBI‐Jucar scores. Abundance (CPUE) and age structure (SIZE_CLASS) of native fish were more variable among sites but also contributed significantly to final IBI‐Jucar scores, because they are affected by a number of human factors. For example, substrate alteration and siltation may affect survival of fry or preclude reproduction, reducing abundance and
Table 4. Descriptive statistics of land‐use variables, biotic indices and fish metrics. The statistics of DELT scores do not include samples with no fish anomalies (zero scores) Variable Land use % catchment forested % catchment in agriculture % catchment urbanized Biotic indices Fluvial habitat index EPA’s Rapid Bioassessment Protocols (Habitat) Riparian Vegetation Quality Index Specific Pollution Sensitivity Index (Diatom) Diatom Biological Index Iberian Biological Monitoring Working Party (Macroinvertebrate) European Fish Index IBI‐Jucar metrics and total Presence of individuals with anomalies Age (size) structure of native fishes Abundance of native fishes Loss of native species Alien fish pressure Index of Biotic Integrity
Copyright # 2011 John Wiley & Sons, Ltd.
Abbreviation
Mean
Median
Standard deviation
Range
%FOREST %AGRICULTURE %ARTIFICIAL
57.4 38.2 3.2
62.8 37.0 0.6
27.4 23.5 6.7
0.04–96 1–95 0–48
IHF HABITAT_EPA QBR IPS IBD IBMWP EFI+
65.1 121.3 64.8 15.3 15.7 118.8 0.63
64.7 125.0 68.3 15.6 16.1 110.0 0.67
9.4 31.1 26.2 2.2 1.8 53.7 0.21
39–87 32–177 8–100 9.5–18.8 10.7–18.9 21–245 0.05–1
DELT SIZE_CLASS CPUE LOSS_NATIVE ALIEN_FISH IBI‐Jucar
4.8 5.6 4.9 7.9 7.4 62.8
5.0 6.0 4.3 10.0 8.2 68.4
2.8 2.8 3.6 2.9 3.1 26.0
2.5–10 0–10 0–10 0–10 0–10 0–100
Aquatic Conserv: Mar. Freshw. Ecosyst. 21: 324 –337 (2011)
332
E. APARICIO ET AL.
Table 5. Correlation matrix (Spearman’s coefficient below the diagonal and P values above the diagonal) of fish metrics used in IBI‐Jucar. n = 114 except for correlations involving DELT, where n = 13 ALIEN_FISH
DELT
SIZE_CLASS
CPUE
LOSS_NATIVE
— −0.53 −0.32 −0.48 −0.66
0.060 — 0.30 0.21 0.50
0.0006 0.314 — 0.36 0.38
*** 0.499 *** — 0.59
*** 0.081 *** *** —
ALIEN_FISH DELT SIZE_CLASS CPUE LOSS_NATIVE ***indicates P < 0.00005. Abbreviations are in Table 4.
Table 6. Correlation matrix (Spearman’s coefficient below the diagonal and P values adjusted with Holm’s method above the diagonal) of biotic indices in the Júcar streams. n = 102–114 (some variables had missing values)
IPS IBD IBMWP QBR IHF HABITAT_EPA %FOREST EFI+ IBI‐Jucar
IPS
IBD
IBMWP
QBR
IHF
HABITAT_EPA
%FOREST
EFI+
IBI‐Jucar
— 0.48 0.60 0.44 0.44 0.40 0.50 0.38 0.32
*** — 0.43 0.22 0.41 0.26 0.39 0.31 0.30
*** *** — 0.56 0.67 0.62 0.71 0.57 0.65
*** 0.029 *** — 0.57 0.68 0.57 0.47 0.39
*** 0.0002 *** *** — 0.58 0.51 0.54 0.53
0.0003 0.014 *** *** *** — 0.53 0.52 0.50
*** 0.0004 *** *** *** *** — 0.50 0.64
*** 0.0016 *** *** *** *** *** — 0.73
0.0009 0.0018 *** *** *** *** *** *** —
100
***indicates P < 0.00005. Abbreviations are in Table 4.
60 40 0
20
IBI-Jucar
80
Unregulated Regulated
0
20
40
60
80
100
%FOREST Figure 4. Relationship between the percentage of forest area in the drainage area (%FOREST) and IBI‐Jucar for regulated (+) and non‐ regulated (o) sites of Júcar River Basin district.
removing young age classes (Berkman and Rabeni, 1987); water extraction, pollution and exploitation can increase adult mortality (Matthews and Marsh‐Matthews, 2003; Benejam et al., 2010b). Even under natural conditions, populations of native fishes can plunge due to environmental stochastic events, but recovery is also usually rapid because fish adapted to Mediterranean‐type streams have evolved the ability to recover quickly from natural events (Bravo et al., 2001; Pires et al., 2008). Therefore, complex age structure and adequate Copyright # 2011 John Wiley & Sons, Ltd.
abundance of native fishes can still be used as indicators of ecological integrity in Mediterranean streams. DELT had the lowest influence on IBI‐Jucar scores because fish with anomalies were only found in 13 out of 114 sites. This low prevalence is similar for other regions of the Iberian Peninsula (Sostoa et al., 2003). Anomalies have been linked mainly to industrial chemical pollution (Fournie et al., 1996; Sanders et al., 1999; Benejam et al., 2010a), which is low in the study area. However, the DELT metric is interesting because it is one of the few such metrics that measure health at the individual level (Karr, 1981, Karr et al., 1986). The methodology used to develop IBI‐Jucar diverges slightly from other fish indices. Similar to Pont et al. (2006, 2007), a type‐specific approach, though recommended by the WFD, was not used and the IBI metrics were the same for headwater and lower reaches. Although the more recent EFI+ distinguishes two river types (salmonid and cyprinid types), in practice only one type is used since most streams in the Júcar Basin (like most stream reaches in Mediterranean drainages of the Iberian Peninsula) correspond to the cyprinid river type. Although a type‐specific approach might improve sensitivity of the IBI because of natural longitudinal changes of river fish assemblages (Vannote et al., 1980; Lasne et al., 2007), it also imposes artificial boundaries and is probably less useful in small streams such as the ones studied. Another difference from other indices is that the present work did not use explicit ‘reference’ sites as standards. Many indices try to identify ‘reference’ or ‘least disturbed’ sites, developing a predictive model for these sites and identifying metrics through the relationship with measures of human perturbation in more disturbed sites. However, a reference condition approach was implicit in scoring metrics, because they were mostly used with Aquatic Conserv: Mar. Freshw. Ecosyst. 21: 324–337 (2011)
333
IBI MEDITERRANEAN STREAMS 16
40
60
80
0
40
80
14
18
12
0.53
IBD
IBMWP
0.44 0.40 0.65
IHF
0.41 0.32 0.56 0.54
0.6
1.0
40
60
80
50
0.57 0.40
150
250
12
16
10
IPS
0.35 0.30 0.62 0.50 0.78
IBI-Jucar
0
40
80
0.2
EFI+
10
14
18
50
150
250
0.2
0.6
1.0
Figure 5. Relationship among selected biotic indices in the Júcar streams. The lower panels show the Pearson correlation coefficients and the upper panels the pairwise scatterplot with a smoothing curve (LOESS). In the scatterplots, the Y axis corresponds to the variable in the row diagonal and the X axis to the column diagonal (e.g. the scatterplot on the top right has IPS in the Y axis and IBI‐Jucar in the X axis). Abbreviations are in Table 4.
a well‐defined expectation of the pristine situation (all native species present, all size classes present, no alien fishes, low incidence of anomalies).
1.0
IBD
IPS
Copyright # 2011 John Wiley & Sons, Ltd.
0.0
PC2
IHF %FOREST EFI+ IBI-Jucar QBR
-1.0
-0.5
IBMWP
-1.5
IBI‐Jucar was significantly correlated with other biotic indices based on fish (EFI+), macroinvertebrates (IBMWP), diatoms (IPS and IBD) and habitat (IHF, QBR and EPA), indicating that all the indices measure similar aspects of environmental quality of streams. However, correlation coefficients were in general not very high (0.3–0.7), suggesting that each index responds differently to different disturbances. The diatom indices were the least correlated with the IBI‐Jucar, as reported for other Iberian regions (Benejam et al., 2008). They seem to be more sensitive to physico‐chemical quality and nutrient concentrations (Hering et al., 2006; Justus et al., 2010), while fish indices tend to be more sensitive to long‐term habitat and landscape factors (Hughes et al., 2009). Macroinvertebrate indices reflect impairment at intermediate temporal and spatial scales (Hering et al., 2006). The complementary relationships among biotic indices demonstrates the importance of monitoring using multiple organism groups for a comprehensive assessment of the biotic integrity of aquatic ecosystems (Griffith et al., 2005; Hughes et al., 2009; Justus et al., 2010). We consider IBI‐Jucar to be complementary to EFI+, which is the only fish index currently available for use throughout the Iberian Peninsula. The main advantages of
0.5
Comparison and validation with other biotic indices
-1.5
-1.0
-0.5
0.0
0.5
1.0
1.5
PC1 Figure 6. Principal component analysis of the biotic indices in the Júcar streams. Arrows display loadings of the indices while points show site scores. Abbreviations are in Table 4.
EFI+ over IBI‐Jucar are its general applicability throughout Europe and its comprehensive statistical validation. The main advantages of IBI‐Jucar are: (i) an increased number of Aquatic Conserv: Mar. Freshw. Ecosyst. 21: 324 –337 (2011)
334
E. APARICIO ET AL.
ACKNOWLEDGEMENTS This research was funded by the Confederación Hidrográfica del Júcar through the project ‘Explotación de la red de vigilancia de la calidad de las aguas, mediante índices bióticos, en el ámbito geográfico de la Confederación Hidrográfica del Júcar’ (Exp.‐ 08.960‐021/0411). Additional funding was provided by the Spanish Ministry of Science (CGL2009‐12877‐C02‐01 and Consolider‐Ingenio 2010 CSD2009‐00065). We are grateful to Amparo Piñón and Manuel Torán (Confederación Hidrográfica del Júcar) for supporting this study and URS staff for field assistance, especially Cristina Pérez, Elisabeth Fernández, Marta Reyes and Guillem Molina. We also thank Editor P. J. Boon and two anonymous reviewers for insightful comments on an early version of the manuscript. GCC held a doctoral fellowship (BR2010/10) from the University of Girona during preparation of the manuscript. REFERENCES
Figure 7. Scores of the Index of Biotic Integrity for the Júcar River Basin District.
metrics, which should respond better to different perturbation types and provide more statistical robustness; (ii) an explicit consideration of alien species, which are an important threat to native fishes in the Iberian Peninsula (Clavero and García‐Berthou, 2006; Hermoso et al., 2011); (iii) when impaired conditions are detected, the specific causes of change can be assessed in a post hoc diagnostic using individual metric evaluations; and iv) ease of use in species‐poor Mediterranean streams. While EFI+ and IBI‐Jucar are highly correlated they differ slightly in correlations with other biotic and habitat indices, which suggests that they differ in sensitivity to different environmental perturbations. The high correlation between two quite different fish indices is additional validation for both and supports development of fish‐based indices in Mediterranean regions, despite the difficulties imposed by the low species richness, flexible life‐histories, and low ecological specialization of fish assemblages (Ferreira et al., 2007).
Potential drawbacks and further developments Although IBI‐Jucar had good performance, the criteria used to score the metrics can still be improved when a larger dataset becomes available to make more precise thresholds for metric score classes. In addition, long‐term time series of samples, which are unfortunately still very rare in the Iberian peninsula, would allow testing of the temporal variation of index scores and incorporation of more metrics such as descriptors to test resilience and persistence of fish assemblages, which should improve the overall performance of the index. IBI‐Jucar evaluated streams in a wide area with diverse conditions but was developed only for the Jucar ecoregion. The index, however, can be applied to other ecoregions without basic conceptual changes by adjusting the metrics to reflect region‐specific attributes of fish assemblages. Copyright # 2011 John Wiley & Sons, Ltd.
Alba‐Tercedor J, Jáimez‐Cuéllar P, Álvarez M, Avilés J, Bonada N, Casas J, Mellado A, Ortega M, Pardo I, Prat N, et al. 2002. Caracterización del estado ecológico de ríos mediterráneos ibéricos mediante el índice IBMWP (antes BMWP’). Limnetica 21: 175–185. Allan JD, Erickson DL, Fay J. 1997. The influence of catchment land use on stream integrity across multiple spatial scales. Freshwater Biology 37: 149–161. Almaça C. 1995. Freshwater fish and their conservation in Portugal. Biological Conservation 72: 125–127. Angermeier PL, Davideanu G. 2004. Using fish communities to assess streams in Romania: initial development of an index of biotic integrity. Hydrobiologia 511: 65–78. Angermeier PL, Karr JR. 1986. Applying an index of biotic integrity based on stream fish communities: considerations in sampling and interpretation. North American Journal of Fisheries Management 6: 418–429. Aparicio E, Vargas MJ, Olmo JM, de Sostoa A. 2000. Decline of native freshwater fishes in a Mediterranean watershed on the Iberian Peninsula: a quantitative assessment. Environmental Biology of Fishes 59: 11–19. Bailey RC, Norris RH, Reynoldson TB. 2004. Bioassessment of Freshwater Ecosystems: Using the Reference Condition Approach. Kluwer Academic Publishers: New York. Balon EK. 1975. Reproductive guilds of fishes: a proposal and definition. Journal of the Fisheries Research Board of Canada 32: 821–864. Barbour MT, Gerritsen J, Snyder BD, Stribling JB. 1999. Rapid bioassessment protocols for use in streams and wadeable rivers: periphyton, benthic macroinvertebrates, and fish. US Environmental Protection Agency, Office of Water, Washington, DC, USA. Benejam L, Aparicio E, Vargas MJ, Vila‐Gispert A, García‐Berthou E. 2008. Assessing fish metrics and biotic indices in a Mediterranean stream: effects of uncertain native status of fish. Hydrobiologia 603: 197–210. Benejam L, Benito J, García‐Berthou E. 2010a. Decreases in condition and fecundity of freshwater fishes in a highly polluted reservoir. Water, Air, and Soil Pollution 210: 231–242. Benejam L, Angermeier PL, Munné A, García‐Berthou E. 2010b. Assessing effects of water abstraction on fish assemblages in Mediterranean streams. Freshwater Biology 55: 628–642. Berkman HE, Rabeni CF. 1987. Effect of siltation on stream fish communities. Environmental Biology of Fishes 18: 285–294. Aquatic Conserv: Mar. Freshw. Ecosyst. 21: 324–337 (2011)
IBI MEDITERRANEAN STREAMS
Berzas JJ, Rodríguez RC, Guzmán FJ, Jiménez M, Ortega S, Sánchez‐Herrera MM, Martín‐Nieto S, Doncel A. 2009. Integrated pollution evaluation of the Tagus River in Central Spain. Environmental Monitoring and Assessment 156: 461–477. Bravo R, Soriguer MC, Villar N, Hernando JA. 2001. The dynamics of fish populations in the Palancar stream, a small tributary of the river Guadalquivir, Spain. Acta Oecologica 22: 9–20. Cade BS, Noon BR. 2003. A gentle introduction to quantile regression for ecologists. Frontiers in Ecology and the Environment 1: 412–420. CEMAGREF. 1982. Étude des methods biologiques d’ appréciation quantitative de la qualité des eaux. Rapport Q.E. Lyon, Agence de l’Eau Rhône‐Méditerranée‐Corse‐ Cemagref, Lyon. CEN. 2003. Water quality. Sampling of fish with electricity. EN 14011. European Committee for Standardization, Brussels. Chessman BC. 2006. Prediction of riverine fish assemblages through the concept of environmental filters. Marine and Freshwater Research 57: 601–609. Clavero M, García‐Berthou E. 2006. Homogenization dynamics and introduction routes of invasive freshwater fish in the Iberian Peninsula. Ecological Applications 16: 2313–2324. Clavero M, Blanco‐Garrido F, Prenda J. 2004. Fish fauna in Iberian Mediterranean river basins: biodiversity, introduced species and damming impacts. Aquatic Conservation: Marine and Freshwater Ecosystems 14: 575–585. Doadrio I (ed). 2001. Atlas y libro rojo de los peces continentales de España. Ministerio de Medio Ambiente: Madrid, Spain. EC (European Communities). 2000. Directive 2000/60/EC of the European Parliament and of the Council of 23 October 2000 establishing a framework for Community action in the field of water policy. Official Journal of the European Communities L 327: 1–72. EFI+ Consortium. 2009. Manual for the application of the new European Fish Index – EFI+. A fish‐based method to assess the ecological status of European running waters in support of the Water Framework Directive. Available at http://efi‐plus.boku.ac.at/software/doc/EFI+Manual.pdf Last accessed March 2011. Elvira B. 1995. Native and exotic freshwater fishes in Spanish river basins. Freshwater Biology 33: 103–108. FAME Consortium. 2004. Manual for the application of the European Fish Index ‐ EFI. A fish‐based method to assess the ecological status of European rivers in support of the Water Framework Directive. Version 1.1. Available at http://fame. boku.ac.at/downloads/manual_Version_Februar2005.pdf Last accessed March 2011. Fausch KD, Lyons J, Karr JR, Angermeier PL. 1990. Fish communities as indicators of environmental degradation. American Fisheries Society Symposium 8: 123–144. Ferreira T, Oliveira J, Caiola N, de Sostoa A, Casals F, Cortes R, Economou A, Zogaris S, Garcia‐Jalon D, Ilhéu M, et al. 2007. Ecological traits of fish assemblages from Mediterranean Europe and their responses to human disturbance. Fisheries Management & Ecology 14: 473–481. Fournie JW, Summers JK, Weisberg SB. 1996. Prevalence of gross pathological abnormalities in estuarine fishes. Transactions of the American Fisheries Society 125: 581–590. Freeman MC, Bowen ZH, Bovee KD, Irwin ER. 2001. Flow and habitat effects on juvenile fish abundance in natural and altered flow regimes. Ecological Applications 11: 179 – 190. Gafny S, Goren M, Gasith A. 2000. Habitat condition and fish assemblage structure in a coastal Mediterranean stream Copyright # 2011 John Wiley & Sons, Ltd.
335
(Yarqon, Israel) receiving domestic effluent. Hydrobiologia 422–423: 319–330. García de Jalón D. 2006. River regulation in Spain. Regulated Rivers: Research & Management 1: 343–348. Gasith A, Resh VH. 1999. Streams in Mediterranean climate regions: abiotic influences and biotic responses to predictable seasonal events. Annual Review of Ecology and Systematics 30: 51–81. Godinho FN, Ferreira MT. 1998. The relative influences of exotic species and environmental factors on an Iberian native fish community. Environmental Biology of Fishes 51: 41–51. Griffith MB, Hill BH, McCormick FH, Kaufmannd PR, Herlihy AT, Selle AR. 2005. Comparative application of indices of biotic integrity based on periphyton, macroinvertebrates, and fish to southern Rocky Mountain streams. Ecological Indicators 5: 117–136. Hellawell JM. 1978. Biological Surveillance of Rivers. Water Research Centre: Stevenage, UK. Hering D, Johnson RK, Kramm S, Schmutz S, Szoszkiewicz K, Verdonschot PFM. 2006. Assessment of European streams with diatoms, macrophytes, macroinvertebrates and fish: a comparative metric‐based analysis of organism response to stress. Freshwater Biology 51: 1757–1785. Hermoso V, Clavero M, Blanco‐Garrido F, Prenda J. 2010. Assessing the ecological status in species‐poor systems: a fish‐based index for Mediterranean Rivers (Guadiana River, SW Spain). Ecological Indicators 10: 1152–1161. Hermoso V, Clavero M, Blanco‐Garrido F, Prenda J. 2011. Invasive species and habitat degradation in Iberian streams: an analysis of their role and interactive effects on freshwater fish diversity loss. Ecological Applications 21: 175–188. Hughes RM, Kauffman PR, Herlihy AT, Kincaid TM, Reynolds L, Larsen DP. 1998. A process for developing and evaluating indices of fish assemblage integrity. Canadian Journal of Fisheries and Aquatic Sciences 55: 1618–1631. Hughes SJ, Santos JM, Ferreira MT, Caraça R, Mendes AM. 2009. Ecological assessment of an intermittent Mediterranean river using community structure and function: evaluating the role of different organism groups. Freshwater Biology 54: 2383–2400. INE (Instituto Nacional de Estadística). 2010. Censo de Población 2009. INE: Madrid. Joy MK, Death RG. 2004. Predictive modelling and spatial mapping of freshwater fish and decapod assemblages: an integrated GIS and neural network approach. Freshwater Biology 49: 1036–1052. Justus BG, Petersen JC, Femmer SR, Davis JV, Wallace JE. 2010. A comparison of algal, macroinvertebrate, and fish assemblage indices for assessing low‐level nutrient enrichment in wadeable Ozark streams. Ecological Indicators 10: 627–638. Karr JR. 1981. Assessment of biotic integrity using fish communities. Fisheries 6: 21–27. Karr JR, Dudley DR. 1981. Ecological perspective on water quality goals. Environmental Management 5: 55–68. Karr JR, Fausch KD, Angermeier PL, Yant PR, Schlosser IJ. 1986. Assessing Biological Integrity in Running Waters: A Method and its Rationale. Illinois Natural History Survey: Champaign, IL, USA. Kennard MJ, Arthington AH, Pusey BJ, Harch BD. 2005. Are alien fish a reliable indicator of river health? Freshwater Biology 50: 174–193. Kennard MJ, Pusey BJ, Arthington AH, Harch BD, Mackay SJ. 2006. Development and application of a predictive model of freshwater fish assemblage composition to evaluate river health in eastern Australia. Hydrobiologia 572: 33–57. Aquatic Conserv: Mar. Freshw. Ecosyst. 21: 324 –337 (2011)
336
E. APARICIO ET AL.
Kwak TJ, Peterson JT. 2007. Community indices, parameters, and comparisons. In Analysis and Interpretation of Freshwater Fisheries Data. Guy CS, Brown ML (eds). American Fisheries Society: Bethesda, MD, USA; 677–763. Lacorte S, Raldúa D, Martínez E, Navarro A, Diez S, Bayona JM, Barceló D. 2006. Pilot survey of a broad range of priority pollutants in sediment and fish from the Ebro river basin (NE Spain). Environmental Pollution 140: 471–482. Lasne E, Bergerot B, Lek S, Laffaille P. 2007. Fish zonation and indicator species for the evaluation of the ecological status of rivers: example of the Loire basin (France). River Research and Applications 23: 877–890. Lobón‐Cerviá J, Utrilla CG. 1993. A simple model to determine stream trout (Salmo trutta L.) densities based on one removal with electrofishing. Fisheries Research 15: 369–378. Lyons J. 2006. A fish‐based index of biotic integrity to assess intermittent headwater streams in Wisconsin, USA. Environmental Monitoring and Assessment 122: 239–258. Lytle DA, Poff NL. 2004. Adaptation to natural flow regimes. Trends in Ecology & Evolution 19: 94–100 Maceda‐Veiga A, de Sostoa A. 2011. Observational evidence of the sensitivity of some fish species to environmental stressors in Mediterranean rivers. Ecological Indicators 11: 311–317. Magalhães MF, Batalha DC, Collares‐Pereira MJ. 2002. Gradients in stream fish assemblages across a Mediterranean landscape: contributions of environmental factors and spatial structure. Freshwater Biology 47: 1015–1031. Magalhães MF, Ramalho CE, Collares‐Pereira MJ. 2008. Assessing biotic integrity in Mediterranean streams: development and evaluation of a multimetric fish index. Fisheries Management & Ecology 15: 273–289. Maitland PS. 2004. Evaluating the ecological and conservation status of freshwater fish communities in the United Kingdom. Scottish Natural Heritage Commissioned Report No. 001 (ROAME No. F01AC6). Available online at: www.snh.org. uk/pdfs/publications/commissioned_reports/F01AC6.pdf Matthews WJ, Marsh‐Matthews E. 2003. Effects of drought on fish across axes of space, time and ecological complexity. Freshwater Biology 48: 1232–1253. Minns CK, Randall RG, Cairns VW, Moore JE. 1994. An index of biotic integrity (IBI) for fish assemblages in the littoral zones of Great Lakes’ Areas of Concern. Canadian Journal of Fisheries and Aquatic Sciences 51: 1804–1822. Moyle PB, Marchetti MP. 1999. Applications of indices of biotic integrity to California streams and watersheds. In Assessing the Sustainability and Biological Integrity of Water Resources Using Fish Communities, Simon TP (ed). CRC Press: Boca Raton, FL, USA; 367–380. Moyle PB, Randall PJ. 1998. Evaluating the biotic integrity of watersheds in the Sierra Nevada, California. Conservation Biology 6: 1318–1326. Moyle PB, Marchetti MP, Baldrige J, Taylor TL. 1998. Fish health and diversity: justifying flows for a California stream. Fisheries 23: 6–15. Munné A, Prat N, Solà C, Bonada N, Rieradevall M. 2003. A simple field method for assessing the ecological quality of riparian habitat in rivers and streams: QBR index. Aquatic Conservation: Marine and Freshwater Ecosystems 13: 147–163. Munkittrick KR, Dixon DG. 1989. A holistic approach to ecosystem health assessment using fish population characteristics. Hydrobiologia 188–189: 123–135. Ninyerola M, Pons X, Roure JM. 2005. Atlas Climático Digital de la Península Ibérica. Metodología y aplicaciones en bioclimatología y geobotánica. Universidad Autónoma de Barcelona: Bellaterra, Spain. Noble RAA, Cowx IG, Goffaux D, Kestemont P. 2007. Assessing the health of European rivers using functional Copyright # 2011 John Wiley & Sons, Ltd.
ecological guilds of fish communities: standardising species classification and approaches to metric selection. Fisheries Management & Ecology 14: 381–392. Oberdorff T, Hughes RH. 1992. Modification of an index of biotic integrity based on fish assemblages to characterize rivers of the Seine basin, France. Hydrobiologia 228: 117–130. Oberdorff T, Pont D, Hugueny B, Chessel D. 2001. A probabilistic model characterizing fish assemblages of French rivers: a framework for environmental assessment. Freshwater Biology 46: 399–415. Ohio Environmental Protection Agency (Ohio EPA). 1987. Biological Criteria for the Protection of Aquatic Life: Volumes I–III. Ohio Environmental Protection Agency: Columbus, OH, USA. Paller HP, Reichert M, Dean JM. 1996. Use of fishes communities to assess environmental impacts in South Carolina coastal plain streams. Transactions of the American Fisheries Society 125: 633–644. Pardo I, Álvarez M, Casas J, Moreno JL, Vivas S, Bonada N, Alba‐Tercedor J, Jáimez‐Cuéllar P, Moyà G, Prat N, et al. 2002. El hábitat de los ríos mediterráneos. Diseño de un índice de diversidad de hábitat. Limnetica 21: 115–133. Pires AM, Magalhães MF, Moreira da Costa L, Alves MJ, Coelho MM. 2008. Effects of an extreme flash flood on the native fish assemblages across a Mediterranean catchment. Fisheries Management & Ecology 15: 49–58. Plafkin JL, Barbour MT, Porter KD, Gross SK, Hughes RM. 1989. Rapid bioassessment protocols for use in streams and rivers: benthic macroinvertebrates and fish. US Environmental Protection Agency, Office of Water Regulations and Standards, Washington DC, USA. Poff NL. 1997. Landscape filters and species traits: toward a mechanistic understanding and prediction in stream ecology. Journal of the North American Benthological Society 16: 391–409. Poff NL, Allan JD. 1995. Functional organization of stream fish assemblages in relation to hydrologic variability. Ecology 76: 606–627. Pont D, Hugueny B, Beier U, Goffaux D, Melcher A, Noble R, Rogers C, Roset N, Schmutz S. 2006. Assessing river biotic condition at a continental scale: a European approach using functional metrics and fish assemblages. Journal of Applied Ecology 43: 70–80. Pont D, Hugueny B, Rogers C. 2007. Development of a fish‐based index for the assessment of river health in Europe: the European Fish Index. Fisheries Management & Ecology 14: 427–439. Prygiel J, Coste M. 1993. The assessment of water quality in the Artois‐Picardie water basin (France) by the use of diatom indices. Hydrobiologia 269/279: 343–349. R Development Core Team 2010. R: a language and environment for statistical computing. R Foundation for Statistical Computing: Vienna, Austria. http://www.r‐project.org/ Reid SM, Yunker G, Jones NE. 2009. Evaluation of single‐pass backpack electric fishing for stream fish community monitoring. Fisheries Management & Ecology 16: 1–9. Robles S, Toro M, Nuño C, Avilés J, Alba‐Tercedor J, Álvarez M, Bonada N, Casas J, Jáimez‐Cuéllar P, Mellado A, et al. 2002. Descripción de las cuencas mediterráneas seleccionadas en el proyecto GUADALMED. Limnetica 21: 35–61. Roth NE, Allan JD, Erickson DL. 1996. Landscape influences on stream biotic integrity assessed at multiple spatial scales. Landscape Ecology 11: 141–156. Sánchez‐Navarro R, Stewardson M, Breil P, García de Jalón D, Eisele M. 2007. Hydrological impacts affecting endangered fish species: a Spanish case study. River Research and Applications 23: 511–523. Aquatic Conserv: Mar. Freshw. Ecosyst. 21: 324–337 (2011)
IBI MEDITERRANEAN STREAMS
Sanders RE, Miltner RJ, Yoder CO, Rankin ET. 1999. The use of external deformities, erosion, lesions, and tumors (DELT anomalies) in fish assemblages for characterizing aquatic resources: a case study of seven Ohio streams. In Assessing the Sustainability and Biological Integrity of Water Resources Using Fish Communities. Simon TP (ed). CRC Press: Boca Raton, FL, USA; 225–246. Scardi M, Cataudella S, Di Dato P, Fresi E, Tancioni L. 2008. An expert system based on fish assemblages for evaluating the ecological quality of streams and rivers. Ecological Informatics 3: 55–63. Schmutz S, Melcher A, Frangez C, Haidvogl G, Beier U, Böhmer J, Breine J, Simoens I, Caiola N, De Sostoa A, et al. 2007. Spatially based methods to assess the ecological status of riverine fish assemblages in European ecoregions. Fisheries Management & Ecology 14: 441–452. Simon TP, Lyons J. 1995. Application of the index of biotic integrity to evaluate water resource integrity in freshwater ecosystems. In Biological Assessment and Criteria: Tools for Water Resource Planning and Decision Making. Davis WS, Simon TP (eds). Lewis Publishers: Boca Raton, FL; 245–262. Sostoa A, Caiola N, Vinyoles D, Sánchez S, Franch C. 2003. Development of a biotic integrity index (IBICAT) based on
Copyright # 2011 John Wiley & Sons, Ltd.
337
the use of fish as indicators of the environmental quality of the rivers of Catalonia. (In Catalan). Report to the Catalan Water Agency, Barcelona, Spain. Available online at: http:// aca‐web.gencat.cat/aca/documents/ca/directiva_marc/informe_ ‐final_ibicat.pdf Torralva M, Puig MA, Fernández‐Delgado C. 1997. Effect of river regulation on the life‐history patterns of Barbus sclateri in the Segura river basin (south‐east Spain). Journal of Fish Biology 51: 300–311. Vannote RL, Minshall GW, Cummings KW, Sedell JR, Cushing CE. 1980. The River Continuum Concept. Canadian Journal of Fisheries and Aquatic Sciences 37: 130–137. Welcomme RL, Winemiller KO, Cowx IG. 2006. Fish environmental guilds as a tool for assessment of ecological condition of rivers. River Research and Applications 22: 377–396. Whittier TR, Stoddard JL, Hughes RM, Lomnicky GA. 2006. Associations among catchment‐ and site‐scale disturbance indicators and biological assemblages at least‐ and most‐ disturbed stream and river sites in the western United States. American Fisheries Society Symposium 48: 641–664. Wootton RJ. 1990. Ecology of Teleost Fishes. Chapman & Hall: London.
Aquatic Conserv: Mar. Freshw. Ecosyst. 21: 324 –337 (2011)