Department of Computer Science and Engineering, University of California,. San Diego, San ... A better understanding of the general behavior of these contents ...
IEEE TRANSACTIONS ON INSTRUMENTATION AND MEASUREMENT, VOL. 57, NO. 2, FEBRUARY 2008
345
Development and Evaluation of a Seismic Monitoring System for Building Interiors—Part II: Image Data Analysis and Results Kai-Uwe Doerr, Falko Kuester, Derek Nastase, and Tara C. Hutchinson
Abstract—Previous experiences during earthquake events emphasize the need for new technologies for real-time monitoring and assessment of facilities with high-value nonstructural contents. Moreover, there is a substantial limitation in our ability to rapidly evaluate and identify potential hazard zones within a structure, exposing rescue workers, society, and the environment to unnecessary risks. A real-time image-based monitoring system, which is integrated with warning systems, would allow for improved channeling of resources and informed decision making for rescue workers and building owners. In recognition of these issues, in this paper, we describe a methodology for image-based tracking of seismically induced motions. The methodology includes the acquisition, calibration, and processing of image sequences to detect and track object features under seismic-event conditions. We address the issue of providing a reliable feature/object-detection and object-tracking methodology for an image sequence from a single camera view. In addition, we introduce an extension to the 2-D tracking approach by providing a 3-D feature tracking methodology when the camera array itself is affected by the seismic event. The methods presented are demonstrated using the data collected during the full-scale field vibration tests conducted on a vacant building that was damaged during the 1994 Northridge Earthquake (presented in a companion paper). We present experimental tracking results of the implemented algorithms for a variety of objects and discuss additional challenges that emerge when image-based systems are used under these extreme conditions. Index Terms—Data acquisition, field monitoring, image acquisition, image processing, seismic motions, synchronization, tracking algorithms.
Manuscript received June 11, 2006; revised August 31, 2007. This work was supported by the National Science Foundation, Civil and Mechanical Systems Division under Grant 0340540 and Grant 0500225, where Dr. S. McCabe is the program manager. Any opinions, findings, and conclusions or recommendations expressed in herein are those of the author(s) and do not necessarily reflect the views of the National Science Foundation. K.-U. Doerr is with the California Institute for Telecommunications and Information Technology, University of California, San Diego, San Diego, CA 92093 USA and also with the Department of Electrical Engineering and Computer Science, University of California, Irvine, Irvine, CA 92697 USA. F. Kuester is with the California Institute for Telecommunications and Information Technology, University of California, San Diego, San Diego, CA 92093 USA, and also with the Department of Structural Engineering and the Department of Computer Science and Engineering, University of California, San Diego, San Diego, CA 92093 USA. D. Nastase was with the University of California, Irvine, Irvine, CA 92697 USA. He is now with Hope Engineering, San Diego, CA 92101 USA. T. C. Hutchinson is with the Department of Structural Engineering, University of California, San Diego, San Diego, CA 92093 USA (e-mail: tara@ ucsd.edu). Color versions of one or more of the figures in this paper are available online at http://ieeexplore.ieee.org. Digital Object Identifier 10.1109/TIM.2007.908640
I. I NTRODUCTION
A
FTER A MAJOR earthquake, the general situation inside a building is unknown. While the primary structure of a building may have performed well during the shaking, it is very likely that extensive nonstructural damage has occurred. Rooms may be inaccessible, nonstructural elements such as shelves or desks may block entrances, water pipelines may be damaged or destroyed, and electronic components may have lost power, toppled, or shifted, potentially exposing hot electrical wires. A better understanding of the general behavior of these contents during a seismic event will provide insight into more effective seismically safe design, response characterization, and prediction. This will have significant economic implications for high-cost equipment components such as computers, product prototypes, or laboratory and medical instruments. The large diversity of nonstructural components and systems increases the difficulty of gaining a basic understanding of their behavior. To understand the individual element behavior, the 3-D response of an object under varied conditions and different motions needs to be observed. Traditional methods to monitor element behavior use discrete pointwise measurement. Up to nine measurements per object could be needed to obtain its 3-D response (depending on the type of sensors and the type of content, e.g., rigid versus flexible; single versus multiple degrees of freedom), which means that a tremendous amount of sensors and wiring are required to instrument an entire room. Beyond creating a complete sensor network that has to be manually installed and subsequently maintained, these sensors can affect the natural behavior of these objects, which can lead to misinterpretation of the results. An alternative methodology is necessary to pursue the problem such that the behavior of these components can accurately be interpreted. In recognition of these issues, in this paper, we describe results of the analysis of an array of camera data collected during the vibration testing of a demonstration building. The most critical component for the analysis of these data is the detection and tracking of object features in video sequences acquired under field-test conditions. In contrast to a laboratory setup, camera arrays in the field face additional issues such as changing lighting conditions, shadow and feature occlusion, combined with a shaking (nonstatic) camera rig configuration. We introduce a 2-D imageprocessing pipeline and provide results obtained from the actual field tests. Once a reliable identification of object features in an image is achieved, commonly known multiple-view geometry algorithms can be applied to extract and calculate the 3-D
0018-9456/$25.00 © 2008 IEEE
346
IEEE TRANSACTIONS ON INSTRUMENTATION AND MEASUREMENT, VOL. 57, NO. 2, FEBRUARY 2008
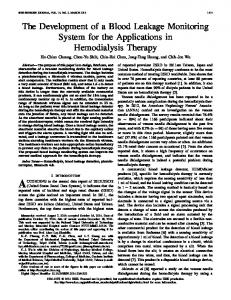
Fig. 1. Multithread image capturing and storing.
position of an object/feature. Although a complete 3-D reconstruction of feature movements could not be achieved with the video sequences collected in the present field tests, we could apply a methodology that allowed us to compare sensor data with 2.5-D tracking results obtained from the vision system. II. S OFTWARE D ESIGN The presented image-processing pipeline consists of three major building blocks: 1) image capture; 2) data archival; and 3) image processing and data analysis. Since the target application requires us to capture image sequences at high speeds (greater than 80 Hz), the implemented algorithms and tools were divided into online and offline analyses. While image capture and archive were implemented as a real-time process, which guarantees image sequences with fast update rates, the image-processing and feature-tracking algorithms were programmed in a postprocessing framework we termed SceneIdentifier. A. Image-Capture Process The image-capture process provides software-based camera synchronization, image acquisition, and time stamping. The basic hardware and software architecture for this aspect is presented in [1] and [2], however, for completeness is abbreviated here. The data-archival component handles the organization, partitioning, and storing of arbitrarily long video sequences. Digital image/video data are directly acquired from a chargecoupled device (CCD) camera through its IEEE 1394 (FireWire) interface. The implemented multithreaded framework shown in Fig. 1 avoids unnecessary wait states and allows proper control of timing and sequencing of the images captured. One thread is responsible for triggering image acquisition for the entire camera array, while four data transfer threads (one per camera) store the video streams in AVI format on dedicated
Fig. 2.
PIPC flowchart.
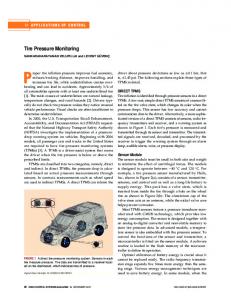
camera system disks. By using a shared memory array for each storing thread, which is capable of holding up to 256 images in each pipeline, the computational resources can be used in an efficient way by switching the CPU resources when needed. This software design in combination with a unique hardware setup [1] enables our system to acquire AVI sequences with mean frame rates of up to 79.99 frames per second (fps) when four camera images are stored in parallel. The image resolution for the AVI sequences in the system evaluation tests was 658 × 494 pixels. B. Image Analysis Pipeline The postprocessing component implements different feature detection and tracking algorithms in a pipelined approach, allowing multiple streams to be processed in parallel to obtain the desired 2-D/3-D feature information. The Open Source Computer Vision Library (OpenCV [3]) was used to implement standard feature-tracking techniques and extended to provide the needed real-time performance and tracking. 1) Feature Detection: The implemented pixel-based imageprocessing chain (PIPC) (Fig. 2) identifies trackable objects at the beginning of an image sequence using the well-known
DOERR et al.: DEVELOPMENT AND EVALUATION OF A MONITORING SYSTEM FOR BUILDING INTERIORS
Fig. 3.
Reprojection camera-calibration map.
Fig. 4.
Radial and tangential image correction. (a) Original. (b) Corrected.
347
good-features-to-track algorithm that is based on the work of Shi and Tomasi [4]. Once the object features are identified, our PIPC tracks these features in consecutive images, with the pyramid implementation of the Lucas and Kanade [5] tracking algorithm as described by Bouguet [6]. This tracking algorithm is based on the optical flow approach in combination with a similarity detection in the 2-D neighborhood by minimizing the residual function ε(d) in a predefined integration window of the size (2wx + 1) by (2wy + 1) (with wx , wy = pixel width in x- and y-directions)
ε(dx , dy ) =
ux� +wx
�
Fig. 5. Object-mask detection (manual versus automatic).
uy +wy
(I(x, y) − J(x + dx , y + dy ))
2
x=ux −wx y=uy −wy
(1) where I(x, y) and J(x, y) represent two sequenced images, ux and uy define a 2-D image coordinate of a feature, and dx and dy are the optical flow components in x- and y-directions, respectively. The algorithm is enhanced by calculating this residual with respect to the optical flow d = [dx , dy ] in each level of the image-convolution pyramid. This calculated optical-flow vector is subsequently passed to the next level as an initial feature position guess. To further enhance the achievable resolution for object-feature detection and the calibration sequence, we use a gradient-based subpixel-finding algorithm described in the OpenCV [3] to refine corner locations. The PIPC (Fig. 2) is implemented in a thread safe C++ class, which enables SceneIdentifier to run multiple timesynchronized pipelines in parallel. Before applying the tracking routine in our PIPC, the images are passed through an image
correction filter that removes radial and tangential distortions introduced by the camera lenses. 2) Camera Calibration and Image Correction: To calculate the needed distortion parameters (camera matrix), we have developed an automatic camera calibration process based on a moving chessboard pattern. To assure the quality of the calibration, the detected parameters of the calibration are validated by calculating the reprojection error for each chessboard image presented during the calibration sequence. Fig. 3 shows a typical reprojection map that is automatically calculated. The maximum and mean reprojection errors, as well as the lens center of the camera, are determined and used to evaluate the robustness of the camera matrix. Fig. 4 shows the original camera image and the undistorted equivalent after the image has been corrected with the calculated camera matrix. 3) Object-Mask Calculation: To identify the trackable object features in the scene and to reduce computation time, we use a mask-based feature-identification approach (Fig. 5). The
348
IEEE TRANSACTIONS ON INSTRUMENTATION AND MEASUREMENT, VOL. 57, NO. 2, FEBRUARY 2008
Fig. 6. Dynamic reference coordinate system (DRCS).
object mask can be determined either by user-defined regions in the acquired image (manual mode) or by referencing an image to a precalculated model of the background (automatic mode, a scene without the to-be-observed objects). The automatic mode can be used in a laboratory setup where all objects that need to be tracked can be removed first to calculate the background model. After the background model is calculated by using a single image or a sequence of images from a video stream, the to-be-tracked objects can be placed in the scene, and SceneIdentifier will automatically identify the object masks. In field test environments, the same methodology can be used to identify when the objects start to move and trigger feature detection in the changed regions. These changed regions can automatically become object masks in which good features will first be detected and then tracked over time. 4) Background Detection: To take into account a potentially dynamic viewing volume, for example, with variable lighting and expected camera movement, a running average and a standard-deviation method were implemented to calculate the background model [7]. By comparing the background model with an actual tracking frame at the beginning of a selected video sequence/portion, differences in pixel brightness and color can be used to determine the object mask. SceneIdentifier allows an analyst to switch between methods and provides an interface to adapt online, depending on threshold values, to achieve optimal results for various environmental conditions. Features of interest are then identified within the object mask. The detected object features are stored and passed to the 2-D feature tracking algorithm previously described, which tracks the movement of each feature of the subsequent image sequence. 5) Shaking Camera: In a field implementation, a number of practical issues must be overcome to assure robust image acquisition. During building vibrations, the camera and its support fixtures, which are poised to acquire data, may be shaking in a mode of vibration that is independent of the objects of interest in the scene. To overcome this shaking camera issue and to properly analyze the collected data, we introduce a
methodology for calculating the 3-D camera position that is relative to a reference pattern from a single camera image. This methodology uses the known geometric information from a chessboard pattern to recalculate the perspective transformation matrix (PPTM) and therefore the position of the CCD camera for each image in a video stream. This chessboard pattern, which is installed on a rigid object that is strategically selected to move independent of the to-be-tracked objects, can serve as a dynamic camera reference system (Fig. 6) for all 3-D position calculations. Applying this methodology to the data collected from a laboratory shake table setup demonstrates that the 3-D camera position can be calculated reliably with respect to the dynamic reference system [2]. Since the PPTM will be calculated for all cameras (two in the example shown in Fig. 6) in relation to the same reference coordinate system, two equations for each camera will be available to solve the reverse transformation from image coordinates to a 3-D feature position, where C and C � represent the corresponding PPTM p(u, ν, 1)T = CP(X, Y, Z, 1)T �
�
T
�
T
p(u , ν , 1) = C P(X, Y, Z, 1) .
(2) (3)
III. E XPERIMENTAL R ESULTS In this section, we present results of the analysis of the image data collected during field experiments described in the companion paper [8]. First, we introduce a number of practical problems encountered in the field, primarily due to variable lighting conditions. Subsequently, solutions to minimize these efforts are presented. A. Source-Lighting Fluctuations While light conditions can be optimized for a laboratory setup, real environmental effects, such as shadows, uneven scene illumination, and overall brightness fluctuation due to, for example, neon lighting, will be common in the field. These conditions affect the detection and tracking of objects and
DOERR et al.: DEVELOPMENT AND EVALUATION OF A MONITORING SYSTEM FOR BUILDING INTERIORS
Fig. 7. Changing light conditions (shadow/darkening). (a) t = 0 s. (b) t = 20 s. (c) Displacement plot.
features in real environments since they change their appearance in an unpredictable manner. As an example where source lighting affects the robustness of feature tracking, Fig. 7(a) and (b) show a tracked feature on a microscope at the beginning (t = 0 s) and at the end (t = 20 s) of a sequence. The microscope was subjected to base vibration input and moved in the plane of its support in translation and rotation. In Fig. 7(c), the corresponding displacement plot is shown in the image coordinates (x-direction). The crosses in the plots represent the real feature position in the image, which is determined by the good-features-to-track algorithm applied to a single image from the sequence at dedicated time steps. The feature was lost because of a slight change in its appearance due to the movement of the microscope towards a darker region of the observed scene. This change causes a violation of the basic assumption for constant feature brightness when an optical-flow tracking approach is used. A similar progression with an even more dramatic effect on the tracking result is observed when a neon light is used to illuminate the observation volume. Fig. 8(a) and (b) show the beginning and end of a tracking sequence, respectively. The shelf in the scene is vibrating, subjecting the glass objects to a dynamic base excitation. In this case, the loss of the feature does not occur gradually but, rather, takes place abruptly and is caused by a major change of the overall image brightness due to the neon-light illumination [see Fig. 8(c)]. As a consequence, the optical-flow algorithm could not detect a similar feature
349
Fig. 8. Changing light conditions (neon lighting). (a) t = 0 s. (b) t = 5 s. (c) Displacement plot.
Fig. 9. Image-sequence comparison of neon light and natural light condition (grayscale image).
in the neighborhood of the original feature from the previous frame, and the closest feature with an equivalent brightness value was found along the shelf edge instead. The flickering effect of a typical neon light (60 Hz) on the image sequence is shown in Fig. 9, as compared to a natural light setup when images are captured at 80 Hz. This figure shows the calculated mean pixel intensity value per image for both lighting conditions over a time period of 1.25 s. To solve the previously described problems, we enhance the optical-flow tracking algorithm by reapplying the
350
IEEE TRANSACTIONS ON INSTRUMENTATION AND MEASUREMENT, VOL. 57, NO. 2, FEBRUARY 2008
Fig. 10. Enhancement of optical flow tracking.
good-features-to-track algorithm in a predefined window region around a tracked feature. This procedure is shown in Fig. 10. For each frame, additional features (white crosses) with large eigenvalues are calculated in the predefined window region around the original feature (marked by a black circle). These additional features can be determined by calculating the eigenvalues of the 2 × 2 matrix G � � I 2 Ix Iy � x (4) G= Ix Iy Iy2
Fig. 11. Enhanced tracking under changing light conditions (shadow/ darkening).
W
where Ix = δI/δx and Iy = δI/δy are the partial derivatives in the x- and y-directions of the image I, respectively, and W is the defined window area for which nearby features are computed. A feature is considered to be well defined if the eigenvalues (λ1 , λ2 ) are above a defined threshold value λthr . SceneIdentifier allows users to change both parameters, window threshold online providing analysts with maximum flexibility and control over the image-processing pipeline. −→ Once these nearby good features (pGF i ) are calculated, the −→ closest feature to the original feature pOF will be selected by → minimizing ε −→ −→ → ε = min(pOF − pGF i ).
(5)
−→ If the distance between pOF and the selected closest feature −→ pGF min is smaller than a defined threshold distance (in our case, one pixel), then the original feature is replaced for the next track ing cycle. This procedure is applied to the previously described tracking examples (Figs. 7 and 8) to improve the overall feature accuracy and stability. The results are shown in Figs. 11 and 12, and for both cases, the detected features are now tracked over the entire image sequence and compared favorably with the true feature identified manually. Although this enhanced algorithm requires additional computing time, the robustness of the
Fig. 12.
Enhanced tracking under changing light conditions (neon lighting).
optical-flow tracking for field environments was significantly improved. B. Reflecting Light on Features A constant source lighting will not always result in a constant brightness on a target object. The characteristics and dynamic behavior of the target object will affect the degree of potential local brightness fluctuation. For example, glass and other items with natural reflective properties have local intensities that are easily modified. Initially, we utilize the enhanced optical-flow tracking algorithm to study this problem. Fig. 13(a) shows the detected features on a piece of glassware, whereas Fig. 13(b)–(d) shows the tracking results for these features at subsequent time steps (1, 3, and 4 s). It is clearly visible that the glassware specific features are lost over time as they displace.
DOERR et al.: DEVELOPMENT AND EVALUATION OF A MONITORING SYSTEM FOR BUILDING INTERIORS
351
Fig. 14. Tracking of falling glassware using a “trace image.” Test Fast425. Fig. 13. Tracking of falling glassware. Test Fast425. (a) t = 0 s. (b) t = 1 s. (c) t = 3 s. (d) t = 4 s.
In this case, weak feature characteristics and light reflections on the glassware lead to the loss of all features. For rapid changes, this is further amplified, as shown in Fig. 13(d), where a falling object is marked by a white arrow. Objects on reflective material in general (glass, mirrors, etc.) and especially glass vessels in particular pose a challenge due to reflections, refraction, and self-illumination of different parts. To detect and track moving glassware objects in this environment, we propose a different approach, which uses a background model of the image sequence, which is calculated using a mean–standard-deviation method. First, the standard deviation σ(x, y) of each image pixel value is calculated during a background detection sequence as � � � � N �1 � 2 � (S(x, y)i − m(x, y)) (6) σ(x, y) = N i=1 where S(x, y) defines the sum of pixel intensity values of a specific image pixel location over N frames, and m defines the image mean pixel intensity value with m(x, y) = S(x, y)/N . During object tracking, an object mask can be calculated to determine if a pixel p(x, y) of a given image frame belongs to the background or to a moving object: the object mask. The object mask is defined by comparing the difference between the mean intensity and the current intensity to the standard deviation σ, i.e., |m(x, y) − p(x, y)| > Cσ(x, y).
(7)
Subsequently, each pixel in a new image that fulfills the aforementioned condition (where C is a user specifiable constant) will be assigned to the object mask. The most appropriate C value has to be determined during the background detection sequence; however, if C is set to three, the three-sigma rule is satisfied. Assuming a normal distribution, 3σ results in less than 1% of the background pixels detected as part of the object mask. This approach for the background model calculation is advantageous, as compared with those of a simple snapshot
Fig. 15. Viewing volume of camera 2 during field experiments showing conventional sensors and dynamic reference pattern (DRCS). Object of interest is the unattached microscope, which was observed to translate and rotate in plane along the desk during building loading. Test Step425.
of the scene as the background model, since it can smooth out variations in the light conditions in the background model, allowing the threshold for the object-mask calculation to be defined. Once these object masks are accumulated over the whole tracking sequence, a “trace image” can be generated, which will show all major movements that occurred in the scene over time. Fig. 14 shows this trace image calculated for the falling glassware. Black areas belong to the background (static area), gray areas define the track of changes to the background, and white areas visualize the last calculated object mask. The bordered white box highlights the falling glassware path. This trace image approach allows a quick but clear view of the area where an object has moved through during the loading sequence. It therefore promises to be a very beneficial rapid damage assessment tool. C. Shaking Camera During Acquisition As noted previously, vision-based tracking systems under seismic loading face one additional major challenge. Besides the uncontrollable light conditions and unpredictable occlusion effects due to falling objects, the cameras themselves are
352
IEEE TRANSACTIONS ON INSTRUMENTATION AND MEASUREMENT, VOL. 57, NO. 2, FEBRUARY 2008
Fig. 16. Filtering reference pattern region. (a) Original. (b) Maximum. (c) Laplace. (d) Laplace + Median.
Fig. 18. Comparison of string potentiometer and camera data after geometric correction and filtering. Test Step425.
Fig. 17. Image pixel displacement in Y -direction. Test Step425.
affected by the seismic event. To overcome the shaking camera problem, a dynamic reference coordinate system (DRCS) in the scene is proposed (as described in Section II-B5). The DRCS has to be defined such that all detected object movements can be referenced to it. A chessboard pattern attached to a rigidly mounted counter or shelf, as shown in Fig. 15, can be used to define such a reference system for the collected image sequences. Our approach is to use this reference system to evaluate the calculated camera positions from a single camera view under field test conditions. Once the camera position is calculated, we can compare the vision-based tracking results for an object feature with the displacement data recorded from analog sensors (string potentiometers in this case), which are located to monitor the same object. Fig. 15 shows an example of this approach for a microscope resting on a bench-shelf system in Room 1, which is subjected to building vibration loading from Test Step425 [8]. Observations from video data indicate that this object moved in the plane of the bench top only (i.e., no rocking during testing). The object was monitored with a four camera arrays as well as three analog sensors (string potentiometers). In the following discussion, we present our efforts to analyze this and other data sets collected within individual rooms.
Fig. 19. Microscope rotation XY plot during loading sequence presented in Fig. 17.
D. Sample Results and Practical Field Issues Due to a rigid test schedule for the field vibration experiment and additional issues concerning the setup for power and network support in the field, the analysis needed to define the
DOERR et al.: DEVELOPMENT AND EVALUATION OF A MONITORING SYSTEM FOR BUILDING INTERIORS
353
Fig. 20. Microscope rotation. Snapshots at the beginning and end of Test Step425. (a) t = 0 s. (b) t = 412 s.
required reference pattern dimension under field conditions could not be performed. For security reasons, access to the building in between scheduled test sequences was very limited such that last minute system adjustments focused mainly on assuring that the data acquisition could be guaranteed. Nonetheless, in total, we recorded over 1 TB of video data during vibration loading for the three rooms that were monitored. Each of the image sequences consists of a number of video-stream blocks, and each block covers about 82.5 s of the test duration with a data size of about 2 GB. Inadequate viewing volumes used in our experiments unfortunately led to reference pattern regions in the images for which the chessboard pattern could not be detected reliably. Efforts to enhance the reference pattern in the video sequences during postprocessing included filtering and convolution of the pattern region. However, these tended to introduce additional pixel errors by strengthening and weakening the image gradients unreliably. These effects led to changing reference pattern features (chessboard square intersections) and therefore to an unreliable calculation of the camera position (see filter examples in Fig. 16). Although the direct 3-D tracking of objects in the collected video sequences was not possible under the aforementioned conditions, we used a straightforward approach to extract a relative 2.5D object movement to test the capabilities of our algorithms. By subtracting the pixel displacement information of the DRCS (chessboard center square) from the displacement of an object feature, we extract the general displacement information stored in a single camera image sequence in the x- and y-directions. A sample of this analysis is shown in Fig. 17 where the detected pixel displacement in the YI direction (image coordinate system XI , YI ) for the reference system (pattern) and a feature (f 0) on the microscope are plotted versus time. The high frequency displacement in these plots is largely caused by the movement of the camera itself due to the shaking of the mounting wall inside the building. The amplitude characteristic of this displacement is small and comparable to the noise level of the analog sensor, which allows a direct comparison between the two signals (Fig. 18). The signals in the first part of the sequence appear very similar, which indicates that no relative movement between the reference system and object feature (f 0) took place. At approximately 310 s, the signals show the
onset of displacements, which can be interpreted as the feature on the microscope moving relative to the reference system. To compare the vision-system-detected relative pixel displacement with the analog sensor data, we use a geometrical approach to convert the image coordinate displacement to the rotated desktop coordinate system XR , YR (Fig. 15). Assuming that the mean displacement is small and occurs mainly in the YR direction and that the perspective distortion is minimal, displacement data can be calculated when the distance between feature and camera is known. By measuring these distances in the field and applying a fourth-order bandpass butterworth filter to both data sets, the signals shown in Fig. 18 are extracted. A comparison of the signal from the analog potentiometer sensor with the displacement data from the camera shows that we are able to detect the onset of the microscope movement. It also indicates that the pixel subtraction approach is not suitable to filter out the camera movement completely. The displacements detected by the image sequence over time slightly drift from those detected with the string potentiometers as the microscope moves further away from its original position. This reflects the fact that the measured camera-object distance is changing during the sequence due to the shaking of the wall in which the camera was mounted and the rotation of the microscope. Therefore, the aforementioned assumption of small movement is violated, and a comparison between both data sets is only valid within a small region. Although this method of generating position information is not usable as a precise measurement method for 3-D feature tracking, it shows that the introduced 2-D PIPC is capable of reliably detecting and tracking object features over time without the loss of detected features. It can also serve as a method for approximating the general movement of an object. In our case, we could approximate the rotation of the microscope when a mean camera feature distance of two features is used (Fig. 19). The calculated displacement reflects the observed rotation of the microscope that can be seen in Fig. 20(a) and (b), which show snapshots of the microscope position before and after dynamic loading. IV. C ONCLUSION In this paper, we present a framework for video-based object tracking for use in field monitoring, specifically within building interiors. Experimental evaluation of the system demonstrates
354
IEEE TRANSACTIONS ON INSTRUMENTATION AND MEASUREMENT, VOL. 57, NO. 2, FEBRUARY 2008
that good results are attainable at data acquisition rates of 80 fps using commodity components in a unique hardware setup. We demonstrate the capability of the proposed PIPC to reliably detect and track image features under dynamic loading conditions. Several tracking challenges under field conditions were discussed, namely, source and object light fluctuations and the issue of the camera shaking during building loading. The data sets collected during the field experiments (presented in a companion paper) are used to demonstrate these issues and present individual algorithm solutions. We also present a very viable gross analysis approach using a trace imaging concept, which can provide valuable for quick assessment of changes in a scene due to building shaking.
Falko Kuester received the M.S. degree in mechanical engineering and the M.S. degree in computer science and engineering from the University of Michigan, Ann Arbor, in 1994 and 1995, respectively, and the Ph.D. degree from the University of California, Davis, in 2001. He is currently an Associate Professor with the Department of Structural Engineering and the Department Computer Science and Engineering, University of California, San Diego, and is the Director of the Center of Graphics, Visualization and Imaging Technology (GRAVITY), California Institute for Telecommunications and Information Technology (Calit2), University of California, San Diego. He is currently the Calit2 Professor for Visualization and Virtual Reality.
ACKNOWLEDGMENT The authors would like to thank B. Kazanjy and other research staff of the Structural Engineering Test Hall and the Visualization and Interactive Systems Group at the University of California, Irvine, for their assistance. The authors would also like to thank Prof. J. Wallace and Prof. J. Stewart at UCLA for allowing them to join this unique field experiment. R EFERENCES [1] T. C. Hutchinson, F. Kuester, K. Doerr, and D. Lim, “Optimal hardware and software design of an image-based system for capturing dynamic movements,” IEEE Trans. Instrum. Meas., vol. 55, no. 1, pp. 164–175, Feb. 2006. [2] K. Doerr, T. Hutchinson, and F. Kuester, “Methodology for imagebased tracking of seismic-induced motions,” in Proc. SPIE—Smart Structures/NDE, 2005, pp. 321–332. [3] Intel Research Group, Open Source Computer Vision Library, 1999–2001. Intel Corp., original issue edition. [4] J. Shi and C. Tomasi, “Good features to track,” in Proc. IEEE Conf. CVPR, Seattle, WA, Jun. 1994, pp. 593–600. [5] B. D. Lucas and T. Kanade, “An iterative image registration technique with an application to stereo vision,” in Proc. IJCAI, 1981, pp. 674–679. [6] J. Bouguet, “Pyramidal implementation of the Lucas Kanade feature tracker, description of the algorithm,” Microprocessor Res. Labs, Intel Corp., Santa Clara, CA, Tech. Rep. 1999. [7] T. C. Hutchinson, F. Kuester, K. Doerr, D. Lim, K. Kanda, N. Kurato, H. Ukon, M. Oshio, and A. Kondo, “Vision-based motion tracking for risk assessment during seismic events,” CUREE Kajima Phase V Rep., 2004. [8] D. Nastase, S. R. Chaudhuri, R. Chadwick, T. C. Hutchinson, K. Doerr, and F. Kuester, “Development and evaluation of a seismic monitoring system for building interiors—Part I: Experiment design and results,” IEEE Trans. Instrum. Meas., vol. 57, no. 2, pp. 332–344, Feb. 2008.
Kai-Uwe Doerr received the Ph.D. degree from the Darmstadt University of Technology, Darmstadt, Germany, in 2004. He is currently a postdoctoral researcher with the California Institute for Telecommunications and Information Technology, University of California, San Diego, and also with the Department of Electrical Engineering and Computer Science, University of California, Irvine. His current work focuses on image-based tracking algorithms, cluster-based large-scale data visualization, and human factors research for interactive 3-D visualization technologies. His expertise includes virtual cockpit simulation, virtual prototyping, computer vision, and 3-D database generation.
Derek Nastase received B.S. degree in architectural engineering from California Polytechnic State University, San Luis Obispo, in 2003 and the M.S. degree from the Department of Civil and Environmental Engineering, University of California, Irvine, in 2006. He is currently a Design Engineer with Hope Engineering, San Diego, CA.
Tara C. Hutchinson received the M.S. degree in civil engineering (structures) from the University of Michigan, Ann Arbor, in 1995 and the Ph.D. degree in geotechnical and structures from the University of California, Davis, in 2001. She is an Associate Professor with the Department of Structural Engineering, University of California at San Diego, La Jolla. Her research interests include both experimental and analytical studies, primarily in earthquake engineering and emphasizing seismic performance assessment of structures, particularly soil-structure interaction, seismic response of concrete and timber structures, and response of nonstructural components. She also develops computer vision and visualization techniques to investigate and solve structural engineering problems. Dr. Hutchinson is a member of CUREE Board of Directors and on the Editorial Board of the Earthquake Engineering Research Institute’s Earthquake Spectra.