Monitoring System Models with. Accuracy-Enhanced Neural Networks. Bon Hyun Koo, Hyong Chol Kim, and Soon Heung Chang. Abstract-Core monitoring ...
1341
IEEE TRANSACTIONS ON NUCLEAR SCIENCE, VOL. 40,NO. 5, OCTOBER 1993
Development of Real-Time Core Monitoring System Models with Accuracy-Enhanced Neural Networks Bon Hyun Koo, Hyong Chol Kim, and Soon Heung Chang
Abstract-Core monitoring models have been developed with use of neural networks for prediction of the core parameters for pressurized water reactors. The neural network model has been shown to be successful for the conservative and accurate prediction of the departure from nucleate boiling ratio (DNBR). Several variations of the neural network technique have been proposed and compared based on numerical experiments. The neural network can be augmented by use of a functional link to improve the performance of the network model. Use of two-fold weight sets or weighted system error backpropagation was very effective for improving the network model accuracy further. Uncertainty factor as a function of output DNBR is used to obtain the conservative DNBR for actual applications. The predictions by the network model need to be supported by extensive training of network and statistical treatment of the data. Studies for further improvements are suggested for the actual applications in the future.
I. INTRODUCTION
M
AINTAINING a nuclear power plant within its limiting conditions for operation (LCO) is required for safe operation and acceptable transient consequences. Many systems are in use to provide information to help the operators in maintaining LCOs or to activate automatic safety equipment whenever necessary. Some core parameters important to the safety of the plant need to be closely monitored through these systems in real-time. One of the most important core parameters, in the case of pressurized water reactors (PWRs), is the departure from nucleate boiling ratio (DNBR). Since DNBR is not directly measurable but derived secondarily from several core related variables by a complicated calculation, DNBR has not been explicitly available to the operators until recently. DNBR is defined as the ratio of the critical heat flux to the current peak heat flux at the same thermal hydraulic conditions and, therefore, represents the thermal margin of the core to the assumed fuel failure. Processing of system inputs for use in a software model includes several steps: taking measurement, checking the values against transducer limits, and conversion of meaManuscript received March 19, 1993; revised June 10, 1993. B. H. Koo and H. C. Kim are with the Korea Institute of Nuclear Safety, 150 Dukjin-dong, Yusong-gu, Taejon, 305-353, Korea. S. H. Chang is with the Korea Advanced Institute of Science and Technology, 373-1 Kusong-dong Yusong-gu, Taejon, 305-701, Korea. IEEE Log Number 9211474.
surements to engineering units. The actual DNBR is obtained by complicated thermal hydraulic codes with use of these processed inputs. Since use of these kind of codes involves rather complex calculations with extensive data storage, some simplification of the calculation model is often required for on-line applications. This paper intends to develop a model that can provide the desired results in real-time with due reliability and accuracy required for safety-sensitive core parameters such as DNBR. Neural networks (NNs) have been chosen as an ideal tool for this purpose. NNs have emerged during the past decades as one of the most rapidly evolving technologies used extensively in various fields of information processing. The application of neural networks to some of the problems of operating nuclear power plants appears to have the potential to enhance the safety, reliability, and operability of these plants [1]-[5]. However, many of these works are still in the feasibility stage. For practical use in operating nuclear power plants, the neural network model needs to be improved to enhance its accuracy to meet the appropriate requirements. Our study of the NN model development relies on computer simulated numerical experiments. We have used the well-known COBRA code [6] to represent the in-core thermal hydraulics of typical 2-loop PWRs. We propose new strategies for NNs for PWR core monitoring and prove the effectiveness of the strategies by showing the performance of the developed model against the numerical experiments on DNBR. The proposed concept can be readily extended to accommodate the specific application requirements. 11. SYSTEM MODELSAND NEURALNETWORKS A. Backpropagation Network A neural network consists of many processing elements joined together through connection weights. These processing elements are structured in three or more layers: input layer, output layer, and hidden layers. The number of nodes in the input layer (Ni,,) corresponds to the number of system input signals, and the output layer has as many nodes (Nout)as the resultant signals that the network is to generate. One hidden layer is usually con-
0018-9499/93$03.00
0 1993 IEEE
IEEE TUANSACTIONS O N NUCLEAR SCIENCE, VOL. 40, NO. 5 , OCTOBER 1993
1348
sidered sufficient to compute any function [7]. The number of nodes in the hidden layer depends on the problem, but (No,, + Ni,)/2 is generally known to be a reasonable compromise between the network’s coverage on the complexity of the problem and the calculational burden, when no information from previous experience is available [SI. The number of hidden nodes can be increased to accom+ 1) is modate more complex problems, but Nou1(Nin known as the maximum number [Y]. There are several different kinds of learning methods commonly used with neural networks. The learning algorithm used in this study is the so-called supervised learning, in which the backpropagation algorithm is used with the generalized delta rule. The formal derivation of the algorithm can be found in [lo] and [11]. The generalized delta rule allows a gradient descent in the squared sum error at the output for adjusting the connection weights by Awl
dE =
-77-,
(1) w,,
where w l j indicates the connection weight between node i in the lower layer and node j in the upper layer, 77 is the learning rate, and E is the squared sum error of the network system (system error) defined by
When establishing the set of the training patterns, randomness of the input vectors is required, since, if the input vectors are populated more densely on some portion of the vector hyperspace, the trained neural network will yield better predictions on that portion, while poorer in the rest of the input vector hyperspace. When the training data are to be collected from actual measurements, preprocessing of data with a self-organization network may be useful to rearrange the original training patterns [12]. Most of the computational burden in the application of neural networks is in network training. Once the learning phase is terminated, i.e., connection weights are determined with a sufficiently small system error, a neural network can accept a signal vector and then produce a response almost instantaneously through the “feedforward sweep” calculation with a given accuracy. This is the key reason the NN model is especially appropriate for the real-time core monitoring. Some statistical analyses of the predicted results is required to support the reliability of the NN model prediction. C. Functional-Link Net
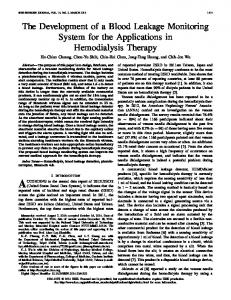
In applying the classical neural network model to parameter prediction in a complicated system performance prediction, such as DNBR monitoring for PWR cores, the learning rate for the generalized delta rule with a classical network structure is often unacceptably low. The network 1 capacity for pattern classification generally depends on E =T C (f,,k - o,!, )’. (2) the size of weight matrix, i.e., the number of weights P k connecting nodes in the network. If the storage capacity where t represents the target value for the supervised of a net is exceeded, the net is subject to a large error and learning and o represents the output value determined by is invalidated for the intended purposes. Some of these difficulties can be alleviated by making the network, and p and k denote the index for training patterns and the index for output nodes, respectively. The use of “high-order’’ terms in the network. The prediction initial weight coefficients are input by random numbers accuracy can be much improved by adding several addibetween -0.5 and + O S in order to reduce possibilities tional input nodes and accordingly some hidden nodes. for trapping in the local minima of the system error. Input values for these additional nodes are provided by a functional link [13]. Although using a sufficient number of B. Network Architecture and Numerical Experiments high-order terms in the input layer can eliminate the In this study, a three layer network using the backprop- hidden layer, the hidden layer needs to be retained with a agation algorithm is used to adjust the initially input moderate increase in the number of high-order input weight coefficients into the optimized weight set. The five nodes. Fig. 1 shows schematically the network augmented input parameters for the network are selected: inlet by the functional link over the original net. Recognizing coolant temperature, core average heat flux, enthalpy rise the emphasis on the real-time application of the NN peaking factor, coolant inlet flow rate, and system pres- model for the cases of parameter monitoring, improvesure. These input signals are normalized between 0 and 1 ment in the convergence rate is not so eagerly sought as and cover all possible occurrences of any anticipated the accuracy improvement. The “high-order’’ terms are variations in the operation of the plant during transient as not solely limited to higher-order terms of the original well as steady-state operation. The input vectors, which input signals, but could be any function of the input have five elements in this case, are prepared in a ran- signals generated by the action of the functional link. In domly uniform manner so that the resulting prediction one sense, no new ad hoc information is inserted into the error by the networks is supposed statistically irrelevant to process by the functional link; nonetheless, the representhe choice of the input vector. The DNBR values are tation is definitely enhanced, and separability becomes ranged between 1.0 and 9.0, excluding unreasonable ex- possible in the enhanced space. Therefore, the tremity. The range of the target DNBR outputs are again functional-link net is useful especially when high accuracy normalized linearly to the intermediate range of 0.2-0.8, is required with a limited number of input signals, such as since the output value for the sigmoidal function of the in core monitoring. Since the neural network can be considered essentially neural netwoik is inherently limited between 0 and 1.
K O 0 er al.: REAL-TIME CORE MONITORING SYSTEM
1349
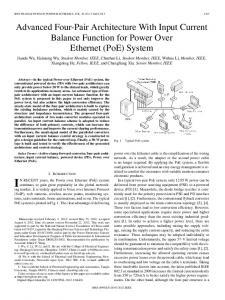
avoided. When DNBR approaches the limit, automatic corrective actions are activated, or on reaching the limit, the reactor is tripped automatically. Therefore, DNBR ..-..-. . .needsto beA predicted more accurately when it falls in the sensitive band near the setpoint. For this, the neural Output Layer 0 I network is trained twice and obtains two sets of weight coefficients; one for the whole operation range (coarse range matrix) and the other for the narrow range of the sensitive band (fine range matrix). Normally the DNBR value is determined with the coarse weight matrix. When the predicted DNBR by the NN falls in the sensitive band, the forward sweep calculation is performed again with the fine weight matrix, giving a more accurate DNBR. Since the time spent on the forward sweep is negligible, this double calculation does not / / Generator cause any problems associated with the real-time applicaEnernd Signal tion of NN. Since the weight matrix over the sensitive Fig. 1. Augmented network by functional link. band is defined twice, we call it a two-fold weight matrix. The calculation scheme with the two sets of weight coefficients is shown in Flowchart form in Fig. 2. If the same as a mapping function, the gains of modeling by the level of accuracy should be demanded over the whole functional link can be easily understood by taking an range of the plant operation, one can divide up the whole example. If the mapping function that one tries to model range into several narrow ranges, and then prepare one by NN contains a certain type of term which cannot be coarse range matrix with as many fine range weight matriobtained by any combination through networking with ces as there are narrow ranges defined. The NN model original inputs, the network will be trained to approximate with this multiple two-fold weight set can provide a much the function to yield the least square error. If this specific improved prediction. term is provided as an additional input through the functional link, the NN model has a much better chance to E. Weighted Error Backpropagation reproduce the target function accurately. In the supervised learning process, the target-output Augmented Net
r-
D. Use of Two-fold Weight Matrix The modeling accuracy of NN can be enhanced by use of the functional link approach. However, there must still be some kind of compromise between the size of the weight coefficient matrix and the prediction accuracy. There exists a point where the modeling accuracy cannot be enhanced further by use of a functional link and the accuracy improvement is not cost-effective for the additional amount of computation required for the more complex network structure. Here we need to introduce an alternative technique other than the functional-link net to improve the NN modeling capability. Quite often the operational range of the system parameter is too wide to be covered by a single scale. Similarly this is true for the weight coefficient matrix of a neural network. The NN model generates outputs more accurately over a narrower range. When the accuracy requirement is tighter over a “sensitive band,” the model can use another weight coefficient matrix which was prepared specifically for that sensitive band, which is narrower than the whole range. In monitoring DNBR for PWRs, the prediction accuracy is not equally demanding over the whole range of anticipated operational transients. Typically, a DNBR of 1.3 is set as the limiting value for LCO. This limiting value is within the training data range of 1.0 to 9.0, so that possible error amplification at the edge of the range is
matching can be intensified for some group of patterns so that the prediction accuracy is increased for this particular group of patterns. This can be materialized in the backpropagation algorithm by using the weighted system error. The squared sum system error by (2) is now redefined as follows:
where f ( . ) is the weighting factor and may be a function of any variable that needs to be counted for the intended purpose. In predicting DNBR, more weighting is required to increase the prediction accuracy when the DNBR value approaches the limiting value. Therefore, f(-) needs to be a function of the output value. Since there is only one output node in this study, index k drops out and finally the system error takes the following form:
f(o,) should be chosen such that the trained network by the above error allows a more generous prediction when the core thermal margin is adequate. The backpropagation algorithm with this redefined error follows the same procedure with only slight modifications.
1350
* a
IEEE TRANSACTIONS ON NUCLEAR SCIENCE, VOL. 40, NO. 5, OCTOBER 1993
Get Signal
Coarse Weight Matrix
Forward Sweep Calcubtion
Fine Weight Matrix
Case W3-a r
0 0
20
I M
r
I SO
I
I
110
I 100
(T housonds) N o . o f Iterations
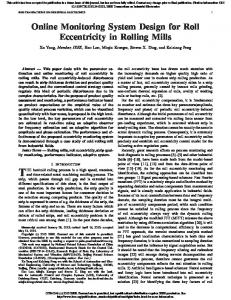
Fig. 3 . System error variation over iteration for cases W3 and W3-a
high-order cross terms were implicitly accounted for through the operation of the sigmoidal activation function in the hidden layer. One new node was added in the hidden layer. This network augmentation caused the total number of connection weights, including thresholds, to Fig. 2. On-line neural network calculation loop with two-fold weight increase from 36 to 73. The convergence rate of training matrix. by the augmented NN of Case W3-a was much larger than that of the 5-5-1 structured network as shown in Fig. 3. The tail error is much smaller, implying that the repre111. MODELDEVELOPMENTS AND RESULTS senting capability of the augmented NN is far better. A. Whole Range Network Model The prediction performance of the networks can be Neural networks with the classical three-layer structure evaluated by the recall results of the untrained patterns. have been used for predicting core DNBR. The five input The training and recall results are summarized in Table I signals are represented as a vector consisting of five for the two cases: Case W3 with the 5-5-1 structure and elements. Input signal vectors for the training patterns Case W3-a with the 10-6-1 structure. For comparison have been selected randomly, yet rather uniformly, over purposes the results were obtained with ‘cumulative backthe domain of vector space spanning the anticipated oper- propagation’ training, where no interruptions were made ations of the nuclear power plant. The Latin square (or during the iteration to change the learning rate and hypercube) sampling method [14] has been used for this momentum rate coefficients. The wide range untrained purpose. The target DNBR corresponding to the input pattern set has a size of 1000 and is used for all the cases signal vector was determined by use of the COBRA code. listed in the table. Data in the 4th column in Table I show The size of the training data set was 300, which is consid- the results of “self-recall’ where the same pattern set was ered sufficiently large for the given network structure. used for training and then recalled with the connection Training as a first trial was performed with the struc- weight set resulting from the training. The results of ture of 5-5-1, meaning 5 input, 5 hidden, and 1 output “self-recall” represent how well the training was pernodes. In this case the size of the hidden layer is larger formed or how closely the resultant network approximates than three resulting from (No,, + Nin)/2. Therefore, the the given training patterns. On the other hand, data in net is expected to give slightly more accurate results than column 5 show the recall results for the patterns that were that with the 5-3-1 structure as described in Section 11-A. not among the training set, but expected to be predictable The iteration of training continues until no appreciable with the trained network. error reduction is possible. As can be seen in Fig. 3, the It is believed that the standard deviation of the ratio of system error of Case W3 drops rapidly initially and then the predicted output to the target ( g )is representative of levels off at a certain value. This value is defined in this the accuracy of the model prediction. As noted previously, paper as the “tail error.” The tail error depends on the the augmented network by the functional link has a modeling capacity of the neural network for the same set smaller ratio deviation. Naturally cr tends to increase of training data. when the untrained pattern set is recalled. The minimum An augmented network was structured in 10-6-1 by use and maximum ratios are also important to note. From a of a functional link. Five more nodes were added in the safety point of view, the maximum ratio needs to be input layer and the squared values of the five original accounted for in the uncertainty of the NN model, beinput signals were provided to the new input nodes. Other cause the model overpredicts the core DNBR by that
K O 0 et al.: REAL-TIME CORE MONITORlNG SYSTEM
1351
TABLE I SUMMARIZED RESULTS OF
Case
w3
No. of iterations
Network system error
100,ooo
1.16 X lo-’
Results for self-recall
100,ooO
1.10 x 10⁻⁶
Untrained recall
Untrained recall
for whole range set
for narrow range set
2.68 X lo-’ (0.888,1.134)
1.017 3.72 X lo-’ (0.894,1.224)
1.001 7.46 x 10⁻³ (0.981,1.053)
1.Ooo 1.42 X (0.961,1.135)
p = 1.013 U
W3-a
NETWORK TRAINING AND RECAU
100,OOO
9.89
X
N3-a
27,531
1.00 X
N10
N10-a
100,OOO
8,155
3.19 X
1.00 x
U
63,260
1.00 x
-
p = 1.004
1.22 x 10⁻² (0.971,1.048)
-
1.008 U = 2.11 x 10⁻² (0.937,1.138)
-
=
1.002 1.37 X lo-’ (0.929,1.053) jl =
U
-
jl =
p = 1.002
1.006 2.07 X lo-* (0.939,1.109) p = 1.001 U = 1.21 x 10⁻² (0.949,1.053) U =
-
=
=
/J =
-
1.OoO U = 3.91 x 10⁻³ (0.984,1.031) p
U =
-
1.002 3.66 X (0.877,1.131) =
U = 1.21 x (0.952,1.085)
N30-a
/J =
=
jl =
U
1.009 2.07 X lo-’ (0.939,1.104) p = 1.000 U = 4.21 X (0.857,1.139)
p =
/. = I
U
U = 4.74 x 10⁻² (0.869,1.300)
U =
=
N3
p = 1.059
jl =
=
p = 1.000
4.16 x 10⁻³ (0.977,1.029) U =
is the average ratio of the predicted output to the target. is the standard deviation of the ratio. ( ) contains the minimum and maximum of the ratio. ‘Self-recall’ means recall using data used in training NN. ‘Untrained recall’ means recall using data not used in training NN. jl
U
ratio. On the other hand, the minimum ratio affects the operational economy, because the smaller the ratio is, the more probable unnecessary activations of safety devices are. Based on the results of Case W3-a, the DNBR predicted by the network is required to be divided by 114% of uncertainty factor to obtain a conservative 15% DNBR value and then the model is susceptible to P 103 ( = 0.961/1.135) of underprediction. The training improvement in Case W3-a compared with Case W3 was not fully realized in the untrained recalls based on the minimum/maximum ratio. This implies also that the size of 97 ! ”, the training set, 300, is not sufficiently large to incorpo9 rate all the physics related to the core DNBR over the Fig. 4. Prediction performance for case W3-a. whole range. To further examine the prediction results more closely, B. Narrow Range Training and Recall the ratio of the predicted and the desired was plotted as a A narrow range of DNBR is set over the “sensitive function of the output DNBR. In Fig. 4 for Case W3-a, one can find that large uncertainties occur only near 1.0 band” with the DNBR values between 1.2 and 1.9. The of DNBR. Therefore, if the trip setpoint is to be set above training (Case N3) was performed with cumulative back1.2 and all the extreme ratios are excluded, the prediction propagation training and the convergence behavior was uncertainty can be assessed as 5% over the operating compared with that of the whole range training (Case W3) in Fig. 5. Training with the 5-5-1 structured network fell range. Although these results are not the best, the uncertainty relatively slowly and did not reach the tail error even with the model is rather large. Upon examining Fig. 4, upon termination with a maximum iteration number of there is an apparent trend in the ratio as a function of the 100,000. Training with the 10-6-1 structured network (Case output DNBR. This implies that the physics associated N3-a) was much quicker as shown in Fig. 6. with DNBR is different in the lower and higher ranges of Data in column 6 of Table I are the recall results for DNBR. In the next section, we discuss the narrow range the same pattern set that has been formed as the reference set in the narrow range for comparison purposes. training to cope with this kind of difficulty.
-
-
1 02 I O 1
1
-
0 99
098
0
-
I
I
096
J
5
Oulpul DNUR
7
IEEE TRANSACTIONS ON NUCLEAR SCIENCE, VOL. 40, NO. 5, OCTOBER 1993
1352
1
Care W3
I
0 0
10
10
CO
IO
100
(Thousands) No. o f Iterations
20
0
60
80
IO0
(Thousonds) No. o f lierotions
Fig. 5. System error variation over iteration for cases N3 and W3.
IO
0
1
Fig. 7. System error variation over iteration for cases N3 and N10.
C. Real Life Applications of the Proposed Techniques
To apply the proposed technique of a two-fold weight matrix, we have chosen the weight sets from Cases W3-a and N30-a. Recall using these two-fold weight sets yielded the overall prediction performance as shown in Fig. 8. Upon comparing Figs. 4 and 8, one can see the clear reduction of prediction error over the “sensitive band.” With use of this two-fold matrix, the network model can predict the DNBR value quickly over the whole operating C a s e N3 range with reasonable accuracy for the core status display but with tighter accuracy when the reactor core needs to be protected from fuel failure. The result was also pre0 10 M ao IQ0 sented in the form of prediction against target in Fig. 9 As (Thousands) No. o f Iterations expected all data points fall around the line y = x. As another variation of the backpropagation algorithm, Fig. 6. System error variation over iteration for cases N3 and N3-a. the weighted system error method was tried with the weighting function of f(o> = 1/02. The weighting funcThe results for untrained recall for the narrow range show tion of this form gives a relatively small contribution to a clear improvement over counterparts of the whole range the system error for large DNBR, while it gives a relatrained network. The uncertainty has dropped by half tively larger contribution as DNBR approaches its limiting when comparing the maximum ratios of Cases W3-a and value. The recall results from this training are shown in Fig. 10 and Case W3-a-t of Table 11. The general shape of N3-a. To check the appropriateness of the size of a training the ratio has shifted to the higher range so that the model set, the size of the training set was increased to 1000 and predicts the core DNBR more strictly as it approaches the trainings were performed separately: Cases N10 and N10-a critical value. Case W3-a-e of Table I1 resulted from for 5-5-1 and 10-6-1 structures, respectively. The conver- further training of Case W3-a of Table I to reduce the gence behavior of case N10 was compared with that of N3 system error to a smaller value. The system error shown in Fig. 7. The final system error of case N3 is approxi- for Case W3-a-t was evaluated based on the definition by mately 3 times as large as that of case N10. If we consider (2). Even though the system error of Case W3-a-t is the fact that the patterns per iteration in case N10 are larger, the recall results by the minimum/maximum ratio about 3 times more than those in Case N3, this result is are much better than those of Case W3-a-e. It should be expected because the input signal vectors are randomly noted here that this improvement is due to the specific distributed in the vector hyperspace. One can see a slight choice of the weighting function for the core DNBR improvement of the NN model by using the larger size prediction. To further improve the prediction in low training pattern set, but not much. Finally, we generated a DNBR values, the minimum normalized target value of training pattern set of size 3000, and trained NN some- 0.4 instead of 0.2 was tried. Prediction accuracy improved what exhaustively. Model prediction of DNBR for this as shown in Case W3-a-x of Table 11. case is accurate within 3%, indicated as Case N30-a in In cases where the calculated ratio of the DNBR preTable I. dicted to the target is dependent on the output value, it is
b
U)
-
K O 0 et al.: REAL-TIME CORE MONITORING SYSTEM
>
1353
I,
? 09
100 I 07
1.06 105
,"
104 103
p
I02
B
I
b
IO1
0 99
0 97
0
0.90 0
0.97
096
0 96
, 3
1
5
7
9
Output ONBR
Fig. 11. Prediction results above trip setpoint.
Fig. 8. Prediction performance with two-fold weight matrix.
9
TABLE I1 RESULTS OF ADDITIONAL NETWORK TRAINING
7
Case ~
~~
W3-a-e
Results for self-recall
Network system error
8.06 X lo-'
6.59 x 10⁻³ (0.978,1.042)
1.001 1.25 X lo-' (0.964,1.125)
0.996 5.03 X (0.978,1.012)
0.997 7.18 X (0.956,1.051)
1.OOO 3.66 X lo-' (0.989,1.018)
p = 1.OOO
p = 1.OOO =
W3-a-t
9.39 x
p =
U =
W3-a-x
Untrained recall for whole range set
~
8.68
X
lo-'
p =
U
=
p = U =
p = U
=
= 5.32 x 10⁻³ (0.974,1.042)
See notes of Table I. largrl DNBR
Fig. 9. Predicted output against target with two-fold weight matrix.
11 was tested with several training sets which are totally independent, and was proven to be conservative for all sets tested. One should note in Fig. 12b that the neural network generates an output which is a conservative underprediction of the core DNBR for real-time applications.
IV. CONCLUSIONS
096
- 0 00 -
095
7
097
0 0
I 3
5
9
desirable to use this varying degree of uncertainties over the output value. If we' choose a simple function of uncertainty factor, e.g., the solid line shown in Fig. 11, to envelop all the ratio data points that have DNBR values greater than 1.2, and apply it to the calculated DNBR to obtain the final DNBR prediction, the network model yields the results for this final predicted DNBR as shown in Fig. 12. The uncertainty factor function shown in Fig.
NN models have been tried for conservative and accurate prediction of the core DNBR for PWRs. Several variations of the neural network technique have been proposed and compared based on the numerical experiments. Augmenting the network by use of the functional-link technique increases the accuracy of the network model and also improves the convergence of training dramatically. Use of two-fold weight sets or the weighted system error backpropagation was very effective for improving the network model accuracy further. Placing the normalized target values also affects the model accuracy, especially at the boundary of the operating range. A proper uncertainty factor as a function of output DNBR needs to be chosen to obtain the conservative DNBR in actual applications. Extensive training of network and statistical treatment of data with sufficiently large training and test pattern sets is worth investing when considering the cost for developing on-line core monitoring systems. Studies on the more
1354
IEEE TRANSACTIONS ON NUCLEAR SCIENCE, VOL. 40,NO. 5, OCTOBER 1993
0.98
g E”
0.97
0.96
0.95
0.94
o.9~
Fig. 12. Conservative prediction with uncertainty factor applied.
complicated augmentation of the network structure by the functional link are recommended at the actual application stage in the future. Based on the results with the two-fold matrix, use of multiple two-fold weight matrices is also concluded to be effective for improving model prediction accuracy for the other core parameters which need the same level of accuracy over the whole operating range. REFERENCES R. E. Uhrig, “Potential application of neural networks to the operation of nuclear power plants,” Nucl. Safety, vol. 32, no. 1, p. 68, 1991. B. R. Upadhyaya, E. Eryurek, and G. Mathai, “Application of neural computing paradigms for signal validation,” Proc. 7th Power Plant Dynamics, Control Testing Symp., vol. 1, p. 27.01, University of Tennessee, Knoxville, Tennessee, 1989. R. E. Urig and Z. Guo, “Use of neural networks in nuclear power plant diagnostics,” Proc. Int. Conf. Reliability, Availability and Maintenability of Nuclear Power Plants, Madrid, Spain, April 1989. H. G. Kim, S . H. Chang, and B. H. Lee, “Pressurized water reactor core parameter prediction using an artificial neural network,” Nucl. Sci. Eng., vol. 113, pp. 70, 1993. H.-K. Kim, S.-H. Lee, and S.-H. Chang, “Neural network model for estimating departure from nucleate boiling performance of a pressurized water reactor Core,” Nucl. Tech., vol. 101, p. 111, 1993. C. L. Wheeler and D. S . Rowe, “COBRA-IV: An interim version of COBRA for thermal hydraulic analysis rod bundle nuclear fuel elements and cores,” BNWL-1962, Battelle Pacific Northwest Laboratory, 1976. J. E. Spencer, “Real-time applications of neural nets,” IEEE Trans. Nucl. Sci., vol. 36, no. 5, p. 1485, Oct. 1989. J. Stanley, Introduction to Neural Networks, California Scientific Software, Sierra Madre, California, p. 172, 1989. R. P. Lippman, “An introduction to computing with neural nets,” IEEEASSPMag., vol. 4, no. 2, p. 3, 1987. J. A. Freeman and D. M. Skapura, Neural Networks-Algorithms, Applications, and Programming Techniques. Massachusetts: Addison-Wesley, Reading, 1991. J. Hertz, A. Krogh, and R. G. Palmer, Introa‘uction to the Theory of Neuml Computation. Redwood City, California: Addison-Wesley, 1991. [12] Z. Guo and R. E. Uhrig, “Use of artificial neural networks to analyze nuclear power plant performance,” Nucl. Tech., vol. 99, p. 36, July 1992. [13] Y.-H. Pao, Adaptine Pattern Recognirion and Neural Networks. Reading, MA: Addison-Wesley, 1989. [14] D. C. Montgomery, Design and Anafysis of Experiments. New York: Wiley, 1984.