ROBERT G. LUKE and (by invitation) ROBERT G. WONES, JOHN H. GALLA,. GREGORY ... in various tracks, exclusive of fellows. ... dents and fellows was not included. ..... cation of teaching units was remarkably well correlated(r = 0.88, p =.
TRANSACTIONS OF THE AMERICAN CLINICAL AND CLIMATOLOGICAL ASSOCIATION, VOL. 110, 1999
DEVELOPMENT AND IMPLEMENTATION OF A TEACHING PRACTICE PLAN IN A DEPARTMENT OF MEDICINE (1995-1998): RELATIVE TEACHING UNITS (RTU'S) ROBERT G. LUKE and (by invitation) ROBERT G. WONES, JOHN H. GALLA, GREGORY W. ROUAN, JOEL TSEVAT, JOHN W. DORFMEISTER CINCINNATI, OHIO
INTRODUCTION Reimbursement for clinical activities in academic departments has long supported teaching and research (1,2). Because of diminishing reimbursement for clinical services and the demands of managed care for increased accountability for time and effort in delivering these services, such cross-subsidization can no longer occur (3,4). "Mission budgeting" is now a necessity (5). Documented billings, collections and relative value units (RVL's) easily establish clinical productivity; publications, grants submitted and funded and extramural funds including clinical trial collections measure research success; but assessing productivity in teaching is much more difficult. Departments of Medicine traditionally have "expected" the teaching of medical students and housestaff to be performed by full-time faculty. Even in statesupported schools the link between "hard money" support for full-time salaries and specific teaching responsibilities has been at best implied and at worst non-existent. The purpose of this presentation is to give an account of one Department of Medicine's attempt to meet this challenge. We describe the formulation and implementation of, and experience with, a teaching recognition and reimbursement ("practice") plan over a four-year period. The plan should be applicable to other academic departments. BACKGROUND The Department has about 130 full-time faculty with 100 residents in various tracks, exclusive of fellows. Our clinical inpatient services are in a 500 bed University hospital and a closely situated 250 bed VA hospital. There are nine divisions. The University of Cincinnati has about 160 medical students in each year and they spend eight weeks in From the Department of Internal Medicine, University of Cincinnati 45267-0557. Correspondence and requests for reprints to Robert G. Luke, M.D., Department of Internal Medicine, Box 670557, Cincinnati, Ohio, 45267-0557.
214
A TEACHING PRACTICE PLAN
215
the junior year (four weeks ambulatory and four weeks inpatient) and eight weeks in the senior year (acting internships, as well as various electives) in Internal Medicine. The shift of half of the third year clinical clerkship into the ambulatory arena five years ago demanded more faculty time (6) and contributed to the need for this plan. Our inpatient services are arranged in eight ward teams, four subspecialty ward teams and three intensive-care teams. Just before the initiation of the plan, state and university policies led the Dean to indicate that state general funds were provided for teaching of medical students and that Part A funds from University Hospital were for teaching residents. The Department of Medicine is organized on a decentralized fiscal model with allocation to each Division of net clinical collections, grant support and general funds for education and administration. The Divisions carry responsibility for faculty salaries and professional support. Sources of the educational funds distributed by the Department to the Divisions are University general funds, Medicare Part A funds from University Hospital, some continuing clinical practice plan contributions and endowments for education. These funds totaled $2.5M in '95-96 and this increased to $3.2M by '98-99. Because most of the housestaff and student teaching is integrated and done simultaneously by the same individuals, we have co-mingled these funds for distribution by our plan.
METHODS A faculty task force (made up of both clinician-educators and tenured-research faculty) led by a division director (JHG) defined: (1) departmental teaching activities and (2) minimum teaching requirements for the various faculty tracks. This group determined the minimum time commitment expected in each type of activity based upon their experience and data provided by the program director (GWR). Teaching activities were included when either medical students and/or housestaff were present (Table 1). Teaching of graduate students and fellows was not included. The task force carefully quantified faculty teaching effort expended by rotation. For activities without direct patient contact, all faculty time expended was credited to teaching. For ward attending, consult attending, or outpatient precepting, 50% of the total time devoted was credited to teaching and the other 50% to patient care. Each teaching activity was assigned a unit value reflecting in part the total hours expended and intensity of effort by the faculty. Recognition for preparation time required for lectures was
216
ROBERT G. LUKE ET AL TABLE 1 Teaching Units by Major Teaching Activity in 1996-1997 Duration
Activity
University Hospital Team* VAMC Teamt Morning Report Divisional consultation:: Inpatient Consults-240 patients/yr 1 month 240-599 patients/yr 600 patients/yr Outpatient Visits-800 patients/yr 1 month 800-1499 patients/yr 1500 patients/yr Physical Diagnosis 1 Year Precepting Sessions-12/4 students/yr Exam Sessions-68/yr Per Lecture/Hour Basic Science Lectures CPC Grand Rounds Resident Lectures Professors' Rounds Office Precepting (1/2 day/week) 1 Month Unspecified General Teaching§ 1 month 1 month 1 month
Teaching Units Total UnYts 100 70 20
9600 5180 480
25 50 75 25 50 75
900 3000 4500 900 1800 8100
5
1360
10 10 10 5 5 5 200 Total Units¶
1105 110 370 145 720 5520 1600 45,390
* University Hospital Team includes general medical ward teams, subspecialty teams and critical care teams. t Veterans Administration Medical Center Team includes subspecialty teams and critical care teams. t Total teaching units for consultation services for each division were determined by patients seen per year on the inpatient service and in the ambulatory setting. § Department general allocation to each subspecialty division is in recognition of miscellaneous teaching activities not accounted for by the Teaching Recognition and Reimbursement Plan. ¶ Not all teaching units are utilized in calculating the dollars per point, as not all faculty are considered as "reimbursable" (e.g., Department general faculty have their total salaries recognized outside of the TRRP).
included in the assessment of didactic classroom-type activities and for exit evaluations of clinical experiences. Each teaching activity was assigned a unit value based in part upon total hours spent teaching and intensity of faculty effort, as determined by the task force. For example, attending on the University Hospital inpatient general medicine ward service requires approximately 2-4 hours per day of teaching activities (4-8 hours total). This amounts to approximately 25 teaching hours per week or 100 teaching hours per month. Thus, total teaching units for this activity were estimated by the task force to be 100.
A TEACHING PRACTICE PLAN
217
The teaching units assigned to each teaching activity were multiplied by the number of times that activity was scheduled during any given year. For example, University Hospital ward services were credited with 100 units per rotation. There are four General Medicine and four subspecialty ward or intensive care unit teams assigned to the University Hospital each month, or 96 attendings assigned to the University Hospital services per year. Multiplying 96 teams by 100 teaching credits per rotation equals 9,600 total teaching units assigned to this activity. A total of 45,390 teaching units was calculated for all of the departmental teaching responsibilities in academic year 19961997. A similar total was calculated for 1997-1998 with appropriate modifications for changes in clinical teaching services.
Sensitivity Analysis of Credit Given to Joint Teaching Patient Care Activities When Medicare reimbursement is utilized in recognition of patient care involving housestaff, both teaching and the provision of direct patient care are expected to occur (7,8). We attempted to disaggregate teaching from service. The task force chose to assign 50% of the total time devoted by faculty during each clinical activity to "teaching". We fully realize, however, that other institutions may have differing situations and opinions in this regard. We utilized a sensitivity analysis and varied the proportion of hours credited to teaching for those activities involving patient care from 25% to 75%. As a result, we hope that our model may be more exportable to other institutions with varying faculty involvement in patient care delivery, e.g., hospitals employing attendings primarily to teach and/or primarily to take care of patients.
Implementation of Departmental Plan (1996-1997, 1997-1998 and 1998-1999) In the '95-96 year immediately prior to implementation of the plan Department-wide, we implemented the plan in the General Medicine Division. This was necessitated by changes in the sources of support for our academic Primary Care physicians, firstly within our Academic Health Center, then within an integrated delivery system formed by the union for our hospitals including University Hospital. These changes necessitated a separate and full accounting of the salary component attributable to teaching. At this time also, because of the importance of the contribution of General Medicine to the teaching of medical students and residents and to the overall teaching efforts of the College, the Dean provided additional teaching funds for that
218
ROBERT G. LUKE ET AL
Division. Total teaching support to this Division was divided by total teaching units expended to teaching by its faculty to determine the baseline unit value in dollars per relative teaching unit (RTU). Reimbursement for teaching unit time was approximately equivalent to the salary received for practice activities. During this preliminary year we also implemented a "dry run" for assigning divisional dollars via the teaching plan but did not actually implement the financial changes until 1996-97. For various historical reasons, but also to allow the subspecialty divisions time to adjust to these changes, the "dry run" application of the plan to the subspecialty divisions utilized only 50% of the historical Departmental allocations to the Divisions. However, we applied all subsequent increases in available teaching dollars to the educational teaching plan allocations so that the percentage of historical total divisional allotments obtained via the teaching plan gradually increased. Thus in '98-99, 64% of the Departmental allocation to the Divisions was determined by the teaching plan. All subsequent data relate to the eight subspecialty divisions with exclusion of the application of the plan to General Internal Medicine. Total physician faculty in the Department during 1996-1997 was comprised of 100 individuals in the clinical tracks (including tenure track A) and 24 on tenure track B. As determined by the faculty task force, teaching effort available from research tenure track faculty was 50% of those in clinical tracks. Thus, 112 full-time teaching equivalents were available in 1996-1997 with each theoretically "earning" approximately 405 teaching units (total RTU's-45,390 112-full-time teaching equivalents) in recognition of their teaching effort. For example, a clinical faculty member could do three attending months, 6-12 sessions of physical diagnosis and a variety of resident or student lectures. A tenure research track faculty member, on the average, could be responsible for one attending month and six sessions of physical diagnosis, along with lecture responsibilities. We assigned RTU's to faculty members based upon general departmental responsibilities (e.g., ward rotation, physical diagnosis, etc.). Divisional assignments were also entered into the plan by faculty if we were provided with a schedule that defined duties of individuals (e.g., names of faculty supervising residents/students in the outpatient subspecialty clinic and their assigned days). Once divisional teaching funds are assigned for the year, the total required teaching units within any given division could be justified by reassigning responsibilities among the divisional faculty. Each division, however, had to accept responsibility for replacing any absences due to illness or other
219
A TEACHING PRACTICE PLAN
reasons. All RTU's were assigned prospectively except those (e.g., in the basic science core courses) in which advance schedules were not available; these RTU's were obtained for the preceding year. Each subspecialty division also received "general teaching activity units" (200 per division) in recognition of miscellaneous teaching responsibilities not otherwise accounted for by the plan. The number of faculty, their particular track and the teaching responsibilities assigned to those individuals determined the total teaching units per division. Prior evaluations of housestaff and students influenced which faculty member was assigned to a given teaching activity. As can be seen in Table 2, there was a marked increase in total RVU's in the subspecialty divisions in the current year (1998-99). This resulted from a modification of the plan devised and agreed upon by the faculty task force to take into account number of trainees (medical students and residents) on subspecialty rotations including ambulatory experiences. The rule had been that at least one trainee had to be present for any teaching activity to accrue RTU's. This rule was changed to allow for an increased attractiveness of, and intensity of teaching in, a subspecialty teaching program. Points were doubled if three or more trainees and two faculty participated in at least two half-day sessions allocated. This explains the increase in total points in the current year and attempts to account for the relative attractiveness of the electives to the students and housestaff.
Statistical Analysis Differences in the proportional allocation of teaching dollars -to subspecialty divisions in 1995-1996 as compared with 1996-1997 and 1997-1998 was compared by a two-tailed Chi-square test for categorical variables, using a p < 0.05 level for significance. An overall Chi-square test was also performed across all subspecialty divisions. We used a Kendall Tau b correlation coefficient to assess the correlation between allocation of funds by subspecialty division in 1995-1996 versus 1996-1997 and 1996-1997 versus 1997-1998. A Kendall Tau b TABLE 2 Financial Evolution Teaching Practice Plan for Eight Subspecialty Divisions from '96-97 to '98-99 Divisional Allocations
1996-97 1997-98 1998-99
Total 2.80 2.87 3.2
TPP
%
1.55 1.65 2.03
55 58 64
Total RTU's
$/RTU
33,000 33,000 45,000
47 50 45
220
ROBERT G. LUKE ET AL
correlation coefficient was also used to discern whether a significant relationship existed between teaching units allocated to each division and the number of questions in each subspecialty on the American College of Physicians In-Training Exam (ITE) for 1994-1996, and the 1995-1997 American Board of Internal Medicine (ABIM) certification examinations. All analyses were performed using SAS (Priority Software) and Excel (Microsoft, Redmond, Washington) software. RESULTS With the implementation of the teaching plan, the Department of Internal Medicine was able to allocate and quantify teaching effort on a consistent and reproducible basis. Divisional responsibilities for teaching activities were to some extent proportional to the number of faculty and their individual clinical track designation. The plan impacted significantly (p < 0.001) upon the proportional allocation of teaching units credited to each division after its implementation (Table 3). When comparing academic years 1995-1996 with 1996-1997 and 1996-1997 with 1997-1998, the allocations amongst divisions were also significantly different (p < 0.001). We have included, for interest, the allocations for 1998-99 but these are not included in the statistical assessment. The largest increase for any TABLE 3 Comparison of Allocation of Teaching Monies (Dollars in 1,000s) by Subspecialty Division of the Teaching Reimbursement Plan* Calculation of Teaching Dollar Allocation Allocation of by Division Utilizing the Teaching Dollars Teaching Practice Plan* Prior to Implementation of 1998-1999 1997-1998 1996-1997 TRRP During (%) (%) (%) 1995-1996 (%) 512.340 (18.3) 437.750 (15.2) 531 (16.6) 389.500 (15.5) Cardiology 304.755 (10.9) 295.500 (10.3) 379 (11.8) 171.000 (6.8) Digestive Diseases 178.815 (6.4) 218.500 (7.6) 224 (7.0) 250.000 (9.9) Endocrinology 515.135 (18.4) 468.000 (16.3) 448 (14.0) 494.000 (19.7) Hematology-Oncology 295.855 (10.6) 337.750 (11.7) 470 (14.6) 313.000 (12.4) Immunology 303.705 (10.8) 383.625 (13.3) 389 (12.2) 335.750 (13.4) Infectious Diseases 353.460 (12.6) 403.000 (14.0) 476 (14.9) 361.000 (12.6) Nephrology 336.630 (12.0) 330.750 (11.5) 283 (8.9) 199.500 (7.9) Pulmonary 3,200,000 2,874.875 2,800.695 2,513.750 Total Divisional Allocation * Indicates a significant (p < 0.001) difference by Chi-square test between the proportional teaching dollar allotment for 1995-1996, 1996-1997 and 1997-1998 as a result of the implementation of the TRRP across divisions.
221
A TEACHING PRACTICE PLAN
division during the three years was $208,000 in Cardiology and the largest decrease $72,000 in Endocrinology. The changes would have been greater if the teaching plan had been applied to all of the dollars in the Departmental allocations to the Divisions. Nevertheless, there were still some considerable changes in the distribution of those dollars as can be seen in Table 3.
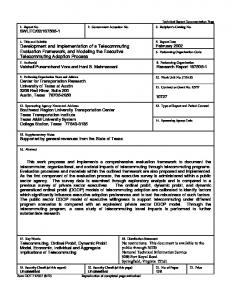
Sensitivity Analysis of Credit Given to Joint TeachingPatient Care Activities We examined the effect of changing the proportion of time credited to teaching from 25-75% for clinical services involving patient care and teaching during the initial year of the implementation of the plan (1996-1997). The baseline proportion for our department of medicine as determined by the task force for clinical activities (attending, consultation services or outpatient precepting) was 50% (Figure 1). If only 25% of total time spent in these three activities is credited to teaching (and the remaining 75% to patient care), then activities such as teaching, conferences, and physical diagnosis get much more teaching credit than under baseline assumptions (Figure 1). For example, teaching conferences would be allocated 11% of teaching dollars rather than 6%. 100%
90% 80%
U Unspec. Teach.
70% Percent 60% of Total 50%
Teaching Dollars 40% .
Phys. Dx. U Teach. Conf. Outpt. Teach. Consult.
_
_
30%-U
I
t. Teach.
20%
10% 0%
75% 50% % of Total Time Spent Teaching FIG. 1. Impact of Varying the Proportion of Time Credited to Teaching for Ward Attending, Consult Attending and Office Precepting on the Allocation of Teaching Funds (1996-1997) by Activity. Unspec. Teach. = Unspecified Teaching; Phys. Dx. = Physical Diagnosis; Teach. Conf. = Teaching Conference; Consult. = consultation; Inpt. Teach. Inpatient Teaching. 25%
222
ROBERT G. LUKE ET AL
Conversely, if 75% (Figure 1) of time spent on clinical services is credited to teaching, then only 4% of teaching dollars would go to teaching conferences. Changing the proportion of time credited to teaching from 25% to 75% for inpatient ward or unit rotations, inpatient and outpatient consultation rotations and outpatient precepting had little effect on the allocation of teaching monies across divisions. In no case would a division gain or lose more than 1% of the total funds available for teaching. Relationship of Teaching Activities by Division with Examination Content As an indirect indicator of the assignment of subspecialty and generalist faculty to teaching activities, we compared the percent distribution of teaching units across divisions (Table 4) with the percent distribution of questions by division as determined by the American College of Physicians (ACP) and the ABIM on the ACP In-Training Examination (ITE) and ABIM Certifying Exam respectively. The allocation of teaching units was remarkably well correlated (r = 0.88, p = 0.001 and r = 0.67, p - 0.012) with the specialty content of the ITE and ABIM examinations respectively, albeit this model is only a rough surrogate-of an "ideal" curriculum. The major discrepancy is the underTABLE 4 Comparison of Distribution of Exam Questions on the In-Training Exam (ITE) and American Board of Internal Medicine (ABIM) Examinations With Distribution of Teaching Units (1996-1998) Distribution of Distribution of Distribution Questions on Questions on of Teaching the ABIM the In-Training Division Unitst (%) Exam Exam* Cardiology Digestive Diseases Endocrinology Hematology/Oncology Infectious Diseases Immunology Nephrology Pulmonary General Internal Medicine
1994-1996 (%) 12 10 9 10 9.7 9 9.3 10 21
1995-1997 (%) 14 10.3 7 13 9 10 6 9.7 21
14.4 10.6 2.9 12.6 8 6.9 8.6 11 25
Only in 1995 did it become possible to look at a breakdown of "non-core" questions in this manner for the ABIM exam. t Correlation analysis demonstrated r = 0.88, p = 0.001 and r = 0.67, p = 0.012 for the ITE and ABIM examinations.
A TEACHING PRACTICE PLAN
222
representation of Endocrinology, which reflects incomplete recruitment of additional faculty in a division that currently remains understaffed. The process of development of the teaching plan in the spring of each year prior to commencement of the academic year in July is shown in Table 5. During this academic year (1998-1999) we intend to reward merit by distributing a 5% withhold from the total teaching dollars; this would approximate $100,000 for merit. Merit would be determined by analyzing data from the Likert score evaluation of the faculty by the medical students and housestaff which are provided at the end of every rotation. The analysis will be performed by standardized methodology and we will reward significantly high-performing clinician-educators.
DISCUSSION The implementation of the teaching recognition and reimbursement plan caused the reallocation of teaching dollars by faculty member and division to become more appropriately based upon recognition and quantification of actual participation in teaching activities. A significant difference in the distribution of teaching dollars occurred as a result of the compensation model. The plan provides flexibility for each faculty member to provide different teaching services with a standard of equivalence. All faculty must meet a minimum teaching effort unless the division head, associate chair for education and department chairman concur to waive the requirement. The plan also allows fair distribution of teaching workload between divisions and also allows division heads to meet responsibilities by distributing the teaching among faculty according to their relevant roles and skills. The Department Chairman must retain the flexibility to recognize and replace deficits to divisions that occur because of loss of faculty or insufficient time for recruiting of faculty by a new Division Head. It is very likely that clinical faculty in smaller TABLE 5 Application of the TPP * Circulation of scheduling templates to divisions * Draft schedule with RVU assignment * Review allocation of divisional teaching monies by Departmental Educational Office * Initial review of schedules and RVU distribution by divisions * Final verification of RVU assignment by Departmental Education Office * Final circulation of schedules to divisions/faculty * Distribution of teaching monies to divisions
224
ROBERT G. LUKE ET AL
divisions will be required to make greater efforts in teaching in order to meet balanced curricular training needs. It may be fortunate that these additional teaching requirements are usually incurred by divisions with few or no diagnostic procedural requirements and, usually, smaller practice collections. Quantitation of teaching responsibilities is of value not only for allocating dollars amongst divisions, but also for distribution of funds to individual faculty within divisions. At our annual review of each faculty member, we look at his or her net cost for salary and fringe benefits versus productivity in collections, grants and clinical trials, and now also in "earned" teaching funds. This more objective process is also useful in discussions with faculty who are considering retirement because it demonstrates whether or not a salary is being earned in full. An additional overall advantage of the plan has been an increased awareness of, and attention to, the importance of teaching within the Department, especially by division leaders. When collections from practice, grant and clinical trial "earnings" are clearly measured, but teaching "earnings" are not allocated fairly, there is a danger that the time and effort required for teaching is relegated to a lower priority. Our correlation analysis demonstrates that our teaching units are being allocated in proportion to the content of training and certification exams. Thus our overall teaching continues to be reasonably representative of each divisional discipline with the use of the plan. A key question is whether the implementation of the plan has led to better teaching in addition to raising the level of awareness amongst the faculty as to the importance of teaching. Our medical students grade all compulsory clerkships on a Likert scale on an annual basis. We have compared their assessment of our third-year clerkship over the past eight years. Our highest score was in '97-98, which was higher than all but two of the previous years by chi-square analysis. We also compared our clerkship with the other four major third-year clerkships for '97-98 (Table 6); unlike previous years the medical clerkship was rated significantly better than the others (p < 0.003). This improvement occurred concomitantly with the implementation of the teaching plan and is consistent with, but does not prove, the hypothesis that the plan favorably improved the perception of our teaching by our medical students. Based on our experience, we would recommend a preliminary "dry run" for one budget year with actual implementation only in the second year. The plan should be applied in an evolutionary rather than a revolutionary manner, perhaps by, as we did, applying the teaching plan at first only to a component of divisional or faculty allocations.
A TEACHING PRACTICE PLAN
225
TABLE 6 Results Medical Student Evaluations (Academic Year 1997-1998) Overall Quality Clerkship 4.2 + 0.8* Internal Medicine 3.8 + 1.0 Obstetrics/Gynecology 3.8 + 0.9 Pediatrics 3.9 ± 0.9 Psychiatry 3.9 + 0.9 Surgery 3.9 0.9 Overall Data based upon 85% of enrollees. * p < 0.003 by ANOVA.
Flexibility is essential to take into account recruiting commitments and changes in numbers of faculty in various divisions. The faculty must feel that they have played an important role in developing and modifying the plan and a representative committee is essential to monitor it. It is important that individual faculty actually see changes in remuneration as a result of teaching efforts and that the financial changes are not obscured at the level of the divisional budgets. This year we have found that written contracts between the Department and Divisions are of value so that there is no misunderstanding about the exact commitments made to teaching by each Division and its faculty.
CONCLUSIONS Most institutions utilize some form of clinical practice plan to distribute collections resulting from clinical care. Many agree that some standardized recognition of teaching responsibility is equally important (2). The format for our teaching plan is easily exportable to other institutions even if teaching responsibilities are somewhat differently addressed. Our plan, if widely adopted, might facilitate comparisons between institutions in terms of teaching costs-at least in a more objective fashion than at present. REFERENCES 1. Jones RF, Sanderson SC. Clinical revenues used to support the academic mission of medical schools, 1992-1993. Acad Med 1996;71:299-307. 2. Kassirer JP. Tribulations and rewards of academic medicine-where does teaching fit? N Engl J Med 1996;334:184-5. 3. Allcorn S, Winship DH. Restructuring medical schools to better manage their three missions in the face of financial scarcity. Acad Med 1996;71(8):846-57. 4. Shea S, Nickerson DG, Tenebaum J, et al. Compensation to a department of medicine and its faculty for the teaching of medical students and housestaff. N Engl J Med 1996;334:162-68.
226
ROBERT G. LUKE ET AL
5. Association of Academic Health Centers. Mission Management: A New Synthesis Executive Summary, 1998. 6. Sostok MA, Luke RG, Rouan GW. Confronting the costs of ambulatory-care training. Acad Med 1995;70:949. 7. Knickman JR, Lipkin M, Fickler SA, Thompson WG, Kiel J. The potential for using nonphysicians to compensate for the reduced availability of residents. Acad Med 1992;67:429-38. 8. Korn D, Jones RF. More on compensation for teaching (letter). N Engl J Med 1996;335: 1537.
DISCUSSION Wolf, Boston: Terrific study and a great idea. Do you have any data or even a sense to whether this has changed your faculty's willingness to participate in the teaching? Luke: Yes, I think it has undoubtedly done that. Of course, the opportunity costs of subspecialists vary a great deal, from an endocrinologist or a rheumatologist (which are low), to a cardiologist and some other disciplines (which are high) so that is an issue. It is quite fortunate that many of the disciplines that don't have invasive procedures are willing to pick up the slack in teaching. As I said, there is another side of this coin, though. That is what I call "the dollar for every task mentality": when the Dean or I ask someone to do something extra, the answer may be "well, you don't pay me for that." One has got to continually to deal with that. Klocke, Buffalo: How do you get good data? Practically every faculty person will overestimate by a factor of 1.5 to 2 to 2.5 what they do in teaching. Luke: The faculty team that looked at this knew that there was a chance for "cheating" but we did say that any faculty member gets, for example, 100 points for doing a university-ward month. If a faculty member gets bad ratings, which is not based on a single personality conflict, he or she is not asked to attend again. Thus, I think that the system does objectively name a number for what is done. Some people spend more time and some people spend less, but we look at the outcomes as measured by the resident and student opinions, which over years add up to being extremely consistent. Mackowiak, Baltimore: You pointed out that you make these distributions to the divisions rather than to the individual and I imagine this is a problem for you, both in terms of (if you will pardon the expression) diversity among the divisions in how they decide to make the second-level distribution and how to carry it out. Luke: They don't have total freedom in that regard. Mackowiak: I'd be interested in how you control that. Luke: Well, we run a decentralized department, which I believe in, whereby we give 70% of the collections, 60% of the grand overhead return, and the teaching money back to the divisions. When you delegate this money to the divisions, you have to give them some ability to move it around. That has been done very well in some divisions and less well in other divisions, but the teaching plan has also been very useful when you do an annual review of faculty. It used to be that we could see their collections and their grants, and then there was a big gap. Now we have an objective financial number for teaching. It becomes very clear who is not doing work in the department. Allen, Charleston: Robin, I don't have a question, but I do have a comment. My experience in academic medicine indicated that probably the only system which would be acceptable for distribution of funds within a department was going to be one that was so complex that very few people could understand it. I would like to compliment you on approaching that Elysium!