Disability and Rehabilitation, 2010; 32(20): 1633–1644
RESEARCH PAPER
Development and initial validation of the Children Participation Questionnaire (CPQ)
Disabil Rehabil Downloaded from informahealthcare.com by University of British Columbia on 08/22/12 For personal use only.
LIMOR ROSENBERG1, TAL JARUS2 & ORIT BART3 1
Department of Occupational Therapy, School of Health Professions, Sackler Faculty of medicine, Tel Aviv University, Department of Occupational Science and Occupational Therapy, CanDo research center, Faculty of Medicine, University of British Columbia, Vancouver, Canada, and 3Department of Occupational Therapy, School of Health Professions, Sackler Faculty of medicine, Tel Aviv University
2
Accepted January 2010
Abstract Purpose. To develop and test the psychometric properties of a parent-reported questionnaire measuring participation of preschool children (Children Participation Questionnaire; CPQ) aged 4–6 years in their everyday activities. Methods. Reliability was tested by Cronbach’s a and by test–retest. Construct validity was computed by known group differences analysis. Convergent and divergent validities were calculated by correlation with the Vineland Adaptive Behaviour Scale (VABS). Two hundred thirty-one children with mild to moderate developmental disabilities (mean age 5.16 + 0.66 years old) were compared to 249 children without disability (mean age 5.13 + 0.72 years old). Results. The CPQ has good internal reliability. Cronbach’s a for the participation measures ranged between 0.79 and 0.90, indicating good homogeneity. The temporal stability of the CPQ was supported with intra-class correlations ranging from 0.71 to 1.00. Significant differences were found between children with and without disabilities in all the CPQ measures. The CPQ could also differentiate between age groups and groups of varying socio-economic status. Convergent and divergent validity were supported. Conclusions. The CPQ has demonstrated good psychometric properties and can be used as a reliable and valid measure to assess children’s participation at the age of 4–6 years.
Keywords: Child participation, participation measurement, parent’s questionnaire
Introduction Participation is defined by the World Health Organization (WHO) [1] as involvement in life situations and as engagement in occupations of daily activities that are essential for development, life experience and well-being [2]. Throughout childhood, participation is the process and the product of development [3–6]. Participation is a multi-dimensional construct affected by many personal factors, such as gender, chronological or developmental age, performance skills, and environmental factors, such as accessibility, supportiveness or socio-economic status [7–9]. Enhancing children’s participation is an ultimate goal of rehabi-
litation in children with diverse health status and disabilities. Evaluating participation is essential for setting goals, implementation of treatment programmes, and evaluation of intervention efficacy [8,10]. Although the number of researchers investigating participation in various paediatric populations has increased [11–18], most focus on school age children older than 6 years, with severe developmental disabilities. A literature search [2,10,19,20] for the assessment tools designed to measure child participation reveals a paucity of tools appropriate to capture the full essence of the construct of participation. Most of these tools, for example the School Function Assessment (SFA) [21], Children’s
Correspondence: Limor Rosenberg, Department of Occupational Therapy, School of Health Professions, Sackler Faculty of medicine , Tel Aviv University, Ramat Aviv, Tel Aviv, 69978, Israel. E-mail:
[email protected] ISSN 0963-8288 print/ISSN 1464-5165 online ª 2010 Informa UK, Ltd. DOI: 10.3109/09638281003611086
Disabil Rehabil Downloaded from informahealthcare.com by University of British Columbia on 08/22/12 For personal use only.
1634
L. Rosenberg et al.
Assessment of Participation and Enjoyment (CAPE) [22] and the Assessment of Life Habits (LIFE-H) [23] are originally designed, as mentioned previously, for school-aged children with severe disabilities. Little is known about participation patterns of younger children with mild to moderate developmental disabilities, although these children make up the majority of referrals to developmental paediatrics clinics [24]. It is especially important to assess participation of young children as their function at this age may predict their scholastic and social adjustment in later years [25]. Several authors [8,10,20,26] discuss measurements of participation according to the International Classification of Functioning, disability and health (ICF) model, emphasising the importance of assessing the actual doing of activity rather than capability [27]. It is also suggested that participation measurement has to reflect the child’s engagement in all areas of occupation that are common to children in their home, educational setting and community [2,10,19,28]. In addition participation should be measured by objective dimensions, such as diversity (what one does), intensity (how often one does it), and independence (how much assistance one needs), alongside with subjective dimensions such as how much enjoyment and satisfaction one finds [2,8]. In constructing participation evaluation methods for young children, gathering information through their parents is recommended in the literature [23,28]. Parents’ reports are considered to be a sensitive, reliable and valid source of information [29,30]. Moreover, the use of parents’ reports may be inexpensive and feasible [31]. Therefore, the purpose of the present study is to develop and test the psychometric properties of a parent-reported questionnaire measuring participation of children (Children Participation Questionnaire; CPQ) aged 4–6 years. We hypothesise that the CPQ will be reliable and valid. In light of the ICF model and previous findings that demonstrated personal factors [7,9,32–35] and environmental factors [36–38] affecting child participation, we predicted that the CPQ participation measures will be able to differentiate between age groups, between children with and without developmental disabilities, and between children from diverse socio-economic statuses. We also hypothesise that construct validity will be supported by significant correlations between the CPQ and the Vineland Adaptive Behaviour Scale (VABS) [39], which is an established functional measure that is being used for validity studies [30,20]. Specifically, we hypothesise that the objective measures of the CPQ will correlate with the VABS to ascertain convergent validity, whereas divergent validity will be supported by lower correlations of the VABS to the CPQ subjective measures, as this aspect is not included in the VABS.
Construction of the questionnaire Children Participation Questionnaire description The CPQ is a parent-completed questionnaire for children aged 4–6 years. In order to avoid ambiguity about the operational definition of participation, we chose the Occupational Therapy Practice Framework (OTPF) definition [40] to guide the CPQ construction. The OTPF provides a classification system (or taxonomy) of areas of occupations and activities. Based on the OTPF, the CPQ contains 44 activities in six areas of occupations: activities of daily living (ADL; e.g. dressing), instrumental activities of daily living (IADL; e.g. setting the table), play (e.g. pretend play, computer games), leisure (e.g. bicycle riding, listening to a story), social participation (e.g. visiting a friend) and education (e.g. drawing and graphic-motor exercises in a preschool classroom). For each activity in which a child participates, parents report on intensity, child’s independence level, child enjoyment and their satisfaction. Thus, the questionnaire yields five participation measures: participation diversity (D) is the number of activities in which a child participates (maximum 44); participation Intensity (I) is the child’s mean participation frequency ranging from 0 (never) to 5 (everyday); independence (Ind) is the mean assistance level of the child ranging from 1 to 6, where 6 means fully independent; child enjoyment (E) is the mean level of the child’s enjoyment ranging from 1 to 6 and parent satisfaction (PS) is the mean Parent Satisfaction with the performance of their child, ranging from 1 to 6, where 6 indicates highest enjoyment or satisfaction. In addition, if needed, each total measure (diversity, intensity, child enjoyment, and parent satisfaction) can be split into six subtotal scores for each area of occupation (i.e. ADL, IADL, play, leisure, social participation, and education; see Appendix).
Children Participation Questionnaire content validity In the first stage of the CPQ construction, we phrased the questionnaire items based on all the areas of occupation as outlined in the OTPF and adjusted them to fit the activities and performances of young children. We defined the measurement indexes and selected the measurement scales. The first version of the questionnaire was reviewed by a group of six paediatric occupational therapists, and a group of three occupational therapy academic researchers to establish the questionnaire content validity [41]. Based on their feedback, 4 items were added and 3 were shifted from one category to
Disabil Rehabil Downloaded from informahealthcare.com by University of British Columbia on 08/22/12 For personal use only.
The Child Participation Questionnaire another. Measurement scales were enlarged from 1–4 to 1–6 in order to increase the variability of the scores and prevent ceiling effect. The revised version of the CPQ was introduced to three paediatric occupational therapy teams who pilot tested the questionnaire with 10 parents of treated children and 10 of non-treated children. All the parents affirmed that the 44 activities of the CPQ covered the full range of their children’s life. Parents’ questions, comments and feedback were discussed by team members and the researchers. Based on those discussions, a few items were rephrased (e.g. ‘free play’ was rephrased to ‘pretend play’), examples were added where necessary (e.g. to the activity of ‘use of arts and crafts materials’ we added a list of materials, such as glue, clay and finger paints), and the instruction guide was rewritten. Following those steps, a final version was designed (see Appendix).
Methods
1635
(115 children with disabilities, 107 children without disabilities) were from families with average income and 195 participants (91 children with disabilities, 104 children without disabilities) were from families with above average income.
Measurements Vineland Adaptive Behaviour Scale [39]. The VABS is a semi-structured interview addressed to parents or caregivers to assess children’s adaptive behaviour from birth to 18 years of age. Originally the VABS was developed for children with intellectual disabilities to assess child adaptive behaviour in four dimensions: ADL, communication, motor skills and socialisation. The VABS was chosen to establish criterion validity of the CPQ as it is the only instrument that assesses similar constructs to those of the CPQ, and is commonly used in validity studies of developing new tools [20,30]. The VABS has sound psychometric properties [44].
Participants We performed a power analysis using the data from a pilot study (N ¼ 100, 50 for each group of children with and without disability). The Diversity measure did not differ between the two groups, therefore we did not consider it in the calculation of sample size. Assuming a 5% level of significance, 80% power and a moderate effect size (Cohen’s d ¼ 0.5) [42,43], 247 participants were required per group based on the Participation Intensity measure (the other CPQ measures required much smaller sample sizes ranging from 31 to 35 per group). Five hundred twenty-eight parents were recruited through a convenience sampling method and completed the CPQ. Nine per cent of the questionnaires were incomplete and therefore only 480 children and their parents participated in the study. Two hundred thirty-one children (45 girls, 186 boys, mean age 5.16 + 0.66 years old) were recruited from seven paediatric occupational therapy clinics in central and northern Israel. To be included in this group, participants had to attend regular preschool and had to be referred to occupational therapy evaluation because of mild or moderate developmental difficulties, including clumsiness, gross motor difficulties, fine motor delays, visual motor difficulties, sensory sensitivity, attention deficit disorder or learning disabilities. The second group contained 249 children without developmental disabilities (45 girls, 204 boys, mean age 5.13 + 0.72 years old). There were no significant differences between the two groups in age, gender and family income. Sixty participants (23 children with disabilities, 37 children without disabilities) were from families with below average income, 222 participants
Procedure Ethical approval was provided by the Behavioural Research Ethics Board of Tel-Aviv University. Parents, who agreed to participate in the study, received information about the procedure and purpose of the study, signed a consent form and completed the CPQ independently at their own convenience. The questionnaires were collected a few days later. To assess test–retest reliability, a randomly selected sub-sample of 40 parents, 20 from each group (with and without disabilities), completed the questionnaire twice in a 2week interval. To assess convergent and divergent validity, another sub-sample of 108 parents of children without disabilities was also interviewed for the completion of the VABS [39].
Data analyses For establishing the CPQ homogeneity (internal consistency), we used Cronbach’s a coefficient and Spearman correlations to calculate inter-item correlations. For establishing temporal stability (test–retest reliability), we used k test and intra-class correlations (ICC). k 5 0.40 was considered poor to fair, and 0.41–0.60 indicated moderate agreement. k 4 0.61 is considered as a good level of agreement, and when it exceeds 0.80 the agreement is very good [45]. The ICC as the parametric equivalent test of the k can be interpreted the same. The construct validity of the CPQ was tested using two-way analysis of variance (ANOVA) tests to establish group differences
Disabil Rehabil Downloaded from informahealthcare.com by University of British Columbia on 08/22/12 For personal use only.
1636
L. Rosenberg et al.
between age groups and diagnostic groups. Two hundred six participants were assigned to the young preschoolers’ group (M ¼ 4.48, SD ¼ 0.32, range 4.00–5.00) and 274 were assigned to the older preschoolers’ group (M ¼ 5.65, SD ¼ 0.42, range 5.01–6.99). In addition, two-way ANOVA was computed with group (with and without disability) and family income (below average, average, above average) as ‘between-group’ factors and participation measures (Diversity, Intensity, Independence, child enjoyment, Parent Satisfaction) as a ‘within-subject’ factor. We used the Eta square (Zp2) results to assess effect size. Zp2 5 0.06 is considered to be poor, and above 0.14 is considered to be high [46]. Convergent and divergent validities were calculated using Spearman correlation between the CPQ measures and the VABS subscales. To support convergent validity, based on similar validity studies [47,48], we expected significant, small to moderate correlations (around 0.4) between the objective measures of the CPQ and the VABS subscales. To support divergent validity we expected no significant or lower correlations (around 0.2) between the subjective measures of the CPQ and the VABS subscales.
Results Reliability of the Children Participation Questionnaire Internal consistency reliability. Cronbach’s coefficient a was calculated to examine how well all items measured the same construct and contributed to the total assessment score, with 0.70 specified as an acceptable level [49]. The a coefficients for the CPQ total measures (Participation Intensity, Independence Level, child enjoyment, and Parent Satisfaction) and for each area of occupation (ADL, IADL etc.) are presented in Table I. We did not calculate an a coefficient for participation diversity as it is a categorical measure. Of note, the reliability of all the total measures is above acceptable level and much higher than the reliability of each area of occupation.
Test–retest Temporal stability of each of the 44 activities on all the CPQ total measures (i.e. participation diversity, Participation Intensity, Independence Level, child enjoyment, and Parent Satisfaction) was calculated using k. When k could not be analysed we calculated the agreement percentage. The temporal stability of the CPQ was supported with a k ranging from 0.28 to 1.00 (96% of the calculated items scored between moderate to very good), and an agreement percentage ranging from 41 to 100% for all 44 activities 6 4 measures. Test–retest for the mean scores of the 5 CPQ total measures (average scores across all 44 activities) were calculated using ICC. The ICC results ranged from 0.84 to 0.90, exhibiting very good agreement (see Table II).
Construct validity Homogeneity. Estimating correlations between subtests with the total score is a known procedure to analyse homogeneity. Homogeneity of subtests indicates a single construct [50]. Table III presents correlations between the six areas of occupation with the CPQ total measures. All associations were moderate to high, significantly correlated, except for two significant low correlations in the ADL area of occupation. Results support the homogeneity of the CPQ.
Group and age differences Two-way ANOVA was computed with group (with and without disability) and age (young pre-schoolers, old pre-schoolers) as ‘between-group’ factors for each of the participation measures (diversity, intensity, independence, child enjoyment, parent satisfaction) as ‘within-subject’ factors. Table IV presents means and standard deviations of CPQ participation measures by group and age. No significant interaction effect was found for group and age.
Table I. The Cronbach’s a coefficients for the CPQ total measures and sub-total measures for each area of occupation (N ¼ 480).
Area of occupation
Intensity
Independence
Child enjoyment
Parent satisfaction
CPQ total measures
0.79
0.89
0.88
0.90
CPQ sub-total measures ADL IADL Play Leisure Social participation Education
0.57 0.45 0.49 0.62 0.70 0.52
0.68 0.65 0.64 0.70 0.79 0.78
0.68 0.63 0.70 0.70 0.71 0.78
0.66 0.62 0.78 0.76 0.78 0.77
1637
The Child Participation Questionnaire Table II. ICC of the CPQ total measures, and for each area of occupation (N ¼ 40). Diversity
Intensity
Independence
Child enjoyment
Parent satisfaction
0.84 – 0.90 1.00 0.71 0.87 0.96
0.89 – 0.83 0.87 0.89 0.78 0.90
0.88 0.91 0.72 0.87 0.80 0.89 0.95
0.85 0.84 0.78 0.85 0.88 0.90 0.89
0.87 0.88 0.75 0.83 0.85 0.89 0.96
CPQ total measures ADL IADL Play Leisure Social Participation Education
ADL, Activity of Daily Living; IADL, Instrumental Activity of Daily Living.
Disabil Rehabil Downloaded from informahealthcare.com by University of British Columbia on 08/22/12 For personal use only.
Table III. Spearman Correlations between the areas of occupation with the CPQ total participation measure (N ¼ 480).
ADL IADL Play Leisure Social Participation Education
Diversity
Intensity total
Independence total
Child Enjoyment total
Parent Satisfaction total
.16** .67** .40** .51** .71** .68**
.18** .53** .57** .75** .63** .50**
.62** .64** .67** .82** .72** .70**
.68** .62** .62** .77** .63** .75**
.67** .65** .73** .82** .73** .74**
**p5.0001.
Table IV. Means and standard deviations of CPQ total participation measures (diversity, intensity, independence, child enjoyment, parent satisfaction) by group and age (N ¼ 480). Children with disabilities (mean + SD)
Participation diversity Participation intensity Independence level Child enjoyment Parent satisfaction
Children without disabilities (mean + SD)
Total (mean + SD)
Young (N ¼ 94)
Old (N ¼ 137)
Young (N ¼ 112)
Old (N ¼ 137)
Children with disabilities (N ¼ 231)
Children without disabilities (N ¼ 249)
37.70 + 2.82 3.85 + 0.25 4.86 + 0.59 5.28 + 0.42 5.12 + 0.55
38.67 + 2.90 3.87 + 0.30 5.01 + 0.56 5.27 + 0.46 5.12 + 0.61
38.86 + 2.46 3.95 + 0.32 5.07 + 0.47 5.49 + 0.39 5.43 + 0.47
39.15 + 2.81 3.97 + 0.28 5.36 + 0.39 5.56 + 0.32 5.57 + 0.37
38.28 + 2.90 3.86 + 0.28 4.95 + 0.57 5.27 + 0.44 5.12 + 0.58
39.02 + 2.66 3.96 + 0.30 5.23 + 0.45 5.53 + 0.36 5.57 + 0.37
A significant main effect for age was found for the total participation diversity measure [F(1, 479) ¼ 6.14, p 5 0.05, Zp2 ¼ 0.01]; and for the total independence level measure [F(1, 479) ¼ 21.72, p 5 0.01, Zp2 ¼ 0.04] although the clinical significance is low. In both groups, younger children participated in fewer tasks compared to their older peers (M ¼ 38.33 + 2.69, M ¼ 38.91 + 2.86, respectively) and were less independent (M ¼ 4.98 + 0.54, M ¼ 5.18 + 0.51, respectively) while performing the activities included in the CPQ. In the other three total CPQ participation measures (Intensity, child enjoyment, and Parent Satisfaction), no main effects were found. A significant main effect for group was found in all CPQ total measures. It was found that children with disabilities participated in fewer activities (F(1, 479) ¼ 10.27, p 5 0.001, Zp2 ¼ 0.02) in lower frequencies (F(1, 479) ¼ 13.00, p 5 0.001, Zp2 ¼
0.03), and were less independent (F(1, 479) ¼ 37.86, p 5 0.001, Zp2 ¼ 0.07). Their enjoyment was decreased (F(1, 479) ¼ 44.97, p 5 0.001, Zp2 ¼ 0.09), and their parents were less satisfied with their children’s participation (F(1, 479) ¼ 64.59, p 5 0.001, Zp2 ¼ 0.12) (see Table IV for means and SD).
Group and income differences Two-way ANOVA was computed with group (with and without disability) and family income (below average, average, above average) as ‘between-group’ factors for each of the participation measures separately (diversity, intensity, independence, enjoyment, parent satisfaction). Table V presents means and standard deviations of the CPQ total participation measures by group and family income.
Disabil Rehabil Downloaded from informahealthcare.com by University of British Columbia on 08/22/12 For personal use only.
1638
L. Rosenberg et al.
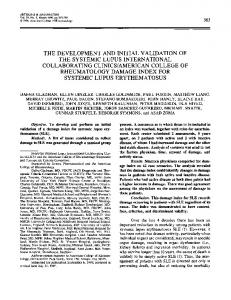
A significant interaction effect was found for group and family income in the participation diversity measure (F(2, 476) ¼ 4.24, p 5 0.05, Zp2 ¼ 0.02). Children with disabilities with a family income below average participated in fewer activities as compared to the other two groups (see Figure 1). A significant main effect for family income was found for the participation intensity measure (F(2, 476) ¼ 10.31, p 5 0.001, Zp2 ¼ 0.04). Participation Intensity of children from families with below average income was higher than that of children from families with average and above average income. A significant main effect for Income was also found for the Independence measure (F(2, 476) ¼ 4.59, p 5 0.05, Zp2 ¼ 0.02) and for the child enjoyment measure (F(2, 476) ¼ 6.08, p 5 0.05, Zp2 ¼ 0.03). Children from families with above average income were less independent and enjoyed less everyday activities compared to their peers from families with average and below average income. No significant differences were found between the three income levels in parent satisfaction.
Convergent and divergent validities Convergent and divergent validities were computed using Spearman correlations between the CPQ total
measures (diversity, intensity, independence, child enjoyment, and parent satisfaction) and the VABS subscales (ADL, Communication, Socialisation, and Motor skills; see Table VI). Convergent validity was partially supported by the significant, low to moderate correlations between the objective CPQ total participation measures (i.e. participation diversity, participation intensity, and independence level) and all the VABS subscales (except VABS Communication with Participation Intensity). In particular, substantial correlations were found with the ADL subscale of the VABS. No significant correlations or low correlations were found between the subjective CPQ total participation measures (i.e. child enjoyment and Parent Satisfaction) and the VABS Communication, Socialisation, and Motor subscales (except VABS ADL with child enjoyment), thus partially supporting the divergent validity of the CPQ.
Discussion This study offers a new tool, the CPQ, for measuring preschool child participation. The CPQ is grounded in a family-centred approach, and assesses child participation according to the parent’s perspective. To capture all dimensions of the multi-dimensional
Table V. Means and standard deviations of CPQ participation measures (diversity, intensity, independence, enjoyment, parent satisfaction) by group and family income (N ¼ 477). Children with disabilities (mean + SD)
Participation diversity Participation intensity Independence level Child enjoyment Parent satisfaction
Children without disabilities (mean + SD)
Below average (N ¼ 23)
Average (N ¼ 115)
Above average (N ¼ 91)
Below average (N ¼ 37)
Average (N ¼ 107)
Above average (N ¼ 104)
35.26 + 4.30 4.01 + 0.36 5.15 + 0.54 5.47 + 0.38 5.25 + 0.67
38.16 + 2.72 3.86 + 0.30 4.97 + 0.61 5.30 + 0.48 5.13 + 0.62
39.21 + 2.06 3.82 + 0.22 4.85 + 0.53 5.19 + 0.39 5.06 + 0.51
37.38 + 3.95 4.11 + 0.36 5.23 + 0.41 5.56 + 0.35 5.54 + 0.43
39.33 + 2.12 3.96 + 0.31 5.30 + 0.42 5.57 + 0.32 5.54 + 0.38
39.27 + 2.41 3.90 + 0.26 5.16 + 0.48 5.47 + 0.39 5.45 + 0.46
Figure 1. Children’s participation diversity by family income level.
The Child Participation Questionnaire
1639
Table VI. Spearman correlations between the CPQ measures (Diversity, Intensity, Independence, Child Enjoyment, Parent Satisfaction) and the VABS subscales (ADL, Communication, Socialisation, and Motor skills) of children without developmental disabilities (N ¼ 108).
Participation Diversity Participation Intensity Independence Level Child Enjoyment Parent Satisfaction
VABS Communication
VABS ADL
VABS Socialisation
VABS Motor
.42** .18 .29** .16 .10
.40** .47** .55** .41** .33**
.36** .36** .36** .21* .20*
.38** .41** .46** .24* .22*
Disabil Rehabil Downloaded from informahealthcare.com by University of British Columbia on 08/22/12 For personal use only.
*p5.05; **p5.001.
and complex concept of participation, we used five participation measures: participation diversity (the number of activities a child takes part in), participation intensity (how often participation occurs), independence level (how much assistance is required), child enjoyment and parent satisfaction. Our findings suggest adequate initial psychometric support for the CPQ as a promising new measure for assessing pre-schooler’s participation in everyday activities. The internal consistency of the CPQ total measures is found to be good based on Cronbach’s a coefficient values which range from 0.79 to 0.90 in all four participation measures. These results substantiate the evidence that for each total measure (intensity, independence, child enjoyment, and parent satisfaction) all items measure the same underlying construct and each are internally consistent. However, the internal consistency of each area of occupation (i.e. subtotal scores) is lower. These differences may be due to the different length of the various scales. The temporal reliability of the CPQ is adequately supported, although the test-retest sample size is small. Similarly to the a results, the reliability coefficients of the CPQ total measures are higher than that of the individual items. Therefore, we suggest using the CPQ total participation measures, which have higher reliability, as the CPQ scores. Those scores reflect the essence of participation as a complex construct. However, it may be possible to cautiously use the subtest scores for more detailed information if needed, especially for clinical practice. In order to examine the construct validity of the CPQ, we used a group comparison method to determine whether the CPQ can distinguish between groups that are believed to score differently based on theory. Our findings indicate that the CPQ has satisfactory construct validity and the questionnaire is sensitive enough to significantly differentiate between participation patterns of children with and without mild or moderate disabilities. In addition, the CPQ can significantly differentiate between age groups, and between children in families of different socio-economic statuses. Specifically, two CPQ participation measures can significantly discriminate between the two assessed
age groups despite the narrow target age range of the questionnaire (4–6.11 years old). The two distinguishing measures are participation diversity and independence level. Older children are usually more independent and engaged in more diverse activities than younger children, as would typically occur in normal development. The participation intensity measure does not discriminate between age groups, as the timetable of children in these two age groups are stable and mainly structured by their parents [26, 33]. No differences are found between age groups in child enjoyment and parent satisfaction measures as these measures are not thought to change across preschool years. As a whole, subjective measures of participation that reflect well-being do not appear to be strongly related to demographic variables such as age or gender, at least not before adolescence [51,52]. All the five CPQ total participation measures significantly discriminate between children with and without mild or moderate developmental disabilities. These results are in accordance with the literature describing decreased participation of children with developmental disabilities in comparison to children without developmental disabilities [7,16], and thus support the CPQ construct validity. Although all CPQ total participation measures can discriminate between groups, their magnitude differs. Based on the effect size, independence level, child enjoyment, and parent satisfaction are the best discriminant measures. Thus the unique format of the CPQ can deepen our understanding about the implications of even mild or moderate developmental disabilities on well-being of children and their parents. As it is documented that family income is one of the fundamental contextual factors affecting child development and participation [9,37], we compared the participation of children from three family income groups (below average, average, and above average). All the CPQ total participation measures discriminate between family income groups except for the parent satisfaction measure. Children from families with below average family income participate in fewer activities. However, they were more independent than children from the other two income groups. For the diversity measure, an interaction effect is found
Disabil Rehabil Downloaded from informahealthcare.com by University of British Columbia on 08/22/12 For personal use only.
1640
L. Rosenberg et al.
between income and group. This indicates that the diversity participation measure of children who are referred to occupational therapy services, and who are from above average families, do not differ from children without disabilities from the same socioeconomic status. Differently, children with disability from below average income families exhibit the lowest participation diversity scores. Taking together these results, we may assume that high family income may serve as a protective factor for participation diversity of children with mild and moderate developmental disabilities. These findings enrich our understanding of how participation is affected by contexts. While comparing the groups of children with and without disabilities, the differences between the groups in the child independence and parent satisfaction measures are the highest, based on the Zp2 analysis. However, while comparing family income groups, the most significant measure is participation diversity. Family income, as an environmental factor, contributes differently to the variation in children’s participation. These findings illuminate the unique contribution of each one of the five CPQ total participation measures to the multidimensional construct of participation, and thus enhance the CPQ construct validity. Although the effect of group, age and income are significant, their effect sizes are small to moderate. We assume that these results are due to the sample characteristics. Our study consists of children with mild or moderate developmental disabilities (children with severe developmental disabilities were excluded). We used a narrow age range, and all the children have similar backgrounds. On the other hand, the relatively small effect size between group, age and income may reflect some traits of participation that should be further studied. Convergent and divergent validities of the CPQ are partially demonstrated by comparison with the VABS. Although the correlations between the two questionnaires were only calculated for children without disabilities, meaningful results were obtained. Higher levels of convergent validity (expressed by higher correlations) are found between the three objective CPQ total measures, diversity, intensity, and independence, and VABS subscales which address similar theoretical constructs. Not surprisingly, the highest correlations are found between the ADL subscale of the VABS and all the CPQ total measures, which reflect the similarity in content addressed by these measures (i.e. dressing oneself, helping setting the table). Yet, lower correlations are found between the CPQ total measures and the VABS-communication subscale which reflects the dissimilarities in the content addressed by these subscales. Divergent validity is partially supported by the absence of significant correlations or low correlations
between the subjective CPQ total measures, child enjoyment and parent satisfaction, and all the VABS subscales (except VABS–ADL where stronger correlations were found). This indicates that the child enjoyment and parent satisfaction, which were not part of existing and conventional functional assessment tools, are new measures unique to the CPQ. These measures are subjective measures that reflect well-being and life satisfaction, which are considered to be essential inherent aspects of participation and health outcomes according to the ICF model. Our findings accentuate the importance of these measures to the study of child participation and the unique contribution of the CPQ to this evolving body of knowledge.
Limitations and conclusions The gender imbalance in our sample (more boys than girls) is in accordance to the higher prevalence of boys in many developmental disabilities groups. Previous literature discusses gender differences in activities and occupations throughout childhood [20, 46]; however in our study we could not find gender differences in the CPQ total measures. Further study is needed to clarify gender differences in participation patterns of children at younger ages. The reliability of the CPQ temporal stability should be further assessed as we used relatively small sample size in the current test–retest study. In addition, we studied children with mild or moderate developmental disabilities from relatively similar demographic backgrounds which may limit the generalisability of the findings. The convergent and divergent validity of the CPQ should be further assessed with diverse populations. In conclusion, the CPQ has demonstrated acceptable psychometric properties. Therefore, the CPQ can be used as a reliable and valid measure to assess children’s participation at the age of 4–6 years. The findings support that the CPQ can assess participation in everyday activities through multidimensional measures. Thus the CPQ enables us to derive important information about participation. Further studies should focus on the suitability of the questionnaire to other populations, its feasibility for intervention planning and its responsiveness to treatment.
Acknowledgements This work was performed in partial fulfillment of the requirements for Ph.D. degree of Limor Rosenberg, Sackler Faculty of medicine, Tel Aviv University, Israel. We are grateful to the parents and children who participated in this study.
The Child Participation Questionnaire
Disabil Rehabil Downloaded from informahealthcare.com by University of British Columbia on 08/22/12 For personal use only.
References 1. World Health Organization. International classification of functioning, disability and health (ICF). Geneva, Switzerland: World Health Organization; 2001. 2. Law M. Participation in the occupations of everyday life. Am J Occup Ther 2002;56:640–649. 3. Edwards D, Christiansen C. Occupational development. In: Christiansen C, Baum C, Bass-Haugen, editors. Occupational therapy: performance, participation, and well being. 3rd ed. Thorofare, NJ: Slack; 2005. pp 43–63. 4. Primeau L, Ferguson J. Occupational frame of reference. In: Kramer P, editor. Frames of reference for pediatric occupational therapy. Philadelphia, PA: Lippincott Williams & Wilkins; 1999. pp 469–516. 5. Case-Smith J, Denegan Shortridge S. The developmental process. In: Case-Smith J, editor. Occupational therapy for children. 3rd ed. St. Louis, MO: Mosby; 1996. pp 46–66. 6. Davis J, Polotajko H. Occupational development. In: Christiansen C, Townsend E, editors. Introduction to occupation: the art and science of living. Upper Saddle River, NJ: Pearson Education, Inc; 2004. pp 91–119. 7. Chen H, Cohn E. Social participation for children with DCD: conceptual, evaluation and intervention considerations. Phys Occup Ther Pediatr 2003;23:61–78. 8. Forsyth R, Jarvis S. Participation in childhood. Child Care Health Dev 2002;28:277–279. 9. King G, Law M, King S, Rosenbaum P, Kertoy M, and Young N. A conceptual model of the factors affecting the recreation and leisure participation of children with disabilities. Phys Occup Ther Pediatr 2003;23:63–90. 10. Lollar D, Simeonsson R. Diagnosis to function: classification for children and youth. JDBP 2005;26:323–330. 11. Engel-Yeger B, Jarus T, Cultural and gender effects on children’s activities preference in Israel. Can J Occup Ther 2008;75:39–48. 12. Engel-Yeger B, Jarus T, Anabi D, et al. Difference between youth with cerebral palsy and typical youth in community participation. Am J Occup Ther 2009;63:96–104. 13. Mancini MC, Coster WJ, Trombly, et al. Predicting elementary school participation in children with disabilities. Arch Phys Med Rehabil 2000;81:339–347. 14. Mancini MC, Coster WJ. Functional predictors of school participation by children with disabilities. Occup Ther Int 2004;11:12–25. 15. Mandich A, Polatajko H, Rodger S. Rites of passage: understanding participation of children with DCD. Hum Mov Sci 2003;22:583–595. 16. Poulsen A, Ziviani J. Can I play too? Physical activity engagement of children with developmental coordination disorders. Can J Occup Ther 2004;71:100–107. 17. Schenker R, Coster W, Parush S. Participation and activity performance of students with cerebral palsy within the school environment. Disabil Rehabil 2005;27:539–552. 18. Schenker R, Coster W, Parush S. Neuroimpairments, activity performance, and participation in children with cerebral palsy mainstreamed in elementary schools. Dev Med Child Neurol 2005;47:808–814. 19. McConachie H, Colver A, Forsyth R, et al. Participation of disabled children: how should it be characterized and measured? Disabil Rehabil 2006;28:1157–1164. 20. Ognowski J, Kronk R, Rice C, et al. Inter-rater reliability in assigning ICF codes to children with disabilities. Disabil Rehabil 2004;26:353–361. 21. Coster W, Deeney T, Haltiwanger J, Haley S. School function assessment, user’s manual. San Antonio, TX: Therapy Skill Builders; 1998.
1641
22. King G, Law M, King S, et al. Children’s assessment of participation and enjoyment. Hamilton. ON: McMaster University, CanChild Center for Childhood Disability Research; 2002. 23. Noreau L, Lepage C, Boissiere L, et al. Measuring participation in children with disabilities using the assessment of life habits. Dev Med Child Neurol 2007;49:666–671. 24. Shevell M, Majnemer A, Rosenbaum P, Habrahamowicz M. Etiologic yield of subspecialists’ evaluation of young children with global developmental delay. J Pediatr 2000; 136:593– 598. 25. Bart O, Hajami D, Bar-Haim Y. Predicting school adjustment from motor abilities in kindergarten. Infant Child Dev 2007;16:597–615. 26. Simeonsson R, Leonardi M, Lollars D, et al. Applying the International Classification of Functioning, Disability and Health (ICF) to measure childhood disability. Disabil Rehabil 2003;25:602–610. 27. Bart O, Rosenberg L, Ratzon NZ, Jarus T. Development and initial validation of the Performance Skills Questionnaire. Res Dev Disabil 2009;31:46–56. 28. Coster W, Alunkal Khetani M. Measuring participation of children with disabilities: issues and challenges. Disabil Rehabil 2008:30:639–648. 29. Glascoe F, Dworkin P. The role of parents in the detection of developmental and behavioral problems. Pediatrics 1995;95: 829–836. 30. Saigal S, Rosenbaum P, Stoskopf B, Hoult L, Furlong W, Feeny D, Hagan R. Development, reliability and validity of a new measure of overall health for pre-school children. Qual Life Res 2005;14:243–257. 31. Morris C, Kurinczuk J, Fitzpatric R. Child or family assessed measure of activity performance and participation for children with cerebral palsy: a structured review. Child Care Health Dev 2005;31:397–407. 32. Brown M, Gordon W. Impact of impairment on activity patterns of children. Arch Phys Med Rehabil 1987;68:828–832. 33. Law M, Kertoy M, Hurley P, et al. Patterns of participation in recreational and leisure activities among children with complex physical disabilities. Dev Med Child Neurol 2006; 48:337–342. 34. Smyth MM, Anderson HI. Coping with clumsiness in the school playground: social and physical play in children with coordination impairment. Br J Dev Psychol 2000;18:389-413. 35. Henry AD. Development of a measure of adolescent leisure interests. Am J Occup Ther 1998;52:531–539. 36. Linver M, Brook Gunn J, Kohen D. Family processes as pathways from income to young children development. Dev Psychol 2002;38:719–734. 37. Hofferth S, Sandberg J. How American children spend their time. J Marriage Fam 2001;63:295–308. 38. Bianchi S, Robinson J. What did you do today? Children’s use of time, family composition, and the acquisition of social capital. J Marriage Fam 1997;59:332–344. 39. Sparrow S, Balla D, Cicchetti D. Vineland Adaptive Behavior Scales. Circle Pines: American Guidance Service; 1984. 40. American Occupational Therapy Association (AOTA). Occupational therapy practice framework: domain and process. Am J Occup Ther 2002;56:609–639. 41. Benson J, Clark F. A guide for instrumental development and validation. Am J Occup Ther 1982;36:789–800. 42. Cohen J. Statistical power analysis for the behavioral sciences. 2nd ed. Hillsdale, NJ: Erlbaum; 1988. 43. Howell DC. Fundamental statistics for the behavioural sciences. 3rd ed. California: Duxbury Press; 1995. 44. Balboni G, Pedrabissi L, Molteni M, et al. Discriminant validity of the Vineland scales: scores profile of individuals with mental retardation and a specific disorder. Am J Ment Retard 2001;106:162–172.
Disabil Rehabil Downloaded from informahealthcare.com by University of British Columbia on 08/22/12 For personal use only.
1642
L. Rosenberg et al.
45. Altman DG. Practical statistics for medical research. London: Chapman & Hall/crc; 1999. 46. Stevens J. Applied multivariate statistics for the social sciences. NJ: Lawrence Erlbaum Associates; 2002. 47. King G, Law M, King S, Hurley P, Hanna S, Kertoy M, Rosenblum P. Measuring children’s participation in recreation and leisure activities: construct validation of the CAPE and PAC. Child Care Health Dev 2006;33:28–39. 48. Missiuna C, Pollock N, Law M, Walter S, Cavey N. Examination of the perceived efficacy and goal setting system (PEGS) with children with disabilities, their parents and teachers. Am J Occup Ther 2006;60:204–214. 49. Bland JM, Altman DG. Statistics notes: Cronbach’s alpha. BMJ 1997;314:572. 50. Gregory R. Psychological testing: history, principles, and applications. Boston, MA: Allyn and Bacon; 2001. 51. Goldbeck L, Schmitz T, Besier T, et al. Life satisfaction decreases during adolescence. Qual Life Res 2007;16:969–979. 52. Huebner E. Research on assessment of life satisfaction of children and adolescents. Soc Indic Res 2004;66:3–33.
Appendix. Children Participation Questionnaire (CPQ).
Child Participation Questionnaire Dear parent, This questionnaire is intended to learn the participation habits of your child in different day to day occupations. Thank you for your responsiveness, this information will assist in determining the goals of the treatment, and in determining the efficiency of the treatment in the future. Name of child: Date of birth: Name of parent: Current date: This questionnaire is intended to learn about your child’s participation in the various activities typical for children aged 4–6. Please answer in accordance
to what your child actually does, and not what your child is capable of doing. Regarding the last three months, mark the following for every activity: 1- The number representing how frequently your child participates in a certain activity, according to the key at the top of the table (for example: showers- everyday, visits a friendtwice a week, etc). In the event that your child does not participate in a certain activity at all (frequency of-0) there is no need to answer the rest of the questions regarding that activity. 2- The degree of help/assistance/ encouragement/ escorting, your child requires in participating in the activity at hand (for example: help dressing, guidance in playing a game, parental presence at a friend’s birthday party). 3- In your opinion, the degree of pleasure your child obtains from the activity (pleasure, motivation, will to carry out). 4- The degree of satisfaction you have as a parent, from the frequency of participation and from your child’s independence in the activity in general. - In the event that an activity your child participates in is not mentioned in the questionnaire you could add it to the questionnaire in the designated spot. - Refer to the activities your child performs outside the preschool. - Only in the article of ‘‘Education’’ will you be asked to regard the participation in preschool, in the event you do not know, consult with the teacher and converse with your child. Remember this information will assist in identifying the activities in which you would like to see a change.
Education 1. Attending circle time 2. Playing at schoolyard 3. Taking part in social play with kindergarten’s toys 4. Eating in meal time 5. Attending sport and music class at kindergarten 6. Doing arts and crafts at kindergarten 7. Using arts and crafts materials at kindergarten 8. Attending kindergarten ceremonies/ parties 9. Taking sport/ dancing lessons-afternoon 10. Taking music/ art lessons-afternoon 11. Taking self improvement class(science, languages) 12. Other activity: __________ (e.g. movie, theatre) 11. Other activity: __________ Social Participation 1. Playing with a friend 2. Visiting at a friends house 3. Inviting and hosting a friend 4. Attending friend’s birthday parties 5. Going to family events 6. Sleeping over at family house 7. Sleeping over at a friend’s house 8. Talking on the phone 9. Other activity: ____________ Play 1. Choosing a game 2. Playing with construction toys (building blocks, puzzles)
The activity
1 1 1 1 1 1 1 1 1 1 1 1 1 1 1 1 1 1 1 1 1 1 1 1
0 0 0 0 0 0 0 0 0 0 0 0 0 0 0 0 0 0 0 0 0 0 0 0
2 2
2 2 2 2 2 2 2 2 2
2
2
2
2
2
2
2
2
2 2
2 2 2
3 3
3 3 3 3 3 3 3 3 3
3
3
3
3
3
3
3
3
3 3
3 3 3
4 4
4 4 4 4 4 4 4 4 4
4
4
4
4
4
4
4
4
4 4
4 4 4
5 5
5 5 5 5 5 5 5 5 5
5
5
5
5
5
5
5
5
5 5
5 5 5
0- never 1- once in three months 2- 1,2 a month 3- once a week 4- twice a week 5- every day
Frequency of participation
1 1
1 1 1 1 1 1 1 1 1
1
1
1
1
1
1
1
1
1 1
1 1 1
2 2
2 2 2 2 2 2 2 2 2
2
2
2
2
2
2
2
2
2 2
2 2 2
3 3
3 3 3 3 3 3 3 3 3
3
3
3
3
3
3
3
3
3 3
3 3 3
Needs much assistance
4 4
4 4 4 4 4 4 4 4 4
4
4
4
4
4
4
4
4
4 4
4 4 4
5 5
5 5 5 5 5 5 5 5 5
5
5
5
5
5
5
5
5
5 5
5 5 5
6 6
6 6 6 6 6 6 6 6 6
6
6
6
6
6
6
6
6
6 6
6 6 6
Independent
Degree of assistance
Appendix 1
1 1
1 1 1 1 1 1 1 1 1
1
1
1
1
1
1
1
1
1 1
1 1 1
2 2
2 2 2 2 2 2 2 2 2
2
2
2
2
2
2
2
2
2 2
2 2 2
3 3
3 3 3 3 3 3 3 3 3
3
3
3
3
3
3
3
3
3 3
3 3 3
Does not take pleasure
4 4
4 4 4 4 4 4 4 4 4
4
4
4
4
4
4
4
4
4 4
4 4 4
5 5
5 5 5 5 5 5 5 5 5
5
5
5
5
5
5
5
5
5 5
5 5 5
6 6
6 6 6 6 6 6 6 6 6
6
6
6
6
6
6
6
6
6 6
6 6 6
Takes much pleasure
Child’s pleasure in participating
Disabil Rehabil Downloaded from informahealthcare.com by University of British Columbia on 08/22/12 For personal use only.
1 1
1 1 1 1 1 1 1 1 1
1
1
1
1
1
1
1
1
1 1
1 1 1
2 2
2 2 2 2 2 2 2 2 2
2
2
2
2
2
2
2
2
2 2
2 2 2
Not at all satisfied
3 3
3 3 3 3 3 3 3 3 3
3
3
3
3
3
3
3
3
3 3
3 3 3
4 4
4 4 4 4 4 4 4 4 4
4
4
4
4
4
4
4
4
4 4
4 4 4
6 6
6 6 6 6 6 6 6 6 6
6
6
6
6
6
6
6
6
6 6
6 6 6
(continued)
5 5
5 5 5 5 5 5 5 5 5
5
5
5
5
5
5
5
5
5 5
5 5 5
Very satisfied
Parental satisfaction from child’s participation
The Child Participation Questionnaire 1643
3. Playing games with rules (cards, board games) 4. Playing computer games 5. Taking part in pretend or make believe play Leisure 1. Choosing a leisure activity (occupy oneself) 2. Playing on playground equipment 3. Ridding a bike 4. Playing ball games 5. Listening to a story 6. Watching TV 7. Doing arts and crafts at home 8. Using art and craft materials 9. Going for a day trip, picnic, camping 10. Going to a live event ADL 1. Dressing 2. Showering/ Bathing 3. Brushing Teeth 4. Toileting 5. Eating with cutlery 6. Other activity: _________ IADL 1. Taking part in Organizing room/ house 2. Taking part in Meal preparation/ setting the table 3. Operating electronic device (TV, DVD, phone) 4. Shopping in grocery store 5. Taking care of pet 6. Other activity: __________
The activity 1 1 1
1 1 1 1 1 1 1 1 1 1 1 1 1 1 1 1 1 1 1 1 1 1
0 0 0
0 0 0 0 0 0 0 0 0 0 0 0 0 0 0 0 0 0 0 0 0 0
2 2 2
2
2
2
2 2 2 2 2 2
2
2 2
2 2 2 2 2
2
2
2 2
2
3 3 3
3
3
3
3 3 3 3 3 3
3
3 3
3 3 3 3 3
3
3
3 3
3
4 4 4
4
4
4
4 4 4 4 4 4
4
4 4
4 4 4 4 4
4
4
4 4
4
5 5 5
5
5
5
5 5 5 5 5 5
5
5 5
5 5 5 5 5
5
5
5 5
5
0- never 1- once in three months 2- 1,2 a month 3- once a week 4- twice a week 5- every day
Frequency of participation
1 1 1
1
1
1
1 1 1 1 1 1
1
1 1
1 1 1 1 1
1
1
1 1
1
2 2 2
2
2
2
2 2 2 2 2 2
2
2 2
2 2 2 2 2
2
2
2 2
2
3 3 3
3
3
3
3 3 3 3 3 3
3
3 3
3 3 3 3 3
3
3
3 3
3
Needs much assistance
4 4 4
4
4
4
4 4 4 4 4 4
4
4 4
4 4 4 4 4
4
4
4 4
4
5 5 5
5
5
5
5 5 5 5 5 5
5
5 5
5 5 5 5 5
5
5
5 5
5
6 6 6
6
6
6
6 6 6 6 6 6
6
6 6
6 6 6 6 6
6
6
6 6
6
Independent
Degree of assistance
Appendix. (Continued).
1 1 1
1
1
1
1 1 1 1 1 1
1
1 1
1 1 1 1 1
1
1
1 1
1
2 2 2
2
2
2
2 2 2 2 2 2
2
2 2
2 2 2 2 2
2
2
2 2
2
3 3 3
3
3
3
3 3 3 3 3 3
3
3 3
3 3 3 3 3
3
3
3 3
3
Does not take pleasure
4 4 4
4
4
4
4 4 4 4 4 4
4
4 4
4 4 4 4 4
4
4
4 4
4
5 5 5
5
5
5
5 5 5 5 5 5
5
5 5
5 5 5 5 5
5
5
5 5
5
6 6 6
6
6
6
6 6 6 6 6 6
6
6 6
6 6 6 6 6
6
6
6 6
6
Takes much pleasure
Child’s pleasure in participating
Disabil Rehabil Downloaded from informahealthcare.com by University of British Columbia on 08/22/12 For personal use only.
1 1 1
1
1
1
1 1 1 1 1 1
1
1 1
1 1 1 1 1
1
1
1 1
1
2 2 2
2
2
2
2 2 2 2 2 2
2
2 2
2 2 2 2 2
2
2
2 2
2
Not at all satisfied
3 3 3
3
3
3
3 3 3 3 3 3
3
3 3
3 3 3 3 3
3
3
3 3
3
4 4 4
4
4
4
4 4 4 4 4 4
4
4 4
4 4 4 4 4
4
4
4 4
4
5 5 5
5
5
5
5 5 5 5 5 5
5
5 5
5 5 5 5 5
5
5
5 5
5
Very satisfied
Parental satisfaction from child’s participation
6 6 6
6
6
6
6 6 6 6 6 6
6
6 6
6 6 6 6 6
6
6
6 6
6
1644 L. Rosenberg et al.