Journal of Sports Sciences, 2001, 19, 445± 462
The development and initial validation of the Exercise Causality Orientations Scale ELAINE A. ROSE,* DAVID MARKLAND and GAYNOR PARFITT School of Sport, Health and Exercise Sciences, University of Wales Bangor, George Building, Holyhead Road, Bangor, Gwynedd LL57 2PX, UK
Accepted 11 March 2001
Deci and Ryan’ s causality orientations theory suggests that there are individual diþ erences in motivational orientation towards initiating and regulating behaviour. They described three causality orientations: autonomy, control and impersonal. The aim of this paper is to describe the development and concurrent validity of the Exercise Causality Orientations Scale (ECOS), which was designed to measure the strength of these three orientations within exercise. Altogether, 592 working adults aged 35.0 ± 11.4 years (mean ± s) completed the ECOS and measures of self-determination, self-consciousness and social desirability. The analysis was conducted in two parts. First, the data were subjected to con® rmatory factor analysis using a multi-trait, multimethod framework. The original model resulted in a poor ® t to the data. On the basis of its modi® cation indices, three scenarios with ambiguous items were removed successively, resulting in a scale with good psychometric properties. Secondly, Pearson’ s correlations were conducted between the subscales of the ECOS and those of the questionnaires used for validation. Most of the results supported a priori hypotheses. In conclusion, our results show the ECOS to have good psychometric properties and they provide some support for its concurrent validity. Keywords: causality orientations, exercise, multi-trait multi-method analysis, self-determination.
Introduction There is now a wealth of knowledge of the bene® ts of adopting and maintaining a physically active lifestyle (Pate, 1995). Despite this recognition, research has shown that individuals ® nd adhering to a programme of exercise diý cult, with up to 50% of individuals dropping out within 6 months of beginning (Dishman, 1988). Given this problem, motivation to exercise has become the focus of many studies; researchers have concluded that, for exercise involvement to be maintained in the long term, it is crucial that intrinsic motivation is developed (Boothby et al., 1981; Wankel, 1985, 1993; Dishman, 1987; Frederick and Ryan, 1993; Biddle, 1999). Deci and Ryan’ s (1985a) causality orientations theory (one of the least explored areas of the overarching self-determination theory), however, argues that not everyone is motivated by intrinsic rewards. Some individuals will seek out control to regulate their behaviour, although this will mitigate * Author to whom all correspondence should be addressed. e-mail:
[email protected]
against the development of intrinsic motivation. If individuals diþ er in their motivational orientation, then in the short term it may be important to foster an exercise environment that supports their orientation so as to initiate participation. However, to encourage long-term participation, it may be important (especially in control oriented individuals) to foster an environment that promotes intrinsic motivation. According to Deci and Ryan (1985a), every event can be interpreted as being informational, controlling or amotivating and this interpretation will aþ ect the motivational consequences (increased or decreased intrinsic motivation) for, and resultant behaviour of, the individual. They suggested that circumstances construed as informational will result in a promotion of intrinsic motivation by being supportive of autonomy and providing information on competence. Controlling events will promote extrinsic motivation by imparting pressure to achieve speci® c outcomes and by conferring the feeling that behaviour is being controlled by an external source. Finally, amotivating events lead to a type of learned helplessness in which individuals feel that they cannot achieve a desired outcome. Causality
Journal of Sports Sciences ISSN 0264-0414 print/ISSN 1466-447X online Ó http://www.tandf.co.uk/journals
2001 Taylor & Francis Ltd
446 orientations theory suggests that these personalitybased causality orientations are important for how an event is interpreted and not just its characteristics. The same circumstances can be interpreted as informational by one person and controlling by another. Despite an individual’ s orientation being instrumental in deciding what features are attended to and the way in which they are interpreted (Deci and Ryan, 1985a), the context and characteristics of the event will still be taken into account and will interact with the orientation, leading to an interpretation of the situation. Deci and Ryan (1985a,b) described three causality orientations: autonomy, control and impersonal. Underlying the autonomy orientation is the experience of choice. Individuals regard the characteristics of an event as sources of information to regulate their own chosen behaviour. Individuals strive to be selfdetermining (the perception of having choice) and seek opportunities to be so. This is shown by behaviour being governed by integrated and intrinsic regulation. Integrated regulation is characterized by involvement in an activity because the outcome is personally important and valued. Intrinsic regulation is typi® ed by an involvement in an activity because of its interest and the enjoyment to be gained from it (Deci and Ryan, 1985a). Behaviour is organized through the pursuit of selfselected goals and interests; any extrinsic rewards are experienced as evidence of competence rather than as a controlling in¯ uence. Behaviour emanating from the control orientation is regulated by controls imposed by others, by oneself (by applying self-pressure such as guilt) or by the environment (reward contingencies). It is regulated by a pressure to perform and individuals ® nd themselves doing things because `they are told to’ , `they should’ , `they have to’ or `they must’ . The sense of self-determination is missing and the resultant behaviour is determined by extrinsic regulation (external pressures and the avoidance of negative consequences) or introjected regulation (pressure imposed by the self ). When control oriented, individuals rely on controlling in¯ uences such as extrinsic rewards and surveillance to motivate them. Finally, the impersonal orientation is based on the feeling that there is an independence between behaviour and outcomes. Such individuals feel unable to regulate their behaviour to be able to achieve desired outcomes and events are interpreted as being amotivating. Behaviour is not intentional and the sources of control may be largely unknown to the individual, leading to a sense of personal helplessness and incompetence. To assess the direction and strength of an individual’ s causality orientations, Deci and Ryan (1985b) devised and provided support for the validity and reliability of the General Causality Orientations Scale (GCOS). The scale was designed as a global measure to provide
Rose et al. an indication of the enduring general motivational orientation that exists across all aspects of life. It comprises 12 scenarios addressing diþ erent sets of circumstances, including interpersonal relationships, the work environment and socializing, which are followed by three responses that correspond to each causality orientation. An individual rates how much each response is characteristic of him or her in the given circumstances and a measure of the strength of each orientation is obtained. Although the orientations have been classi® ed as three distinct types, Deci and Ryan (1985b) recognized that it is not realistic to classify individuals on the basis of one orientation; each individual possesses some of each. They saw the causality orientations concept as a move towards a dimensional view of personality in which individuals are described by the interaction of two or more dimensions, rather than a categorical approach, in which they are characterized as being of a particular type. However, it is probable that an individual will have a predominant orientation and, within this study, when an individual is described as being autonomy or control oriented, we mean that autonomy or control is their predominant orientation. Correlations between the three subscales of the GCOS showed the autonomy orientation to be negatively related to the impersonal orientation and unrelated to the control orientation. The control orientation was found to be positively related to the impersonal orientation. Koestner and Zuckerman (1994) noted that the GCOS is an unusual scale; the correlational patterning of the orientations show that they are only weakly related, yet their theoretical underpinning would imply a strong negative relationship between the subscales, especially between control and autonomy. Thus, the autonomy and control orientations can be described as orthogonal, which implies that an individual’ s autonomy orientation cannot be used to indicate his or her control orientation. In developing the General Causality Orientations Scale, Deci and Ryan (1985b) recognized that the three orientations will diþ er in strength within diþ erent life contexts and that context-speci® c scales for assessing orientations are necessary to predict behaviour in those domains more accurately. Deci and Ryan (1985a) have also validated a Causality Orientations at Work Scale. Research investigating the eþ ects of diþ erent circumstances on intrinsic and extrinsic motivation has also emphasized the need for domain-speci® c scales. Scales now exist for measuring motivation in education (Vallerand et al., 1992), work (Amabile et al., 1994), leisure (Weissinger and Bandalos, 1995), exercise (Mullan et al., 1997; Li, 1999) and sport (Pelletier et al., 1995). Vallerand (1997) outlined a motivational hierarchy in which motivation operates at three levels: the global (personality), contextual (life domain) and
447
The Exercise Causality Orientations Scale situational. The hierarchy implies a top-down eþ ect of global motivation to contextual motivation such that the general motivational orientation will be channelled towards speci® c ® elds of activity. It also stipulates a bottom-up eþ ect whereby contextual motivational orientations will in¯ uence the overall general motivational orientations. Therefore, an individual’ s general (global) causality orientation will play some role in de® ning his or her contextual orientation, which in turn will con® rm their global orientation. This relationship was shown by Williams et al. (1996), who reported that a patient’ s global autonomous motivation (from the autonomy subscale of the GCOS) before their study was a signi® cant predictor of their contextual autonomous motivation (reasons for participating in the programme) 10 weeks into their weight-loss programme. Vallerand (1997) also recognized that people’ s orientations are likely to vary from one context to another and that, to predict and explain contextual motivation more precisely, it needs to be assessed at the contextual level using suitable measures. Both Vallerand (1997) and Ryan (1995) emphasized the critical need for domain-speci® c research, particularly for its applied signi® cance. The exercise habits of individuals may be in¯ uenced by their causality orientations. Within this context, exercise is de® ned as `planned, structured, and repetitive bodily movement done to improve or maintain one or more components of physical ® tness’ (Casperson et al., 1985) and is thought of as a subset of physical activity. To promote the greatest psychological bene® ts and enjoyment from exercise and provide the most motivationally adaptive environment to promote adherence requires an exploration of the interaction of personality characteristics, environmental conditions and preferences of the individual. By assessing an individual’ s exercise-speci® c causality orientations, the exercise environment most likely to ful® l these requirements may be established. For example, an individual with a predominant autonomous orientation may choose to exercise in a setting that allows choice over activities and exercise intensities, oþ ers information on competence and allows for personal goal-setting. However, a predominantly control oriented individual may choose an environment in which the exercise regimen is prescribed or controlled by someone else, where there is opportunity for external rewards to be gained and where progress is monitored continuously. It is recognized that more self-determined forms of behavioural regulation are associated with long-term participation in exercise (Mullan et al., 1997). Over time, control oriented individuals should be encouraged to adopt more autonomous regulation. However, taking into account an individual’ s predominant orientation may prove bene® cial to initiate participation. To identify
the individual’ s orientation and to address this question, an exercise-speci® c measure of causality orientations is required. The causality orientations are an indication of an individual’ s predisposition to interpret events in a particular manner and for this interpretation to in¯ uence how that individual initiates and regulates his or her behaviour. Therefore, scales to measure causality orientations diþ er conceptually from those that measure behavioural regulation (e.g. Behavioural Regulation in Exercise Questionnaire; Mullan et al., 1997) and perceived locus of causality (e.g. Locus of Causality for Exercise Scale; Markland and Hardy, 1997). The former provides a precise account of the diþ erent forms of motivation speci® c to exercise which lie along the self-determination continuum, whereas the latter is concerned with the perceived source of initiation of behaviour. There is no existing tool that measures the causality orientations concept speci® cally in the context of exercise. The aim of this paper is to describe the development and initial validation of a scale designed to assess the strength of an individual’ s exercise-speci® c causality orientations. The analysis of the data was conducted in two stages and so the paper is split into two parts. Part 1 details the development of the Exercise Causality Orientations Scale and describes its psychometric properties. Part 2 examines the concurrent validity of the scale by comparing its subscales to other constructs that were highlighted by Deci and Ryan (1985a) as being conceptually related to the causality orientations. Hypotheses for these relationships will be stated in Part 2 and are outlined as predictions.
Methods Development of the scale The format adopted for the General Causality Orientations Scale (GCOS; Deci and Ryan, 1985b) was used as the template for the Exercise Causality Orientations Scale (ECOS). A series of scenarios were written (using the same design as the GCOS) that addressed aspects of the exercise experience, including preferences for a new exercise programme, reasons for exercising and monitoring progress. Each scenario was followed by three responses, one corresponding to each causality orientation. These responses captured the de® ning features of each causality orientation as described by Deci and Ryan (1985a,b) as they would relate to the scenario described. This allowed the diþ erent reactions expected from each orientation to be assessed in relation to a set of speci® c circumstances. Each response was rated on a 7-point Likert scale anchored by the labels `very unlikely’ (1) and `very likely’ (7). Individuals
448 indicated the extent to which each response was characteristic of them in these circumstances. An example of one scenario is: You are asked to keep a record of all the weekly exercise you have completed in an exercise diary. You are likely to view the diary: As a way to measure your progress and to feel proud of your achievements. (Autonomy) As a way of pressurizing yourself to exercise. (Control) As a reminder of how incapable you are at ful® lling the task. (Impersonal)
The attention to monitoring progress and feeling proud suggests high intrinsic motivation and an enjoyment of the exercise for its own sake. Viewing the diary as a source of pressure suggests a need to be controlled. Finally, the pervasive sense of being incapable suggests a worry about not being in control of outcomes. An initial pool of 19 scenarios and 57 items was written. We conducted two pilot studies in which the scale was administered to 383 undergraduate students (158 males, 193 females) aged 20.7 ± 5.2 years (mean ± s). Bivariate correlations and an exploratory factor analysis with varimax rotation were conducted on the data from each pilot study (the results of the pilot studies can be obtained from the ® rst author on request). From these analyses, scenarios were retained whose items showed the greatest number of signi® cant correlations with items re¯ ecting the same orientation and whose items loaded on the factor for which they had been written (e.g. the autonomy items loaded on the autonomy factor).
Rose et al. Table 1. Diþ erences between males and females for each causality orientation (mean ± s)
Males Females
Autonomy
Control
Impersonal
44.5 ± 9.1 44.3 ± 9.0
31.8 ± 8.3* 36.5 ± 8.2
24.2 ± 8.0 25.8 ± 8.3
* Signi® cant diþ erence between males and females, P < 0.001.
deletion for missing values) comprised 222 men and 329 women (12 did not report their sex) aged 16± 66 years (35.8 ± 11.3 years). The original sample comprised 592 individuals and the response rate was 42%. Table 1 shows the diþ erences in mean scores between males and females on each of the subscales of the ECOS. It can be seen that the males scored signi® cantly higher on the control subscale. Participants reported varying physical activity habits from sedentary (not exercising regularly) to highly active (exercising three or more times a week). A modi® cation of the Leisure Time Physical Activity Scale devised by Godin and Shephard (1985) was used to measure physical activity habits. Individuals reported how often in a typical week they exercised ± strenuously, moderately or mildly ± for longer than 15 min. Correlations between the Leisure Time Physical Activity Scale and each subscale of the ECOS found activity to be signi® cantly positively related to the autonomy subscale (r = 0.179, P < 0.001) and negatively related to the impersonal subscale (r = -0.201, P < 0.001). Of the 167 university staþ , 98 agreed to participate in a 2-month retest. Sixty-six completed questionnaires were received.
Completed version The completed Exercise Causality Orientations Scale comprised nine scenarios and 27 items (see Appendix). From the pilot studies, three of the scenarios required one item to be reworded to make its emphasis more controlling. The stem of one scenario was rewritten to make it sound more hypothetical by trying to get the respondents to think of themselves being in those circumstances despite never having exerienced them.
Participants The nine-scenario Exercise Causality Orientations Scale was administered to nine samples of working adults consisting of university staþ (n = 167) and employees of eight private companies (n = 427). Two large companies were approached to take part but they refused. Therefore, smaller companies were contacted to take part until suý cient completed questionnaires were returned. The eþ ective sample (after listwise
Procedure Consent was obtained from each company and university department to approach staþ . Participants were then given a pack (either by a contact within each company or department or by mail) which explained the purpose of the research and which contained the Exercise Causality Orientations Scale, the Leisure Time Physical Activity Scale, a questionnaire asking for details of age and sex and certain questionnaires to be used in the validation of the ECOS (these instruments will be described in the statistical analysis section where the rationales for the scales used are presented). It was stated explicitly that participation was entirely voluntary. Completed questionnaires were returned by mail either directly to the investigator or to a contact within the company who forwarded them. Those questionnaires distributed to the university staþ asked if participants would consider completing the ECOS again in 2 months. Upon receipt of completed
The Exercise Causality Orientations Scale questionnaires, participants were debriefed (in the form of a letter) and thanked for their participation.
Statistical analyses As indicated earlier, the analysis of the data is split into two parts. In Part 1, the psychometric properties of the Exercise Causality Orientations Scale are examined using structural equation modelling. In the second, the concurrent validity of the scale is established by correlational analysis between its subscales and other constructs believed to be conceptually related to the causality orientations. Part 1 The structure of the scale lends itself to statistical investigation by multi-trait, multi-method analysis, which helps to determine the true relationship among traits when the eþ ects of method variance (an artefact of measurement) and random error are present (Schmitt and Stults, 1986). The simple rationale is that traits can be measured by diþ erent methods but the magnitude of a trait should not change depending on the measurement instrument used (Wothke, 1996). In this analysis, each of the nine scenarios was classed as a method and the three orientations (autonomy, control and impersonal) were considered traits. The data were analysed by con® rmatory factor analysis using LISREL 8.30 ( J” reskog and S” rbom, 1999), the most popular and widely advocated method for analysing the multi-trait, multi-method matrix (Marsh and Bailey, 1991; Kenny and Kashy, 1992). The variance± covariance matrix was computed using PRELIS 8.3 ( J” reskog and S” rbom, 1999) and maximum likelihood estimation was used. The scaled test statistic of Satorra and Bentler (1988, 1994), scaled x2, was used to correct for non-normality after analyses indicated that the data showed departure from multivariate normality. The normalized Mardia coeý cients were 35.4 for skewness (P < 0.0001) and 21.8 for kurtosis (P < 0.0001). Marsh (1988, 1989) and Marsh and Grayson (1995) recommended that, for multi-trait, multi-method data, four models should be compared and evaluated in relation to each other and a priori predictions. The four models speci® ed were those with: traits/correlated methods, the complete · correlated model; traits; · correlated correlated methods; · correlated traits/uncorrelated traits/correlated uniquenesses; the recom· mended model.
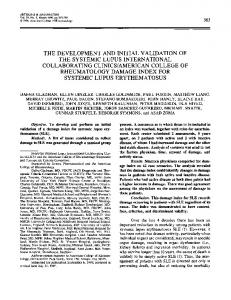
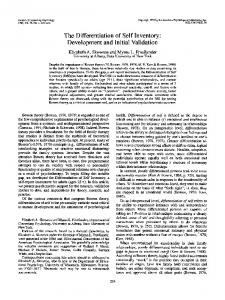
449 The correlated traits/correlated methods model is the full and complete model and allows the three traits to intercorrelate and nine methods to intercorrelate (see Fig. 1). It provides an unambiguous interpretation of convergent validity, discriminant validity and method eþ ects when the trait factor loadings, method factor loadings and trait correlations are evaluated. The correlated traits and correlated traits/uncorrelated methods models are nested within the correlated traits/ correlated methods model. The correlated traits model does not posit method factors and allows the three traits to correlate (see Fig. 2). When compared to the other con® rmatory factor analysis models, it provides an indication of the size of any method eþ ects. The correlated traits/uncorrelated methods model speci® es method factors but does not allow them to correlate; only the traits are correlated (see Fig. 3). When compared to the correlated traits/correlated methods model, this model provides a test of whether the method eþ ects are correlated. The correlated traits/correlated uniquenesses model is not nested within the correlated traits/ correlated methods model. In this model, the three traits are correlated and method eþ ects are inferred from the correlated uniquenesses among the three items based on the same method (see Fig. 4). It assumes that the method eþ ects associated with each diþ erent method are uncorrelated. When compared to the correlated traits/uncorrelated methods model, it provides a test of whether method eþ ects are uni- or multi-dimensional. Kenny and Kashy (1992) and Marsh and Bailey (1991) observed that, because of estimation and identi® cation problems, in most cases the correlated traits/ correlated methods model rarely arrives at a unique and proper solution and the estimates obtained have suspect precision. These authors cited the correlated traits/ correlated uniquenesses model as the preferred model. It has been shown to result in proper solutions for all sizes of matrices and sample sizes. Therefore, the present study places most emphasis on the correlated traits/correlated uniquenesses model. Analysis of the data showed that these identi® cation and estimation problems occurred for the correlated traits/correalted methods and correlated traits/uncorrelated methods models and solutions could not be generated. Subsequently, only the ® t of the correlated traits and correlated traits/correlated uniquenesses models could be compared. For a full discussion of multi-trait, multi-method techniques, interested readers should consult Marsh and Grayson (1995). As recommended by Hoyle (1995) and Hoyle and Panter (1995), a variety of ® t indices from diþ erent classes were used to evaluate goodness-of-® t. These were scaled x2 (Satorra and Bentler, 1988, 1994), the comparative ® t index (Bentler, 1990), the non-normed ® t index (Tucker and Lewis, 1973), the incremental ® t
450
Rose et al.
Fig. 1. The correlated traits/correlated methods model.
Fig. 2. The correlated traits model.
index (Bollen, 1989), the root mean square error of approximation (Steiger, 1990) and the standardized root mean square residual (Bentler, 1995). As proposed by Hu and Bentler (1999), the criteria for evaluation of ® t was close to 0.95 for the comparative ® t index, incremental ® t index and non-normed ® t index, close to 0.06 for the root mean square error of approximation and close to 0.08 for the standardized root mean square residual. The 90% con® dence intervals for the root mean
square error of approximation were also examined. The value of this error of approximation should not be signi® cant; the signi® cance test examines the probability that its value is larger than 0.05. Hu and Bentler (1999) also recommend that ® t indices should be evaluated in combination to provide a better assessment of model ® t. When used in combination, the criteria are: 0.95 for non-normed ® t index, comparative ® t index, incremental ® t index with standardized root mean
451
The Exercise Causality Orientations Scale
Fig. 3. The correlated traits/uncorrelated methods model.
Fig. 4. The correlated traits/correlated uniquenesses model.
square residual < 0.09 and root mean square error of approximation < 0.06 with standardized root mean square residual < 0.09. The parsimony normed ® t index (James et al., 1982) and consistent Akaike information criterion (Cudeck and Browne, 1983) were used to compare the ® t of competing models. For detailed assessment of ® t, the completely standardized parameter estimates and residuals were examined for direction and magnitude. Finally, to gain the best ® tting model, the modi® cation indices of the correlated traits/correlated uniquenesses model were evaluated to determine which, if any, scenarios had any ambiguous items so that such scenarios could be
removed from the analysis. The internal consistency of the three subscales of the Exercise Causality Orientations Scale was investigated using Cronbach’ s alpha, while the retest reliability was examined using intraclass correlations with 95% con® dence intervals. Part 2 Pearson’ s correlational analysis was used to explore the concurrent validity of the Exercise Causality Orientations Scale by comparing its subscales with the following constructs highlighted by Deci and Ryan (1985a) to be conceptually related to the causality
452 orientations. Because of the number of correlations being conducted, there was an increased risk of Type I error. The table of critical r-values developed by Wallace and Snedecor (1931; cited in Shavelson, 1988) was used to establish the signi® cance of the resulting r-value based on the number of a priori comparisons to be made (i.e. 20) and the degrees of freedom (286 or 292). General causality orientations. The General Causality Orientations Scale (GCOS), developed by Deci and Ryan (1985b) and described earlier, was used to give a measure of global causality orientations. The scale has been found to have acceptable internal consistency and test± retest reliability and its construct validity has been supported (Deci and Ryan, 1985b). In this study, Cronbach’ s alphas for the three subscales were 0.69 (autonomy), 0.59 (control) and 0.77 (impersonal). Hypotheses. Vallerand (1997) suggested that this global personality orientation will play some role in de® ning orientations in diþ erent contexts. Therefore, there will be signi® cant correlations between the subscales of the GCOS and the corresponding ones of the Exercise Causality Orientations Scale. Additionally, because previous research has found the impersonal orientation to be negatively related to the autonomy orientation and positively related to the control orientation, it is expected that the same pattern of correlations will emerge across the two instruments. Behavioural regulation in exercise. The Behavioural Regulation in Exercise Questionnaire, developed by Mullan et al. (1997), establishes levels of self-determination for exercise. It comprises four subscales ± extrinsic regulation, introjected regulation, identi® ed regulation and intrinsic regulation ± which range from non-self-determined regulation to complete selfdetermination. It was scored using a 4-point Likert scale with verbal anchors of `not true for me’ (0) to `very true for me’ (4). Separate subscale scores and a relative autonomy index (Ryan and Connell, 1989) were computed. The relative autonomy index is a single score which gives an indication of self-determination; the higher the relative autonomy index, the greater the self-determination. It was determined by applying a weighting of -2, -1, +1 and +2 to extrinisic regulation, introjected regulation, identi® ed regulation and intrinsic regulation, respectively, and then summing the products. Acceptable reliability and discriminant validity were found for the subscales as well as overall factorial validity of the scale (Mullan et al., 1997). In this study, Cronbach’ s alphas for the four subscales were 0.76 (extrinsic regulation), 0.75 (introjected regulation), 0.85 (identi® ed regulation) and 0.94 (intrinsic regulation). Hypotheses. The autonomy orientation is characterized by self-determination and will, therefore, be
Rose et al. positively correlated with identi® ed and intrinsic regulation. The control orientation undermines the development of self-determination and will be positively correlated with external and introjected regulation. The impersonal orientation is the antithesis of selfdetermination and will be positively related to external regulation and negatively related to intrinsic regulation. Finally, the autonomy orientation will be positively correlated with the relative autonomy index and the control and impersonal orientations will be negatively correlated with it. Locus of causality for exercise. The Locus of Causality for Exercise Scale, developed by Markland and Hardy (1997), measures perceived locus of causality for exercise. It was scored using a 7-point Likert scale with verbal anchors of `strongly agree’ (1) and `strongly disagree’ (7). High scores indicate a more internal perceived locus of causality. Support for the scale’ s factorial and construct validity has been reported (Markland and Hardy, 1997; Markland, 1999). In this study, Cronbach’ s alpha was 0.74. Hypotheses. Although not synonymous with selfdetermination, locus of causality and self-determination are very similar. Locus of causality is concerned with the source of initiation of behaviour, whereas selfdetermination is regarded as being principally concerned with the perception of choice. However, high self-determination is equated with an internal perceived locus of causality and low self-determination is indicative of an external perceived locus of causality. Therefore, the autonomous orientation will show a positive correlation with the Locus of Causality for Exercise Scale, while the control and impersonal orientations will show negative correlations. The Revised Self-Consciousness Self-consciousness. Scale, devised by Scheier and Carver (1985), measures self-consciousness. It consists of three subscales: private self-consciousness (the awareness of aspects of oneself hidden from others; e.g. beliefs, values and feelings), public self-consciousness (the tendency to see oneself as others do) and social anxiety (concern over how people view you and anxiety about being evaluated by others). It was scored using a 4-point Likert scale with anchors of `not at all like me’ (0), `a little like me’ (1), `somewhat like me’ (2) and `a lot like me’ (3). The psychometric properties of the revised scale are comparable to those of the original (Scheier and Carver, 1985). In this study, Cronbach’ s alphas for each of the three subscales were 0.76 (private), 0.83 (public) and 0.79 (social anxiety). Hypotheses. Public self-consciousness will be correlated with the control orientation because the search for a controlling environment may involve comparing
453
The Exercise Causality Orientations Scale oneself to others and being sensitive to what others think of you (Deci and Ryan, 1985b). Private selfconsciousness will correlate positively with the autonomy orientation because behaviour is initiated and regulated with respect for personally valued outcomes and feelings. Finally, social anxiety will show a positive correlation with the impersonal orientation because the experience of new circumstances, the concern over how people will view you and the evaluation anxiety experienced is indicative of the impersonal orientation. Social anxiety derives in part from public selfconsciousness because to be anxious about how people view you, you need to be focused on your public self. Therefore, social anxiety will also be positively related to the control orientation. The 13-item short form of the Social desirability. Marlowe-Crowne Social Desirability Scale (Crowne and Marlowe, 1960), validated by Reynolds (1982), measures social desirability (the extent to which the responses given to questionnaires are aþ ected by individuals responding in a socially desirable manner). Participants responded either true or false to a series of statements concerning personal attitudes, where a score of 1 is attributed to the socially desirable response and a score of zero is given to the non-socially desirable response. The validity and reliability of the short form of the scale are comparable to those of the standard form (Reynolds, 1982). Hypotheses. In this instance, the autonomy orientation could be suggested to be the most attractive and socially desirable response set. Ideally, there will be no correlation between social desirability and any of the orientations.
Part 1: Psychometric properties Results and discussion As indicated previously, the correlated traits/correlated methods and correlated traits/uncorrelated methods models could not be computed owing to identi® cation
problems, leaving comparisons to be made only between the correlated traits/correlated uniquenesses and correlated traits models. The ® t indices for the latter two models are shown in Table 2. Neither model showed a good ® t to the data, but the correlated traits/correlated uniquenessesmodel showed a better ® t than the correlated traits model and is reported to be a more natural and heuristic representation of multi-trait, multi-method data than the other models (Marsh and Bailey, 1991). The improved ® t of the correlated traits/correlated uniquenesses model shows that the method eþ ects are multidimensional and do not form a single latent method factor. However, the ® t of the model was far from acceptable. The scaled x2 value was signi® cant, showing that the observed and implied models were diþ erent. The comparative ® t index, nonnormed ® t index and incremental ® t index indicated that, compared with the null model, the ® t of the correlated traits/correlated uniquenesses model was poor. On a more positive note, the root mean square error of approximation showed that the model was acceptable at approximating the data (< 0.06) with the con® dence intervals being small. However, the value was signi® cantly greater than 0.05. The standardized root mean square residual showed that the average of the residuals was acceptable. Examination of the modi® cation indices of the correlated traits/correlated uniquenesses model found four scenarios to have many modi® cation indices. These scenarios were removed one at a time and each time the correlated traits/correlated uniquenesses model was respeci® ed. This process was repeated until four correlated traits/correlated uniquenesses models were speci® ed and could be compared. This process did not involve freeing up parameters; it simply reduced the number of items indicating each latent variable. The ® t indices of these models are shown in Table 3. The ® t of the correlated traits/correlated uniquenesses model improved with each scenario that was removed. The six-scenario and the seven-scenario models produced the most acceptable ® ts, with the six-scenario model showing a slightly better ® t. For
Table 2. Fit indices for the correlated traits (CT) model and the correlated traits/correlated uniquenesses (CTCU) model
Model
Scaled x2
Unadjusted x2
d.f.
CFI
NNFI
IFI
SRMR
RMSEA
90% CI for RMSEA
CT CTCU
1146** 830**
1362** 953**
321 294
0.84 0.89
0.82 0.87
0.84 0.89
0.09 0.08
0.07** 0.06*
0.06; 0.07 0.05; 0.06
Abbreviations: Scaled x2 = Satorra Bentler scaled test statistic; d.f. = degrees of freedom; CFI = comparative ® t index; NNFI = non-normed ® t index; IFI = incremental ® t index; SRMR = standardized root mean square residual; RMSEA = root mean square error of approximation; 90% CI for RMSEA = 90% con® dence interval for RMSEA. ** P < 0.001, * P < 0.01.
454
Rose et al.
Table 3. Fit indices for each correlated traits/correlated uniquenesses (CTCU) model following scenario deletion
CTCU modela
Scaled x2
Unadjusted x2
d.f.
CFI
NNFI
IFI
SRMR
RMSEA
90% CI for RMSEA
Nine scenarios Eight scenarios Seven scenarios Six scenarios
830** 562** 387** 252**
953** 645** 445** 298**
294 225 165 114
0.89 0.93 0.96 0.97
0.87 0.90 0.91 0.92
0.89 0.93 0.96 0.97
0.08 0.07 0.06 0.06
0.06* 0.05 0.05 0.05
0.05; 0.06 0.05; 0.06 0.04; 0.06 0.04; 0.05
Abbreviations: Scaled x2 = Satorra Bentler scaled test statistic; d.f. = degrees of freedom; CFI = comparative ® t index; NNFI = non-normed ® t index; IFI = incremental ® t index; SRMR = standardized root mean square residual; RMSEA = root mean square error of approximation; 90% CI for RMSEA = 90% con® dence interval for RMSEA. a The number of scenarios left in the analysis. ** P < 0.001, * P < 0.01.
both models, the comparative ® t index (sevenscenario = 0.96; six-scenario = 0.97) and incremental ® t index (seven-scenario = 0.96; six-scenario = 0.97) indicated that the model was a good ® t, with both indices above the accepted cut-oþ criterion of close to 0.95. The non-normed ® t indices of 0.91 (sevenscenario) and 0.92 (six-scenario) were not so encouraging. However, Marsh et al. (1996) and Yadama and Pandey (1995) advised caution when considering the non-normed ® t index. They observed that, in simulation studies, the non-normed ® t index has shown large sampling ¯ uctuations and large within-cell standard deviations. Yadama and Pandey (1995) reported that the non-normed ® t index, comparative ® t index and incremental ® t index are all positively associated with sample size but, while the incremental ® t and comparative ® t indices are relatively stable, the non-normed ® t index shows wide variation between different sample sizes. Hu and Bentler (1995) suggested that this problem may not be so great when using maximum likelihood estimation. Bentler (1992) stated a preference for the comparative ® t over the nonnormed ® t index, suggesting that it was a better measure of model ® t and that indices should not mix model parsimony and criteria of ® t into a single index. These factors may account for the discrepancy between the non-normed ® t index and the other indices; the comparative ® t and incremental ® t indices should be taken to re¯ ect the true ® t of the model. The root mean square errors of approximation (six- and seven-scenario = 0.05) again indicated an acceptable ® t; values were less than the 0.06 criterion and non-signi® cant, showing that they were not signi® cantly greater than 0.05. When taken in combination, the root mean square errors of approximation and standardized root mean square residuals (six- and seven-scenario = 0.06) are below the 0.05 and 0.06 criteria respectively, as are those of the latter (0.09) combined with the comparative ® t and incremental ® t indices (cut-oþ criterion 0.95), giving increased con-
® dence in the goodness-of-® t of the model. In comparing the seven- and six-scenario models, the sevenscenario model (together with the eight-scenario model) resulted in the highest parsimony normed ® t index (0.63 compared to 0.61), while the six-scenario model resulted in the lowest consistent Akaike information criterion (670 compared to 871). This suggests that, based on parsimony, the seven-scenario model may be the better model. Table 4 shows the parameter estimates and uniquenesses and Table 5 the trait± factor correlations used to evaluate the detailed assessment of ® t of the six- and seven-scenario models. The parameter estimates for both models were adequate (above 0.3) and signi® cant with small standard errors, showing that the model has good convergent validity. Each correlated uniqueness represents the correlation between traits sharing the same method once the trait eþ ects are removed. If they are small and non-signi® cant, then method eþ ects are insubstantial. As can be seen, most of the uniquenesses were signi® cant and large, indicating the presence of multidimensional method eþ ects. It could be expected that this model would show method eþ ects because the scenario on which each trait is based is the same. The trait± factor correlations show that the autonomy and control traits are unrelated, the autonomy and impersonal traits have a negative relationship (sevenscenario = -0.53, six-scenario = -0.61) and the impersonal and control traits have a positive relationship (seven-scenario = 0.55, six-scenario = 0.52). These results limit the discriminant validity of the scale. However, given that we cannot classify individuals as having one orientation and that they will have a certain level of each, it was to be expected that the subscales would be related. Marsh and Bailey (1991) reported that the correlated traits/correlated uniquenesses model may have a tendency to demonstrate stronger convergent validity but weaker discriminant validity, with the model being a conservative test of discriminant validity.
Aut Con Imp
Aut Cont Imp
Aut Con Imp
Aut Con Imp
Aut Con Imp
Aut Con Imp
Aut Con Imp
1
2
3
4
5
6
7
0.38 ± 0.04 0.30 ± 0.05 0.44 ± 0.05 0.45 ± 0.05 0.35 ± 0.05 0.40 ± 0.05 0.63 ± 0.05 0.61 ± 0.05 0.51 ± 0.04 0.66 ± 0.04 0.38 ± 0.05 0.46 ± 0.05 0.60 ± 0.04 0.43 ± 0.05 0.46 ± 0.05 0.43 ± 0.05 0.50 ± 0.05 0.49 ± 0.05
0.39 ± 0.05 0.29 ± 0.05 0.38 ± 0.06
0.46 ± 0.05 0.31 ± 0.05 0.42 ± 0.05
0.65 ± 0.05 0.63 ± 0.05 0.53 ± 0.05
0.67 ± 0.04 0.38 ± 0.05 0.50 ± 0.05
0.62 ± 0.04 0.45 ± 0.05 0.52 ± 0.05
0.38 ± 0.06 0.46 ± 0.05 0.42 ± 0.06 0.41 ± 0.06 0.52 ± 0.05 0.59 ± 0.04
7-scenario
6-scenario
0.85 ± 0.06* -0.01 ± 0.04 0.03 ± 0.04
0.62 ± 0.06* -0.08 ± 0.04* -0.21 ± 0.05*
0.56 ± 0.06* -0.13 ± 0.04* -0.10 ± 0.04*
0.58 ± 0.06* 0.02 ± 0.04 -0.01 ± 0.04
0.79 ± 0.05* 0.21 ± 0.04* -0.04 ± 0.04
0.85 ± 0.04* -0.15 ± 0.04* 0.00 ± 0.04
0.79 ± 0.05* 0.10 ± 0.04*
0.80 ± 0.06* -0.05 ± 0.04
0.85 ± 0.06* -0.18 ± 0.04*
0.60 ± 0.06 -0.12 ± 0.04*
0.90 ± 0.05* 0.06 ± 0.04
0.92 ± 0.04* 0.06 ± 0.04
6-scenario
0.82 ± 0.06*
0.73 ± 0.07*
0.75 ± 0.07*
0.72 ± 0.05*
0.82 ± 0.06*
0.86 ± 0.05*
0.83 ± 0.06* -0.14 ± 0.04* -0.02 ± 0.04
0.82 ± 0.06* 0.01 ± 0.04 0.04 ± 0.04
0.64 ± 0.06* -0.07 ± 0.04* -0.24 ± 0.05*
0.57 ± 0.05* -0.13 ± 0.03* -0.12 ± 0.04*
0.60 ± 0.06* 0.01 ± 0.03 -0.05 ± 0.04
0.80 ± 0.05* 0.20 ± 0.04* -0.06 ± 0.04
0.85 ± 0.04* -0.14 ± 0.04* 0.01 ± 0.04
Uniquenesses
0.73 ± 0.05* 0.13 ± 0.04*
0.75 ± 0.05* 0.06 ± 0.04
0.81 ± 0.05* -0.04 ± 0.04
0.86 ± 0.06* -0.19 ± 0.04*
0.63 ± 0.06* -0.10 ± 0.04*
0.88 ± 0.04* 0.05 ± 0.04
0.91 ± 0.04* 0.04 ± 0.04
7-scenario
0.65 ± 0.05*
0.76 ± 0.06*
0.79 ± 0.07*
0.79 ± 0.07*
0.74 ± 0.05*
0.84 ± 0.06*
0.81 ± 0.05*
Note: All parameter estimates are signi® cant. LISREL 8.3 does not give standard errors and t-values for the completely standardized solution. The standard errors presented are rescaled by dividing the completely standardized parameter estimates by their t-values derived from the unstandardized solution (Marsh, 1993). Abbreviations: Aut = autonomy; Con = control; Imp = impersonal. * P < 0.05.
Trait
Method
Parameter estimates
Table 4. Standardized parameter estimates and uniquenesses for the six- and seven-scenario models (mean ± standard error)
456
Rose et al.
Table 5. Trait± factor correlations for the six- and seven-scenario models (mean ± standard error) 6-scenario
Autonomy Control Impersonal
Autonomy
Control
1.0 -0.07 ± 0.08 -0.61 ± 0.06*
1.00 0.52 ± 0.08*
7-scenario Impersonal
Autonomy
Control
Impersonal
1.00
1.00 0.01 ± 0.08 -0.53 ± 0.06*
1.00 0.55 ± 0.07*
1.00
* P < 0.05.
Internal consistency The non-standardized Cronbach’ s alphas for the sevenscenario correlated traits/correlated uniquenesses model were autonomy 0.70, control 0.65 and impersonal 0.68; those for the six-scenario model were autonomy 0.69, control 0.59 and impersonal 0.63. The standardized values were only marginally higher. These results show that the reliabilities of both models are reasonable and, as expected, those of the seven-scenario model were higher because of more indicator items.
Temporal stability The intraclass correlations and 95% con® dence intervals assessing 2-month test± retest reliability for the seven-scenario correlated traits/correlated uniquenesses model were autonomy 0.73 (0.59± 0.82), control 0.77 (0.65± 0.85) and impersonal 0.71 (0.57± 0.81). Those for the six-scenario model were autonomy 0.71 (0.56± 0.81), control 0.76 (0.64± 0.85) and impersonal 0.69 (0.54± 0.80); all were signi® cant at P < 0.001, showing that the scores on the Exercise Causality Orientations Scale are relatively stable over time. In conclusion, the model proposed to have the best ® tting solution is the scale with seven scenarios. This is preferred over the six-scenario version for several reasons. There are virtually no diþ erences in their ® t statistics and, on the basis of model parsimony, the seven-scenario solution is superior. The subscale reliabilities are greater in the seven-scenario solution (especially the control subscale) and can all be described as acceptable. Finally, and more importantly, retaining more scenarios for the ® nal scale improves the content validity of the scale. The following section examines the concurrent validity in more detail.
Part 2: Validity assessment Participants Two packs containing diþ erent validation questionnaires were circulated to diþ erent companies. The
pack that contained the Locus of Causality for Exercise Scale, Social Desirability Scale and General Causality Orientations Scale was distributed to staþ of the university and one company. These were completed by 121 men and 167 women (one did not report their sex) aged 37.3 ± 11.2 years. The response rate was 30%. The other pack, which contained the Behavioural Regulation in Exercise Questionnaire and the Revised Self-Consciousness Scale, was completed by 117 men and 177 women (11 did not report their sex) aged 34.9 ± 11.4 years. The response rate was 45%.
Results and discussion The patterns of results between each of the subscales of the Exercise Causality Orientations Scale and those of the validation questionnaires are shown in Table 5. Because of the number of correlations being conducted, the resulting r-values were adjusted based on Wallace and Snedecor’ s (1931) recommendations. All correlations were in the low to moderate range. Among those correlations that were signi® cant, all but one were signi® cant at P < 0.001. General causality orientations As predicted according to the hypotheses, the autonomy subscale of the General Causality Orientation Scale (GCOS) showed a signi® cant positive correlation with the autonomy subscale of the Exercise Causality Orientations Scale (ECOS) (r = 0.40). The control subscale of the GCOS showed signi® cant positive correlations with the control (r = 0.27) and impersonal (r = 0.34) subscales of the ECOS. Finally, the impersonal subscale of the GCOS showed signi® cant positive correlations with the impersonal (r = 0.47) and control (r = 0.32) subscales of the ECOS. These results show that, as expected, the same orientation subscales of the GCOS and ECOS were signi® cantly correlated. This may indicate a reciprocal relationship between global and contextual orientations, as discussed by Vallerand (1997). As discussed earlier, both the ECOS and the GCOS autonomy and impersonal subscales
457
The Exercise Causality Orientations Scale Table 6. Adjusted correlations between the subscales of the ECOS and the validation questionnaires Autonomy General Causality Orientations Scale Autonomy 0.40** Control 0.07 -0.13 Impersonal Locus of Causality for Exercise Scale
0.21
Control
Impersonal
0.18 0.27* 0.32**
-0.21 0.34** 0.47**
-0.18
-0.31**
Behavioural Regulation in Exercise Questionnaire -0.08 External regulation 0.28** Introjected regulation 0.21 0.22 Identi® ed regulation 0.50** 0.06 -0.02 Intrinsic regulation 0.42** -0.14 Relative autonomy index 0.41**
0.26** -0.01 -0.26** -0.29** -0.35**
Revised Self-Consciousness Scale Private self-conscious 0.13 Public self-conscious 0.02 -0.17 Social anxiety
-0.01 0.10 0.21
Marlowe-Crowne Social Desirability Scale
0.09
0.11 0.29** 0.14 -0.13
-0.12
Note: Correlations were adjusted using the table of critical r-values (Wallace and Snedecor, 1931). ** P < 0.001; * P < 0.05. n = 289 for the Locus of Causality for Exercise Scale, MarloweCrowne Social Desirability Scale and General Causality Orientation Scale; n = 294 for the Behavioural Regulation in Exercise Questionnaire and Revised Self-Consciousness Scale.
were negatively related, the autonomy and control subscales were unrelated and the control and impersonal subscales were positively related. On the whole, across the two instruments, this pattern of results also emerged, which begins to support the content validity of the ECOS. Although the GCOS control subscale showed a stronger correlation with the ECOS impersonal subscale than with its control subscale and, similarly, the ECOS control subscale showed a stronger correlation with the GCOS impersonal subscale than its control subscale, Fisher’ s z-transformations showed that these correlations were not signi® cantly diþ erent from one another. Nevertheless, the patterns of these correlations are not entirely in line with expectations. Behavioural regulation in exercise The correlations between the subscales of the Behavioural Regulation in Exercise Questionnaire and the ECOS subscales were all in the anticipated direction. The autonomy subscale showed a positive correlation with identi® ed regulation (r = 0.50) and intrinsic regulation (r = 0.42). These results indicate a
link between the autonomy orientation and engaging in exercise because of the importance of achieving an outcome and out of interest and enjoyment. The control subscale was positively related to external regulation (r = 0.28) but not to introjected regulation, as expected. These results show a relationship between the control orientation and engaging in exercise because of external pressure (from someone else) to do so, but not necessarily from internal pressure (from within the self). Finally, the impersonal orientation was positively related to external regulation (r = 0.26) and negatively related to identi® ed regulation (r = -0.26) and intrinsic regulation (r = -0.29). This pattern of results indicates an association between the impersonal orientation and engaging in exercise because of external pressure and not because of its value, bene® ts or out of enjoyment. This is indicative of the belief that outcomes cannot be attained by initiating a certain behaviour. Before a correlation between the relative autonomy index and the ECOS could be computed, it was ® rst necessary to establish that there was a simplex pattern between the subscales of the Behavioural Regulation in Exercise Questionnaire such that those subscales closer on the
458 self-determination continuum displayed a greater positive correlation than those further apart (Ryan and Connell, 1989). This pattern was found. As expected, the correlations between the relative autonomy index and the ECOS showed the autonomy subscale to have a positive relationship (r = 0.41) and the impersonal subscale to have a negative relationship (r = -0.35) with the index. These results show that the autonomy orientation is linked with high self-determination and the impersonal orientation is linked with low self-determination. The control orientation was not signi® cantly correlated with the relative autonomy index. Locus of causality for exercise Unexpectedly, there were no signi® cant correlations between the autonomy and control subscales of the ECOS and the Locus of Causality for Exercise Scale, but the impersonal orientation did show a signi® cant negative correlation (r = -0.31). This indicated that a higher score on the impersonal subscale was related to a less internal perceived locus of causality. This supports Deci and Ryan’ s (1985b) contention that the impersonal orientation is not supportive of selfdetermination. However, it did not support the hypotheses that the autonomy orientation is associated with a more internal perceived locus of causality and the control orientation is associated with a less internal perceived locus of causality. Self-consciousness The only signi® cant relationship was between the control subscale of the ECOS and public selfconsciousness (r = 0.29). This showed a link between having a high control orientation and being more likely to compare oneself to others. The lack of a relationship between the impersonal orientation and social anxiety may indicate that being involved in exercise does not cause anxiety. Social desirability As expected, there were no signi® cant correlations between social desirability and each of the causality orientations. Overall, the results were in the predicted direction and provide good support for the concurrent validity of the Exercise Causality Orientations Scale. The results show agreement with the characteristics of an autonomy, control and impersonally oriented individual outlined by Deci and Ryan (1985a).
Rose et al. General discussion The aims of this research were to develop a psychometrically acceptable measure of causality orientations speci® c to exercise and to demonstrate its concurrent validity by examining its relationships with other related concepts. A measurement tool was constructed and rede® ned until a scale was produced that had acceptable psychometric properties. The ® nal scale consisted of seven scenarios, each depicting an aspect of the exercise experience, which were followed by three items relating to how a person with a predominance of each causality orientation (autonomy, control and impersonal) would react. On completing the scale, each individual has a score on each of the three orientations and their pattern of causality orientations for exercise can be established. This study has shown the Exercise Causality Orientations Scale (ECOS) to have good factorial validity. All but one of the ® t indices reached a level recommended by Hu and Bentler (1999) as demonstrating a good ® t; when they were evaluated in combination, further evidence was provided of a good ® t. The removal of scenarios to re® ne the scale and improve its ® t did not involve post-hoc freeing of parameters, leaving the integrity of the original model intact. This technique is regarded as a legitimate process in the development of a measurement tool (Hofmann, 1995); it was used by Markland and Ingledew (1997) to re® ne such an instrument. The ECOS was found to have good convergent validity, as shown by the size and signi® cance of the factor loadings, and acceptable discriminant validity. It was also shown to be internally consistent and to have good retest reliability. The theoretical grounding of the ECOS suggests that the control and autonomy orientations and autonomy and impersonal orientations should be negatively related, while the control and impersonal subscales should be positively related. The results of the subscale intercorrelations upheld all but one of these relationships. The results for the ECOS were similar in direction and magnitude to those for the general scale, providing support for the content validity of the scale. Therefore, as Koestner and Zuckerman (1994) implied about the general scale, the autonomy and control orientations of the ECOS can be described as orthogonal. If an individual displays a high score on the autonomy subscale, it cannot be inferred that he or she will necessarily have a low score on the control subscale. Alternatively, the control and impersonal subscales show a moderate positive relationship and as such are not orthogonal. The concurrent validity of the scale was given some support by the emergence of hypothesized relationships with constructs theoretically linked to causality orientations: the General Causality Orientations Scale
459
The Exercise Causality Orientations Scale (GCOS) and measures of self-determination and public self-consciousness, although in some cases the ® ndings were not in line with expectations. The pattern of correlations that emerged between the ECOS and the GCOS showed that global causality orientations are related to the contextual orientations, which supports one of the proposals of the motivational hierarchy described by Vallerand (1997). The use of correlational analysis precludes a causal inference being made on whether the global motivational orientation aþ ects the contextual one or vice versa. It is probable, as Vallerand suggested, that there is a reciprocal relationship whereby the global orientation aþ ects the contextual, which in turn consolidates the global motivational orientation. However, Vallerand stressed that additional research is needed to understand fully the impact of contextual motivation on global motivation. We expected the control orientation to be positively related to introjected regulation. On further inspection of the ECOS items, it is perhaps not surprising that this correlation was not signi® cant. The content of the items of the ECOS is mainly focused on external control rather than internal control. The lack of signi® cant correlations with the self-consciousness scale may be because it measures at the global (personality) level and is not context-speci® c for exercise. Further research is required to support the construct validity of the ECOS by using other related constructs and through the prediction of behaviour. Furthermore, the psychometric properties of the ECOS should be con® rmed by revalidating the scale using another sample. It is proposed that the ECOS should be used in the applied setting to assess individuals’ patterns of causality orientations so that an exercise environment can be matched to support their predominant causality orientation. In the short term, this may result in an environment that fosters the greatest psychological bene® ts and enjoyment from exercise. However, for long-term adherence, it is probable that control oriented individuals will need to be encouraged to use more self-determined forms of behavioural regulation. Using the ECOS as a research tool, this should be the subject of future investigations. In conclusion, this study has provided a rationale for context-speci® c causality orientations scales and, in particular, a scale to measure causality orientations in the context of exercise. A factorially valid and reliable scale for measuring causality orientations for exercise has been developed, which can be used both in empirical research and the applied setting. However, certain relationships were not as predicted; for example, signi® cant relationships between the GCOS control and ECOS impersonal subscales and between the ECOS control and GCOS impersonal subscales. Additionally, some expected relationships did not emerge. These
included introjected regulation and the relative autonomy index with the control subscale, the Locus of Causality for Exercise Scale with the autonomy and control subscales, private self-consciousness with the autonomy subscale and social anxiety with the impersonal subscale. Further studies of these relationships are required as well as to establish the construct validity and predictive validity of the Exercise Causality Orientations Scale with respect to behaviour.
References Amabile, T.M., Hill, K.G., Hennessey, B.A. and Tighe, E.M. (1994). The work preference inventory: Assessing intrinsic and extrinsic motivational orientations. Journal of Personality and Social Psychology, 66, 950± 967. Bentler, P.M. (1990). Comparative ® t indexes in structural models. Psychological B ulletin, 107, 238± 246. Bentler, P.M. (1992). On the ® t of models to covariances and methodology to the Bulletin. Psychological Bulletin, 88, 588± 606. Bentler, P.M. (1995). EQS Structural Equations Program Manual. Encino, CA: Multivariate Software. Biddle, S.J.H. (1999). Motivation and perceptions of control: Tracing its development and plotting its future in exercise and sport psychology. Journal of Sport and Exercise Psychology, 21, 1± 23. Bollen, K.A. (1989). A new incremental ® t index for general structural equation models. Sociological Methods and Research, 17, 303± 316. Boothby, J., Tungatt, M.F. and Townsend, A.R. (1981). Ceasing participation in sports activity: Reported reasons and their implications. Journal of Leisure Research, 13, 1± 14. Casperson, C.J., Powell, K.E. and Christensen, G.M. (1985). Physical activity, exercise, and physical ® tness. Public Health Report, 100, 125± 131. Crowne, D.P. and Marlowe, D. (1960). A new scale of social desirability independent of psychopathology. Journal of Consulting Psychology, 24, 349± 354. Cudeck, R. and Browne, M.W. (1983). Cross-validation of covariance structures. Multivariate B ehavioral Research, 18, 147± 167. Deci, E.L. and Ryan, R.M. (1985a). Intrinsic Motivation and Self-determination in Human Behavior. New York: Plenum Press. Deci, E.L. and Ryan, R.M. (1985b). The General Causality Orientations Scale: Self-determination in personality. Journal of Research in Personality, 19, 109± 134. Dishman, R.K. (1987). Exercise adherence and habitual physical activity. In Exercise and Mental Health (edited by W.P. Morgan and S.E. Goldston), pp. 57± 83. Washington, DC: Hemisphere. Dishman, R.K. (1988). Epilogue and future directions. In Exercise Adherence: Its Impact on Public Health (edited by R.K. Dishman), pp. 417± 426. Champaign, IL: Human Kinetics. Frederick, C.M. and Ryan, R.M. (1993). Diþ erences in motivation for sport and exercise and their relations with
460 participation and mental health. Journal of Sport Behaviour, 16, 124± 145. Godin, G. and Shephard, R.J. (1985). A simple method to assess exercise behaviour in the community. Canadian International Journal of Applied Sport Sciences, 10, 141± 146. Hofmann, R. (1995). Establishing factor validity using variable reduction in con® rmatory factor analysis. Educational and Psychological Measurement, 55, 572± 582. Hoyle, R.H. (1995). The structural equation modeling approach: Basic concepts and fundamental issues. In Structural Equation Modeling: Concepts, Issues, and Applications (edited by R.H. Hoyle), pp. 1± 15. Thousand Oaks, CA: Sage. Hoyle, R.H. and Panter, A.T. (1995). Writing about structural equation models. In Structural Equation Modeling: Concepts, Issues, and Applications (edited by R.H. Hoyle), pp. 158± 176. Thousand Oaks, CA: Sage. Hu, L. and Bentler, P.M. (1995). Evaluating model ® t. In Structural Equation Modeling: Concepts, Issues, and Applications (edited by R.H. Hoyle), pp. 76± 99. Thousand Oaks, CA: Sage. Hu, L. and Bentler, P.M. (1999). Cutoþ criteria for ® t indexes in covariance structure analysis: Conventional criteria versus new alternatives. Structural Equation Modelling, 6, 1± 55. James, L.R., Mulaik, S.A. and Brett, J. (1982). Causal Analysis: Models, Assumptions and Data. Beverley Hills, CA: Sage. J” reskog, K.G. and S” rbom, D. (1999). LISREL 8.30 and PRELIS 2.30 for Windows. Chicago, IL: Scienti® c Software International. Kenny, D.A. and Kashy, D.A. (1992). Analysis of the multitrait-multimethod matrix by con® rmatory factor analysis. Psychological B ulletin, 112, 165± 172. Koestner, R. and Zuckerman, M. (1994). Causality orientations, failure and achievement. Journal of Personality, 62, 321± 346. Li, F. (1999). The Exercise Motivation Scale: Its multifaceted structure and construct validity. Journal of Applied Sport Psychology, 11, 97± 115. Markland, D. (1999). Self-determination moderates the eþ ects of perceived competence on intrinsic motivation in an exercise setting. Journal of Sport and Exercise Psychology, 21, 351± 361. Markland, D. and Hardy, L. (1997). On the factorial and construct validity of the Intrinsic Motivation Inventory: Conceptual and operational concerns. Research Quarterly for Exercise and Sport, 68, 20± 32. Markland, D. and Ingledew, D.K. (1997). The measurement of exercise motives: Factorial validity and invariance across gender of a revised Exercise Motivations Inventory. British Journal of Health Psychology, 2, 361± 376. Marsh, H.W. (1988). Multitrait-multimethod analyses. In Educational Research Methodology, Measurement, and Evaluation: An International Handbook (edited by J.P. Keeves), pp. 570± 578. Oxford: Pergamon Press. Marsh, H.W. (1989). Con® rmatory factor analyses of multitrait-multimethod data: Many problems and a few solutions. Applied Psychological Measurement, 13, 335± 361. Marsh, H.W. (1993). The multidimensional structure of physical ® tness: Invariance over gender and age. Research Quarterly for Exercise and Sport, 64, 256± 273.
Rose et al. Marsh, H.W. and Bailey, M. (1991). Con® rmatory factor analyses of multitrait-multimethod data: A comparison of alternative models. Applied Psychological Measurement, 15, 47± 70. Marsh, H.W. and Grayson, D. (1995). Latent variable models of multitrait-multimethod data. In Structural Equation Modeling: Concepts, Issues and Applications (edited by R.H. Hoyle), pp. 177± 198. Thousand Oaks, CA: Sage. Marsh, H.W., Balla, J.R. and Hau, K. (1996). An evaluation of incremental ® t indices: A clari® cation of mathematical and empirical properties. In Advanced Structural Equation Modeling: Issues and Techniques (edited by G.A. Marcoulides and R.E. Schumacker), pp. 315± 353. Mahwah, NJ: Lawrence Erlbaum Associates. Mullan, E., Markland, D. and Ingledew, D.K. (1997). A graded conceptualisation of self-determination in the regulation of exercise behaviour: Development of a measure using con® rmatory factor analytic procedures. Personality and Individual Diþ erences, 23, 745± 752. Pate, R.R. (1995). Physical activity and health: Dose response issues. Research Quarterly for Exercise and Sport, 66, 313± 318. Pelletier, L.G., Fortier, M.S., Vallerand, R.J., Tuson, K.M., Brière, N.M. and Blais, M.R. (1995). Toward a new measure of intrinsic motivation, extrinsic motivation, and amotivation in sports: The Sport Motivation Scale (SMS). Journal of Sport and Exercise Psychology, 17, 35± 53. Reynolds, W.M. (1982). Development of reliable and valid short forms of the Marlowe-Crowne social desirability scale. Journal of Clinical Psychology, 38, 119± 125. Ryan, R.M. (1995). Psychological needs and the facilitation of integrative processes. Journal of Personality, 63, 397± 427. Ryan, R.M. and Connell, J.P. (1989). Perceived locus of causality and internalisation: Examining reasons for acting in two domains. Journal of Personality and Social Psychology, 57, 749± 761. Satorra, A. and Bentler, P.M. (1988). Scaling corrections for chi-square statistics in covariance structure analysis. In Proceedings of the Business and Economics Sections, pp. 308± 313. Alexandria, VA: American Statistical Association. Satorra, A. and Bentler, P.M. (1994). Corrections to test statistic and standard errors in covariance structure analysis. In Analysis of Latent Variables in Developmental Research (edited by A. Van Eye and C.C. Clogg), pp. 399± 419. Newbury Park, CA: Sage. Scheier, M.F. and Carver, C.S. (1985). The selfconsciousness scale: A revised version for use with general populations. Journal of Applied Social Psychology, 15, 687± 699. Schmitt, N. and Stults, D.M. (1986). Methodology review: Analyses of multitrait-multimethod matrices. Applied Psychological Measurement, 10, 1± 22. Shavelson, R.J. (1988). Statistical Reasoning for the Behavioural Sciences. Boston, MA: Allyn & Bacon. Steiger, J.H. (1990). Structural model evaluation and modi® cation: An interval estimation approach. Multivariate Behavioural Research, 25, 173± 180. Tucker, L.R. and Lewis, C. (1973). A reliability coeý cient for maximum likelihood factor analysis. Psychometrika , 38, 1± 10.
The Exercise Causality Orientations Scale Vallerand, R.J. (1997). Toward a hierarchical model of intrinsic and extrinsic motivation. Advances in Experimental Social Psychology, 29, 271± 360. Vallerand, R.J., Pelletier, L.G., Blais, M.R., Brière, N.M., Senécal, C. and Vallières, E.F. (1992). The Academic Motivation Scale: A measure of intrinsic, extrinsic, and amotivation in education. Educational and Psychological Measurement, 52, 1003± 1019. Wallace, H.A. and Snedecor, G.W. (1931). Correlation and Machine Calculation. Ames, IA: Iowa State College. Wankel, L.M. (1985). Personal and situational factors aþ ecting exercise involvement: The importance of enjoyment. Research Quarterly for Exercise and Sport, 56, 275± 282. Wankel, L.M. (1993). The importance of enjoyment to adherence and psychological bene® ts from physical activity. International Journal of Sports Psychology, 24, 151± 169. Weissinger, E. and Bandalos, D.L. (1995). Development, reliability and validity of a scale to measure intrinsic motivation in leisure. Journal of Leisure Research, 27, 379± 400. Williams, G.C., Grow, V.M., Freedman, Z.R., Ryan, R.M. and Deci, E.L. (1996). Motivational predictors of weight loss and weight loss maintenance. Journal of Personality and Social Psychology, 70, 115± 126. Wothke, W. (1996). Models for multitrait-multimethod matrix analysis. In Advanced Structural Equation Modeling: Issues and Techniques (edited by G.A. Marcoulides and R.E. Schumacker), pp. 7± 56. Mahwah, NJ: Lawrence Erlbaum Associates. Yadama, G.N. and Pandey, S. (1995). Eþ ect of sample size on goodness-of-® t indices in structural equation models. Journal of Social Service Research, 20, 49± 70.
Appendix 1 The original nine scenarios and 27 items. The ® nal seven-scenario scale does not include scenarios 2 and 6. The subscale to which each item relates is shown in parentheses. 1. You are beginning a new exercise programme. You are likely to: (a) Attend a structured exercise class where an exercise leader is telling you what to do. (Control) (b) Attend a gym where you decide for yourself which exercises to complete. (Autonomy) (c) Tag along with your friends and do what they do. (Impersonal) 2. You are beginning a new exercise programme. You are likely to: (a) Feel interested in the new challenge and look forward to feeling its bene® ts. (Autonomy) (a) Look forward to losing weight, improving
461 your appearance, increasing your ® tness, etc. (Control) (c) Feel stressed and anxious about the new situation. (Impersonal) 3. You are asked to keep a record of all the weekly exercise you have completed in an exercise diary. You are likely to view the diary: (a) As a reminder of how incapable you are at ful® lling the task. (Impersonal) (b) As a way to measure your progress and to feel proud of your achievements. (Autonomy) (c) As a way of pressurizing yourself to exercise. (Control) 4. To monitor how well you are doing in an exercise programme, you are likely to want: (a) To be given a lot of praise and encouragement from others. (Control) (b) To evaluate your own performance and provide yourself with positive feedback. (Autonomy) (c) To just hope that what you are doing is correct. (Impersonal) 5. You have been exercising regularly for 6 months but recently you have been missing sessions and are ® nding it hard to get motivated to exercise. You are likely to: (a) Approach someone to help motivate you. (Control) (b) Ignore the problem, nothing can be done to improve your motivation. (Impersonal) (c) Employ your own strategies to motivate yourself. (Autonomy) 6. If you were going to see a ® tness instructor to get an exercise programme to follow, you would likely: (a) Want to be involved in making decisions about what goes in the programme. (Autonomy) (b) Want the programme to be devised the way it had been done in the past. (Impersonal) (c) Want to let the ® tness instructor decide what exercises you should do. (Control) 7. You have been told that setting goals is a good way to motivate yourself to exercise. You would likely: (a) Set your own realistic but challenging goals. (Autonomy) (b) Make someone important to you set goals for you to aim for. (Control) (c) Not set goals because you may not be able to live up to them. (Impersonal) 8. During a discussion with an exercise counsellor, he or she presents many options on the best way for
462 you to exercise to achieve ® tness and health bene® ts. It is likely that your ® rst thought would be: (a) What do you (the exercise leader) think I should do? (Control) (b) What do I think is the best option for me? (Autonomy) (c) What has everyone else done in the past? (Impersonal)
Rose et al. 9. During an exercise session, how hard you are working out is likely to be governed by: (a) The intensity you have been told to exercise at. (Control) (b) What everyone around you is doing. (Impersonal) (c) How you are feeling while exercising at the intensity you choose. (Autonomy)