May 29, 2009 - Development and tests of fast 1-MA linear transformer driver stages. A. A. Kim,1 M. G. Mazarakis,2 V. A. Sinebryukhov,1 B. M. Kovalchuk,1 V. A. ...
PHYSICAL REVIEW SPECIAL TOPICS - ACCELERATORS AND BEAMS 12, 050402 (2009)
Development and tests of fast 1-MA linear transformer driver stages A. A. Kim,1 M. G. Mazarakis,2 V. A. Sinebryukhov,1 B. M. Kovalchuk,1 V. A. Visir,1 S. N. Volkov,1 F. Bayol,3 A. N. Bastrikov,1 V. G. Durakov,1 S. V. Frolov,1 V. M. Alexeenko,1 D. H. McDaniel,2 W. E. Fowler,2 K. LeChien,2 C. Olson,2 W. A. Stygar,2 K. W. Struve,2 J. Porter,2 and R. M. Gilgenbach4 1
Institute of High Current Electronics, Russian Academy of Sciences, Tomsk 634055, Russia 2 Sandia National Laboratories, Albuquerque, New Mexico 87185, USA 3 International Technologies for High Pulsed Power, The´gra 46500, France 4 University of Michigan, Ann Arbor, Michigan 48109-2104, USA (Received 4 March 2009; published 29 May 2009)
In this article we present the design and test results of the most powerful, fast linear transformer driver (LTD) stage developed to date. This 1-MA LTD stage consists of 40 parallel RLC (resistor R, inductor L, and capacitor C) circuits called ‘‘bricks’’ that are triggered simultaneously; it is able to deliver �1 MA current pulse with a rise time of �100 ns into the �0:1-Ohm matched load. The electrical behavior of the stage can be predicted by using a simple RLC circuit, thus simplifying the designing of various LTD-based accelerators. Five 1-MA LTD stages assembled in series into a module have been successfully tested with both resistive and vacuum electron-beam diode loads. DOI: 10.1103/PhysRevSTAB.12.050402
PACS numbers: 29.20.D�, 84.30.Ng
I. INTRODUCTION The linear transformer driver (LTD) is a developing pulsed-power technology which shows promise for applications that require high-power, high-voltage, highcurrent, �100-ns output pulses. The LTD driver is an induction generator similar to the linear induction accelerator (LIA) [1,2], the inductive voltage adder (IVA) [3–6], and the linear pulsed transformer (LPT) [7]. All induction generators are based on Faraday’s law which states that the time-varying magnetic flux BðtÞ penetrating a loop generates at the ends of this loop a voltage difference UðtÞ equal to UðtÞ ¼ S
dB ; dt
(1)
where S is the cross section of the loop. In an induction generator normally the loop is realized as a pillbox-shaped toroid, which in this article is called ‘‘induction cavity.’’ This toroid has a continuous azimuthal gap, and the voltage UðtÞ appears across this gap. Since historically the first devices utilizing Faraday’s law were called ‘‘transformers,’’ all induction generators can also be considered as transformers. Hence, the induction cavity can be considered as the single-turn secondary winding of such a transformer. Its primary winding, which generates the azimuthal magnetic flux BðtÞ that penetrates the cavity, may have different designs. A LIA is composed of a series of identical induction cavities. When assembled, it has a cylindrical region on axis, referred to as the bore, which has a series of annular gaps regularly spaced on its inner cylindrical surface. This bore is threaded by a beam of propagating particles which gets accelerated as they drift through each of the cavity gaps. The voltage across a given gap appears in coincidence with the passage of the particles 1098-4402=09=12(5)=050402(10)
through the gap. Hence, the firing sequence of each LIA cavity is synchronized with the speed the particles propagate along the axis of the device. IVA is also formed by a series of identical induction cavities, but unlike in LIA, its bore is threaded by a center conductor that together with the cylindrical surface of the bore form an output line that connects to the load. The outstanding advantage of the IVA is that this line serves as a transmission line; i.e., the electromagnetic (EM) energy propagates along this line from each cavity towards the load only, without reflections. In an ideal IVA two fundamental principles must be satisfied: first, the firing of the successive cavities must be synchronized with the speed in which the EM wave propagates along the output line, and second, the wave impedance of the output line must gradually increase to be matched with the drive impedance of the upstream cavities. In an ideal IVA [excluding IVAs driving magnetic insulated transmission lines (MITLs)], the output voltage pulse across a matched load is independent of the number of cavities and is equal to the sum of all cavity pulses. LPT can be formed by one or a series of identical induction cavities. If it is one cavity only, it encloses several parallel primary windings that are triggered simultaneously. The gap of this cavity is located not on the inner surface of the toroid but on its side surface, and it must be insulated for the total output voltage. Since all primary windings are triggered simultaneously, the discharge circuit of the single-cavity LPT consists of the primary energy sources that are connected in series to the load through the inductance of the toroid. This inductance widens the output pulse, and therefore the output pulse of the single-cavity LPT is not the sum of the primary pulses applied to each primary winding. An IVA-type device consisting of several
050402-1
Ó 2009 The American Physical Society
A. A. KIM et al.
Phys. Rev. ST Accel. Beams 12, 050402 (2009)
induction cavities, where one or both of the above listed fundamental IVA principles are violated, is also an LPT in a sense that its output pulse is not a sum of the primary pulses. If any IVA principles are violated, the output line does not serve as a transmission line because the waves undergo multiple reflections; then the shape of the output pulse depends on the number of the cavities and on the width of the primary pulses. In particular, if the length of the primary pulses is much longer than the electrical length of the output line, this line serves as a series inductance, exactly in the same way as the inductance of the toroid in the single-cavity LPT. Similar to IVA and LPT, the LTD driver consists of several induction cavities called ‘‘LTD stages’’ plus the center electrode threading through the axis of the cavities. The main difference from LIA, IVA, and LPT induction cavities is that the LTD stage encloses the primary capacitive energy storage [8]. The LTDs have several important advantages that make this technology attractive for the next generation of pulsed-power systems: (i) Since the LTD stages enclose the primary storage, the LTD driver is more compact compared to other generators having similar output parameters. For example, the footprint of a 1-TW, 10 LTD cavity driver is only �8 m2 . (ii) As any other primary energy storage, the LTD driver is simple. As described below, an LTD stage consists mainly of only three different parts: a capacitor, a gas spark switch, and a ferromagnetic core. (iii) Since the LTD primary energy storage is enclosed inside the cavity, it is practical and convenient to be built with relatively small size capacitors, which necessarily have less capacitance C. But this turns to be an important advantage for LTDs since the small (10– 40 nF) capacitance becomes instrumental for directly generating short output pulses even if the inductance of each of the basic circuit (‘‘brick’’) may be relatively large ( � 250 nH). Each ‘‘brick,’’ described in detail in Sec. II, consists of two capacitors and one switch connected in series. A high-current LTD cavity encloses many such bricks connected in parallel to the load. (iv) Since the LTD driver consists of several individually triggerable stages, it can be operated in both LPT and IVA modes. All the above advantages of the LTD technology offer the capability [9–15] to build fast, 100-ns time-scale compact and simple high-power drivers without any intermediate power amplification stages. In Sec. II of this paper we describe the design of the most powerful, fast, 1-MA LTD stage developed to date. In addition, the LTD cavity electrical performance and experimental results are discussed and compared with numerical circuit code calculations. Some peculiarities related to the behavior of the ferromagnetic core, depending on the premagnetizing methods, are also presented and explained in detail. In Sec. III we present the design and test results of the five-stage 1-MA LTD module driving both resistive and electron-beam diode loads in the LPT mode.
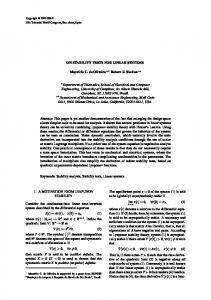
FIG. 1. (Color) Design of the 1-MA LTD stage showing two storage capacitors, the switch and the buses of the brick. Broken ellipse indicates the region of the load location and is presented in more detail in Fig. 2.
II. FAST 1-MA LTD STAGE The design of the 1-MA fast LTD stage is shown in Fig. 1. The stage induction cavity is a pillbox-shaped toroid with an azimuthal gap at the center of the inside cylindrical surface. This gap is fitted with a vacuum tight oil-vacuum interface. Inside the cavity is located the capacitor bank with the switches, charge and trigger resistors, and the ferromagnetic core. The outside diameter of the stage is �3 m, the length along the main axis �22 cm, and the weight filled with oil �2:5 tons. The capacitor bank is made of 80 storage capacitors type GA 35426 (40 nF, 100 kV) [16] that are arranged in 40 pairs. The capacitors in each pair are charged in opposite polarity up to �100 kV and switched into the load by closing the multispark gap switch type fast LTD [17]. The set of two capacitors, the switch, and the buses connecting the capacitors from one side with the switch and from the opposite side with the azimuthal gap is called brick and represents the basic element of the stage. All the bricks in the stage are connected in parallel and located evenly in a circular array around the axis. For safety reasons, the neighboring bricks are separated by �1 kOhm charging resistors both in the positive and negative charging circuits. The triggerable switches type fast LTD operate with dry air at a pressure of �4 ata (or 0.405 MPa) for �100 kV charging voltage. The DC voltage is distributed between several switch gaps with a corona discharge. Some features of these switches are described elsewhere [18–20]. They are triggered by � � 100 kV, �30 ns rise time pulses which enter into the stage via four 65-Ohms high-voltage cables. Inside the stage, these cables are connected to a 4mm diameter circular trigger wire located in a groove at the outer diameter of the insulator extension of the oil-vacuum interface. The trigger electrodes of the switches are connected to this wire through �500 Ohm resistors. In the tests of the single stage described below, the �2-m outer diameter ferromagnetic core had four separate rings, each ring being wound with a 80-�-thick, 18-mm-
050402-2
DEVELOPMENT AND TESTS OF FAST 1-MA LINEAR . . .
FIG. 2. (Color) Design of the load in tests of separate stage.
100 peak load power (GW)
wide ET3524 anisotropic iron tape sandwiched in a 12-�-thick, 22-mm-wide Mylar film insulation. The rings are molded into an epoxy compound to stabilize the turns and isolate the rings from each other. The magnetic induction at saturation of ET3425 iron is BS ¼ 2 T at H ¼ 30 kA=m, the residual induction is BR ¼ 1:2 T, the coercive force is HC ¼ 0:03 kA=m, and the specific resistance of the ET3425 iron is � ¼ 5 � 10�7 Ohm m. The total cross section of the iron in each ring is �14 cm2 . The volt-second integral of the entire core is VSAC � 22:4 mVs with active premagnetizing (�B ¼ 4 T) and VSPC � 18 mVs with passive premagnetizing (�B ¼ 3:2 T), where �B is the total variation of the induced magnetic field in the cores. The performance of the core depending on the premagnetizing methods is discussed in Appendix A. The high-voltage components inside the cavity are insulated from the walls of the cavity and from each other with dielectric polyethylene insulators (please see Fig. 1). The 1-cm-thick extension of the oil-vacuum interface isolates the capacitors and planar output lines (buses) of the bricks. The oil-vacuum interface is made from extruded acrylic. After assembly the induction cavity is filled with transformer oil for additional electrical isolation of the components. For the experimental tests of each individual 1-MA LTD stage, the resistive load was placed inside the cylindrical opening of the stage as shown in Fig. 2. Two concentric plastic polyethylene cylinders were inserted separating the stage’s inner cylindrical cavity into 2 sections. These sections were hermitically sealed up and down with two metallic conducting plates attached to the outer planar walls of the stage. 20 plastic rods were utilized to compress the ‘‘O’’ rings and establish electrical contact between the plates and the walls of the stage. The first of those two
Phys. Rev. ST Accel. Beams 12, 050402 (2009)
95 90 85 80 experiment
75 70 0.05
PSpice
0.1
0.15
0.2
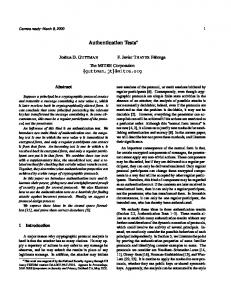
load resistance ( Ω ) FIG. 3. Peak load power dependence on the load resistance. The dots are the experimental results and are compared with PSPICE simulation (solid curve).
sections, which is closest to the oil-vacuum interface, was filled with oil to avoid flashing along the interface surface. The second cavity between the two cylindrical insulators was filled with NaCl-water solution and served as the resistive load of the stage. The inductance of such load, estimated from its geometry, was 1.05 nH. In these tests, the load current, I, was measured with two magnetic flux monitors (dB=dt) wound in opposite directions to produce opposite-polarity signals for electrical noise rejection and placed in the vicinity of the load. The load voltage U was measured with an external voltage divider, and the current around the core IC was measured with another magnetic flux monitor (dB=dt). The resistance of the load defined as R ¼ U=I was varied from �0:06 to �0:19 Ohm by changing the concentration of the NaCl solution. The core was premagnetized before the shot (passive premagnetizing, see Appendix A) by using the premagnetizing pulse generator (PPG). The PPG is essentially an LC circuit with an inductance L ¼ 20 �H and capacitance C ¼ 40 �F. It was charged to 2 kV. A diode was connected in parallel to the capacitor in order to eliminate oscillations of the PPG voltage across the core. Experiments were conducted with different resistive loads at �100 kV charging of the LTD capacitors. The obtained experimental results are summarized in Figs. 3–6 and are compared with PSPICE1 [21] simulations. Figure 3 indicates that the optimum output stage impedance [15], which maximizes the output power to �96 GW, is R � 0:1 Ohm. In this case, the load voltage (Fig. 4) is �100 kV and the power rise time (Fig. 5) is �90 ns. The simulation is in a reasonable agreement with experimental results; the only noticeable difference is the faster decrease of the energy delivered to the load for R > 0:1 Ohm as compared with the simulation prediction (Fig. 6). The energy is calculated according to equation 1
050402-3
PSPICE
is a registered trademark of MicroSim Corporation.
A. A. KIM et al.
Phys. Rev. ST Accel. Beams 12, 050402 (2009) 12
120
load energy (kJ)
110 100 90
experiment
80 70 0.05
11
10 experiment
PSpice
0.1
0.15
PSpice
9 0.05
0.2
load resistance ( Ω) FIG. 4. Peak load voltage dependence on the load resistance. The dots are the experimental results while the solid curve is the PSPICE simulation.
E¼
Z t0 0
UIdt;
(2)
where t0 is the time when the load voltage crosses zero for the first time. The experimentally observed energy E has a maximum of �11:3 kJ occurring for a load resistance R � 0:1 Ohm and is equal to �70% of the total stored energy in the capacitors. In PSPICE, the energy E also peaks close to R � 0:1 Ohm, but for larger load resistances does not decrease as fast as in the experiments. The cause of this difference will be discussed below. Figure 7 shows the recorded load voltage U and the current IC leaking around the core to the cavity walls for R ¼ 0:107 Ohm. At such load the volt-second integral VSLTD , calculated as Zt VSLTD � Udt; (3) 0
does not reach the
limit VSPC
¼ 18 mVs (please see Fig. 13
of Appendix A). The shape of the current IC is approximately the same as that of the voltage, indicating that the core in this shot behaved as a constant resistance RC ¼ U=IC . For a measured load voltage U � 100 kV and IC � 180 kA, the value of this resistance is estimated to be RC � 0:56 Ohm. Figure 8 presents similar traces as in Fig. 7, but now the results are obtained with an R � 0:188 Ohm. In this case the observed load voltage is higher and VSLTD exceeds VSPC ¼ 18 mVs after �200 ns. At that time, the current IC begins to rise again, confirming the saturation of the core. In spite of the higher load resistance, the voltage reversal here is larger than that of Fig. 7 because the inductance of the loop around the core, connected in parallel to the load, becomes very small and acts practically as a short. The performance of the core depending on the premagnetizing methods was studied at R ¼ 0:166 Ohm (Fig. 9). With this load and passive premagnetizing the core satu120 load voltage U (kV)
power rise time (ns)
95 90 85 80 experiment
70 0.05
PSpice
180 U
100
Ic
120
60
90
40
60
20
30
0
R=0.107 Ohm
-20 0.15
0.2
load resistance ( Ω ) FIG. 5. Power rise time dependence on the load resistance. The experimental data points are compared with the PSPICE numerical simulation (solid curve).
150
80
0 0.1
0.2
FIG. 6. Energy delivered to the load during the main pulse as a function of the load resistance. The experimental results (dots) are compared with the PSPICE simulation (solid curve).
100
75
0.1 0.15 load resistance (Ω )
200 400 time (ns)
current IC (kA)
peak load voltage (kV)
130
0 -30 600
FIG. 7. (Color) Load voltage U and current around the core IC at R ¼ 0:107 Ohm. The volt-second integral VSLTD does not reach the maximum of VSPC ¼ 18 mVs. The current IC is approximately proportional to the voltage U.
050402-4
DEVELOPMENT AND TESTS OF FAST 1-MA LINEAR . . .
Phys. Rev. ST Accel. Beams 12, 050402 (2009)
FIG. 10. Equivalent electrical circuit of a fast LTD stage.
FIG. 8. (Color) Same traces as in Fig. 7 but with a different R ¼ 0:188 Ohm. Because of higher voltage U the volt-second integral VSU exceeds the limit VSPC ¼ 18 mVs at �200 ns in the pulse. At that time the current IC begins to rise again, indicating saturation of the core.
rates at �200 ns when VSLTD reaches VSPC ¼ 18 mVs. The energy loss in the core is �3:6 kJ. At active premagnetizing the volt-second integral VSLTD reaches again the value of 18 mVs at the same time, but now it does not reach the maximum available value of VSAC ¼ 22:4 mVs. In this case, since the core does not saturate the energy losses are smaller and equal to 3.3 kJ, a decrease of 300 J. When the core is saturated from the very beginning, the current around the core is similar to the current through an inductor (e.g. it peaks at approximately the same time as the voltage crosses zero). The current exceeds 800 kA, the load voltage amplitude decreases by �10%, the total length of the pulse
decreases from �350 ns to �200 ns, and the energy loss by the time the voltage crosses zero increases to almost �6 kJ. Assuming that all switches close simultaneously and the cores do not saturate, the discharge of an LTD stage can be represented by a simple equivalent RLC (resistor R, inductor L, and capacitor C) circuit (Fig. 10). Here C is the total storage capacitance of all the bricks connected in parallel; R1 is the resistance of the capacitors and the switches, L1 is the total inductance of the bricks, and L2 and R are the inductance and the resistance of the load. The resistance RC simulates the LTD core before it saturates. For slow pulses, the core behaves as a variable inductor L� , which is proportional to magnetic permeability of the core material � ¼ dB=dH. In this case the circuit in Fig. 10 should include L� in parallel to the load instead of the RC . The energy loss in the core would be defined by the surface area inside the static hysteresis loop B ¼ fðHÞ. The volume of the 1-MA LTD core is W � 0:036 m3 , then for the parameters of the ET3425 iron, the energy loss in L� at maximum possible �B ¼ 2BS is E � Wð2HC Þ � ð2BS Þ < 20 J. (Please see Fig. 13) If the voltage pulse applied to the conductive core is fast enough, it generates eddy current in the core material. The value of this current is defined by the driving voltage and the resistance of the layer which carries eddy current, RC . However, to be precise even for the fast pulses, the circuit of Fig. 10 should include L� in parallel with the resistance RC . Generally speaking, the resistance RC is also variable since it reflects the dynamics of eddy current penetration into the core iron. Though the physics of this penetration is clearly the same as that of the skin depth, the exact expression of RC for the given shape of the voltage pulse is rather complicated. For engineering purposes, the resistance RC can be calculated assuming [as in Ref. [22]] that the static hysteresis curve and the voltage pulse are rectangular or [as in Ref. [23]] that dB=dt is approximately constant everywhere throughout the tape. Both approaches result in a constant value given by RC ¼ k
FIG. 9. (Color) Load voltage U and current around the core IC at R ¼ 0:166 Ohm depending on the premagnetizing method.
�S ; �2 ‘
(4)
where � is the specific resistance of the core iron, S the total cross section of the iron in the core, ‘ the length of the core, and � the thickness of the iron tape. The dimensionless coefficient k is found to be 8 in [22], and to be 12 in [23]. The dominant branch among L� and RC can be
050402-5
A. A. KIM et al.
Phys. Rev. ST Accel. Beams 12, 050402 (2009)
evaluated by comparing the total current IC ðtÞ flowing around the core with the voltage across the load UðtÞ (which is approximately the same as the voltage across L� and RC ). As discussed above, the traces in Fig. 9 indicate that if the core is not saturated the current IC ðtÞ is almost proportional to the voltage UðtÞ, i.e., in the unsaturated core the resistance RC ( � 0:56 Ohm) dominates. This value is rather close to RC � 0:7 Ohm calculated from the Eq. (4) with � ¼ 80 �, S ¼ 56 cm3 , � ¼ 5 � 10�7 Ohm m, ‘ ¼ 6 m, and k � 10. For a sinusoidal voltage pulse with the peak amplitude of �100 kV, the energy loss during the first quarter period T=2 ( � 350 ns) in a core resistance RC � 0:6–0:7 Ohm is 2.5–3 kJ, which is much higher than the maximum possible energy loss in L� ( < 20 J). Therefore the inductance L� in the circuit of Fig. 10 is neglected. (Note that when the core saturates, the value of � drastically decreases and the circuit should include the greatly reduced L� rather than the RC . (See the voltage and current traces for the saturated core case of Fig. 9). The best fits of the experimental data with the PSPICE code simulations are presented in Figs. 3–6. They were obtained using the circuit of Fig. 10 with UCH ¼ 200 kV, C ¼ 800 nF, R1 ¼ 0:0165 Ohm, RC ¼ 0:65 Ohm, L1 ¼ 6 nH, and L2 ¼ 1:05 nH. These values are the total equivalent capacitance, inductance, and resistance of all of the 40 bricks of the 1-MA LTD stage. Here the inductance and resistance of the brick is assumed to be 240 nH and 0.66 Ohm, respectively. Since the simulated curves in Figs. 3–5 are quite close to the experimental data, we can conclude that the jitter of the 40 switches is at least much less than the rise time of the output pulse. The difference between the simulated and observed energy delivered to the load for R > 0:1 Ohm (Fig. 6) seems to be the result of saturation of the core, which is not taken into account by the simple RLC circuit of Fig. 10. For example, at R ¼ 0:166 Ohm (Fig. 9) the saturation of the core at passive premagnetizing increases the energy loss in the core by �0:3 kJ. If this increase is subtracted from the simulated energy E ¼ 11:3 kJ of Fig. 6, the energy delivered to the load becomes E � 11 kJ, which is much closer to what was measured in the experiment. Note that, for the circuit in Fig. 10, the optimum load impedance providing the maximum output power can be calculated from the expression: � � � � L R� Ropt ¼ R� 1 � 0:73 1 � 0:66 2 ; L1 RC
(5)
where sffiffiffiffiffiffiffiffiffiffiffiffiffiffiffiffiffiffi L þ L2 R� ¼ 1:1 1 þ 0:8R1 C
(6)
is the optimum load impedance for the case RC ! 1 [15]. Equation (5) is correct to within �1% whenever
R1 pffiffiffiffiffiffiffiffiffiffiffiffiffiffiffiffiffi ffi < 0:5, ðL1 þL2 Þ=C
Ropt RC
� 0:2, and
L2 L1
� 0:3. A derivation of
this expression is given in Appendix B. The experimental results presented above were obtained with the first prototype 1-MA LTD stage. The loss current around the core when the stage operates at almost peak power is �180 kA, which is �19% of the load current I ¼ U=R � 935 kA (see Fig. 8). In order to reduce these energy losses, the additional four 1-MA LTD stages utilized in the present work were built with finer lamination and larger cross section cores. Namely, the cores were fabricated with 50-�-thick tape, and the iron cross section was increased from �56 cm2 to �64 cm2 . According to expression (4), such changes would increase the resistance RC from �0:7 Ohm to �2 Ohm [24]. The measured resistance RC of such cores was �1:5 Ohms. Other possible ways to improve the efficiency of the stage is to fabricate the core from Metglas, which is more expensive but has a resistivity �2:5 times higher than ET3425 iron and/or use finer lamination core tape. III. FIVE-STAGE 1-MA LTD MODULE Five 1-MA LTD stages were assembled in series into a module and tested with resistive and electron-beam diode (e-beam diode) loads [25]. In both experiments all the stages were triggered simultaneously, so the LTD module was operated in a LPT mode. The design of the module with the electron-beam diode load is shown in Fig. 11. The straight cathode stalk has a 757.5-mm radius and is cantilevered. The left side is mounted on the ground flange of the module, while the right freestanding end holds the ring-shaped planar cathode electrode of the diode. The radial anode-cathode gap around the cathode stalk is 63.5 mm. The peak electric field on the cathode stalk at �400 kV is �65 kV=cm, which is well below the vacuum emission threshold of �200 kV=cm. So the coaxial output vacuum line formed by the five-stage LTD module and the central cathode stalk was designed to operate in the vacuum insulated regime and not in a magnetic insulated transmission line (MITL) regime. The geometric inductance of the coaxial line is �18 nH. The planar vacuum e-beam diode has a cathode surface area of �2900 cm2 and an anode-cathode (A-K) gap of 1– 2 cm. The A-K is varied by changing the length of the small cylinders which support the annular anode plate. The front surface of the cathode electrode is covered with velvet cloth to facilitate electron emission since the electric field at the cathode was quite low. The diagnostics include two sets of magnetic flux monitors (dB=dt), B1 and B2. The two B1 probes (wound in opposite directions relative to each other) are located on the left grounded flange of the module vacuum chamber and when integrated give the total current ICS flowing through the module from the left ground flange to the anode right flange. If there are
050402-6
DEVELOPMENT AND TESTS OF FAST 1-MA LINEAR . . .
Phys. Rev. ST Accel. Beams 12, 050402 (2009)
FIG. 11. (Color) Design of the five-stage LTD module with e-beam diode load. The cores of the stages were premagnetized before each shot without opening the module to the atmosphere; the PPG pulse was applied to the right end of the center rod that was disconnected from the grounded body of the module by removing the soft Cu contact.
no current leaks from the cathode stalk, this current is the sum of the diode current ID and the current flowing through the center rod ICR which shunts the diode with an inductance of �1085 nH. The signals of the two B2 probes (also wound in opposite directions) when integrated provide the current ICR and the diode current ID ¼ ICS � ICR and, when multiplied with the rod inductance, give the diode voltage UD ¼ LðdICR =dtÞ. The center rod serves two purposes: it allows measuring the diode voltage when connected to the right side anode flange, and it also allows premagnetizing the module cores when connected to the premagnetizing power supply (PPG). The design provides the capability to disconnect it between shots from the grounded body of the module for passive premagnetizing of the LTD cores without opening the module chamber to the atmosphere (please see blowup inset in Fig. 11). The overall design of the five-stage LTD module with the resistive load was the same as in Fig. 11. However, the cathode stalk and the cathode and anode rings were replaced now by a resistive load assembly consisting of 30 separate resistors made from 4.4-cm diameter, 36-cm long polyethylene tubes filled with KBr water solution. The resistors were mounted at the ends of 3-cm diameter, 67cm long aluminum rods arranged evenly in a cylindrical array surrounding the axis of the module at a radius of 76.5 cm. Current shunts in series with the resistors were
used to measure the current flowing in the KBr resistors and the voltage across the load. The entire inner volume of the module containing the KBr resistors assembly was filled with SF6 at atmospheric pressure. Below we present experimental results and numerical simulations for the diode load experiments only. Figure 12 shows the diode voltage UD (in green) and current ID (in blue) traces for five-stage LTD assembly charged to UCH ¼ �90 kV and a diode A-K gap of 1.4 cm. In black and red are the diode voltage and current traces simulated with PSPICE for the same charging and diode parameters. The voltage reaches the maximum value of �400 kV at �100 ns. At the same time the current peaks at �800 kA, while the electron-beam power becomes �320 GW. Since all the stages were triggered simultaneously, the module was simulated in PSPICE as a linear pulsed transformer (LPT). The utilized PSPICE equivalent circuit was composed of five RLC circuits connected in series to the diode load through the 18-nH inductance of the transformer output line. The center rod was connected in parallel to the diode, which according to the geometry of Fig. 11 was simulated as two transmission lines connected in series; the first had a 204 Ohm impedance and 3.86 ns transmission time length and the second had 100 Ohm impedance and 2.96 ns length, which give a total equivalent inductance of �1085 nH. One of the five RLC circuits was
050402-7
A. A. KIM et al.
Phys. Rev. ST Accel. Beams 12, 050402 (2009) IV. CONCLUSION
FIG. 12. (Color) Experimental results and PSPICE simulations. The diode voltage UD for clarity of presentation is inverted (negative). The simulations were done for UCH ¼ �90 kV and an emitting cathode area A ¼ 2100 cm2 . The cathode emitting surface was assumed to be moving towards the anode at a constant velocity V ¼ 2 � 106 cm=s, simulating the expansion of the cathode plasma.
exactly the same as that presented in Fig. 10 with RC ¼ 0:65 Ohm. The other four circuits have a core resistance RC � 2:9 times larger and equal to 1.9 Ohm because the remaining four stages have been built with finer lamination cores of 50-�-thick iron tape and increased �64-cm2 cross section. The diode was simulated as a nonrelativistic planar diode with space charge limited electron emission, where the current is defined by ID ¼ PðUD Þ3=2
where P ¼ 2:335 � 10�6
A : dðtÞ2
ACKNOWLEDGMENTS The authors are deeply indebted to their colleagues at the High Current Electronic Institute at Tomsk, Russia, Sandia National Laboratories at Albuquerque, New Mexico, and the International Technologies for High Pulsed Power, Hameau de Drele, The´gra, France. Sandia is a multiprogram laboratory operated by Sandia Corporation, a Lockheed Martin Company, for the U.S. Department of Energy under Contract No. DE-AC04-94AL85000.
(7) APPENDIX A: PREMAGNETIZING OF THE CORE
Here A is the cathode emitting area. The A-K gap dðtÞ was assumed decreasing with time according to the expression dðtÞ ¼ d0 � Vt
In the present work we have shown that fast LTD stages can be built with as many as 40 separate bricks. The optimum load resistance of this stage is �0:1 Ohm. The power pulse delivered to such a load has a �100 GW peak value and a rise time of �100 ns. The electrical behavior of the stage can be predicted by using a simple RLC circuit, which confirms that the jitter of the switches is small compared to the rise time of the output pulse. This greatly simplifies the design of various LTD-based accelerators. The stages can be assembled in series into a module and used as a high-voltage, high-power driver for various applications. The most powerful LTD module consisting of five 1-MA LTD stages was tested with resistive and e-beam diode loads in LPT mode. The experimental results are in excellent agreement with numerical simulations. Experiments with a 1 TW module, which includes 10, 1MA LTD stages connected in series, are in preparation at Sandia National Laboratory, Albuquerque, USA. This LTD module will be the first ever IVA built with a transmission line insulated with deionized water. All ten LTD stages were designed and manufactured at the High Current Electronic Institute (HCEI) in Tomsk, Russia, and transferred to Sandia. Results of this work will be presented in future publications.
(8)
due to cathode plasma expansion at a constant velocity V ¼ 2 � 106 cm=s. The initial gap was assumed 1.4 cm. It was allowed to decrease to 0.02 cm and then was kept constant. To fit the experimental data during the main pulse, the cathode emitting area was assumed to be A ¼ 2100 cm2 , which is �70% of the geometrical surface area of the cathode. In the tests with the e-beam diode, the five-stage module was operated at charge voltage between �80 to �90 kV and a number of AK gap settings varying from 1.0 to 1.7 cm. During the resistive load experiments we fired a total of 500 shots; 300 of them were at �100 kV charging.
When the LTD and/or PPG pulse are applied to the single-turn winding of the core, which is made up by the PPG input and the cavity walls, the magnetic induction B in the core iron varies according to Faraday’s law, 1 Zt 1 Zt B¼ ULTD dt þ B0 ; or B ¼ U dt þ B0 ; S 0 S 0 PPG (A1) where B0 is the initial induction at t ¼ 0, S is the cross section of iron in the core, ULTD and UPPG are the LTD and PPG voltage pulses, respectively. The units of the parameters are in the SI system. If, for example, we assume that the LTD pulse is positive so that it moves the induction along the hysteresis curve in the þBS direction (please see Fig. 13), the PPG pulse (at either passive or active premagnetizing) must be negative to move the induction back
050402-8
DEVELOPMENT AND TESTS OF FAST 1-MA LINEAR . . .
Phys. Rev. ST Accel. Beams 12, 050402 (2009)
schematically illustrated in Fig. 13. The blue arrows indicate the path from point P to point S followed by the magnetic induction of the core during the LTD pulse when the LTD is triggered after the PPG pulse (passive premagnetizing). The red arrows indicate the path from point A to point S taken by the core during the LTD pulse when the LTD is triggered at peak PPG current. At that time the induction of the core is at B0 � �BS (active premagnetizing). FIG. 13. (Color) Variation of the core induction depending on the LTD firing time relative to the premagnetizing pulse. Blue arrows describe the core behavior if the LTD stage is fired later than the end of the PPG pulse (passive premagnetizing), while the red arrows present the case where the LTD is fired at peak PPG current (active premagnetizing).
down to negative saturation �BS . The core saturates when the value of B in Eq. (A1) reaches BS with the LTD pulse and �BS with the PPG pulse, where BS ¼ 2:0 T is the induction at saturation of ET3425 iron. The difference between the passive and active premagnetizing is the value of the initial induction B0 at the time the LTD is fired. At passive premagnetizing the LTD pulse is applied after the end of the PPG pulse. In this case the induction reaches �BS during the PPG pulse and relaxes to �BR after the end of the pulse. Then for the LTD pulse the initial induction is B0 ¼ �BR , and the core will not saturate before the voltsecond integral VSLTD reaches the limit Zt VSLTD ¼ ULTD dt ¼ SðBS þ BR Þ � VSPC : (A2) 0
The tested 1-MA LTD stage had a core with S � 56 � 10�4 m2 , BS ¼ 2 T, and BR ¼ 1:2 T. Equation (A2) then gives VSPC � 18 mVs. Passive premagnetizing is the standard method used in modern IVAs. The induction at saturation BS ( ¼ 2:0 T) of the ET3425 iron is sufficiently higher than the residual induction BR ( ¼ 1:2 T). This allows an increase of the volt-second integral VSLTD to a higher than VSPC � 18 mVs value if active premagnetizing is used. At active premagnetizing, the LTD is triggered at the time when the PPG voltage pulse saturates the core in opposite polarity. At that time the PPG current reaches maximum. For the LTD pulse the initial induction then is B0 � �BS , and the core does not saturate before the volt-second integral VSLTD reaches the maximum value of Zt ULTD dt ¼ SðBS þ BS Þ � VSAC ; (A3) VSLTD ¼
APPENDIX B: OPTIMUM LOAD IMPEDANCE OF AN LTD STAGE Derivation of Eq. (5) We estimate here the optimum load impedance Ropt of the LTD circuit presented in Fig. 10. Reference [15] finds that when RC ! 1 and L2 =L1 ¼ 0, the optimum load impedance is given by the following expression: sffiffiffiffiffiffiffiffiffiffiffiffiffiffiffiffiffiffi L þ L2 � R ¼ 1:1 1 þ 0:8R1 : (B1) C Reference [26] finds that when RC is finite and L2 =L1 ¼ 0, the optimum load impedance is given by the following: � � R� 0 � R opt ¼ R 1 � 0:73 : (B2) RC We estimate here the optimum load impedance Ropt when RC is finite and L2 =L1 Þ 0. We use dimensional analysis to observe that it may be possible to express the ratio Ropt =R0 opt as a function only of the ratios R0 opt =RC and L2 =L1 : � 0 � Ropt R opt L2 ¼ f ; : (B3) R0 opt RC L1 We calculated Ropt =R0 opt numerically at several values of R opt =RC and L2 =L1 . We find that to a reasonable approximation � � � � L R� Ropt ¼ R� 1 � 0:73 1 � 0:66 2 : (B4) L1 RC 0
When L2 =L1 ¼ 0, Eq. (B4) becomes identical to Eq. (B2), which is developed in Ref. [26]. When L2 =L1 ¼ 0 and R0opt =Rc ¼ 0, Eq. (B4) becomes identical to Eq. (B1), which is developed in Ref. [15]. Equation (B4) is correct to �1% whenever
0
which is �22:4 mVs for the core of the tested 1-MA LTD stage. Active premagnetizing is used in IVAs utilizing Blumlein as a source driving individual cavities [3]. The variation of the induction in the core iron during the LTD pulse, depending on the premagnetizing method, is 050402-9
R1 pffiffiffiffiffiffiffiffiffiffiffiffiffiffiffiffiffiffiffiffiffiffiffiffiffiffiffi < 0:5; ðL1 þ L2 Þ=C
(B5)
R� � 0:2; RC
(B6)
L2 � 0:3: L1
(B7)
A. A. KIM et al.
Phys. Rev. ST Accel. Beams 12, 050402 (2009)
[1] N. C. Christofilos, R. E. Hester, W. A. S. Lamb, D. D. Reagan, and W. A. Sherwood, Rev. Sci. Instrum. 35, 886 (1964). [2] A. I. Anatsky, O. O. Bogdanov, P. V. Bukaev, and Ju. P. Vahrushin, Atomnaya Energia 21, 439 (1966). [3] I. D. Smith, Phys. Rev. ST Accel. Beams 7, 064801 (2004). [4] M. G. Mazarakis, J. W. Poukey, S. L. Shope, C. A. Frost, B. N. Turman, J. J. Ramirez, K. R. Prestwich, and P. J. Pankuch, in Proceedings of the 8th IEEE International Pulsed Power Conference, edited by R. White and K. Prestwich (IEEE, Piscataway, NJ, 1991), p. 86. [5] M. G. Mazarakis, J. W. Poukey, D. Rovang, S. Cordova, P. Pankuch, R. Wavrik, D. L. Smith, J. E. Maenchen, L. Bennett, K. Shimp, and K. Law, in Proceedings of Space Charge Dominated Beams and Applications of High Brightness Beams, edited by S. Y. Lee (Indiana University, Bloomington, IN, 1995), p. 479. [6] M. G. Mazarakis, J. W. Poukey, D. C. Rovang, J. E. Maenchen, S. R. Cordova, P. R. Menge, R. Pepping, L. Bennett, K. Mikkelson, D. L. Smith, J. Halbleib, W. A. Stygar, and D. R. Welch, Appl. Phys. Lett. 70, 832 (1997). [7] G. A. Mesyats, in Proceedings of the 2nd IEEE International Pulsed Power Conference, edited by A. H. Guenther and M. Kristiansen (IEEE, Piscataway, NJ, 1979), p. 9. [8] B. M. Kovalchuk, V. A. Vizir, A. A. Kim, E. V. Kumpyak, S. V. Loginov, A. N. Bastrikov, V. V. Chervjakov, N. V. Tsou, Ph. Monjaux, and D. Huet, Russ. Phys. J. 40, 1142 (1997). [9] A. A. Kim (unpublished). [10] M. G. Mazarakis and R. B. Spielman, in Proceedings of the 12th IEEE International Pulsed Power Conference, edited by C. Stallings and H. Kirbie (IEEE, Piscataway, NJ, 1999), p. 412. [11] A. A. Kim and B. M. Kovalchuk, in Proceedings of the 12th Symposium on High Current Electronics, edited by G. Mesyats, B. Kovalchuk, and G. Remnev (Tomsk Polytechnic University and Institute of High Current Electronics SD RAS, Tomsk, Russia, 2000), p. 263. [12] M. G. Mazarakis and R. B. Spielman, in Proceedings of the 20th International Linac Conference (Stanford Linear Accelerator Center, Stanford, CA, 2000), p. 497 (Stanford Linear Accelerator Center Report No. SLAC-R-561, edited by A. W. Chao). [13] M. G. Mazarakis, R. B. Spielman, K. W. Struve, and F. W. Long, in Proceedings of the 13th IEEE International Pulsed Power Conference, edited by R. Reinovsky and M. Newton (IEEE, Piscataway, NJ, 2001), p. 587. [14] M. G. Mazarakis and K. W. Struve, Sandia National Laboratories Report No. SAND2006-5811, 2006.
[15] W. A. Stygar, M. E. Cuneo, D. I. Headley, H. C. Ives, R. J. Leeper, M. G. Mazarakis, C. L. Olson, J. L. Porter, T. C. Wagoner, and J. R. Woodworth, Phys. Rev. ST Accel. Beams 10, 030401 (2007). [16] Capacitor Model GA 35426, designed and manufactured especially for the fast LTD by General Atomics Electronic Systems, 4949 Greencraig Lane, San Diego, CA 92123, www.gaep.com. [17] These switches were designed and manufactured by the Institute of High-Current Electronics in Tomsk, Russia, especially for the fast LTD stages. [18] A. A. Kim, V. G. Durakov, S. N. Volkov, A. N. Bastrikov, B. M. Kovalchuk, V. A. Sinebryukhov, S. V. Frolov, V. M. Alexeenko, L. Veron, M. Toury, C. Vermare, R. Nicolas, F. Bayol, and C. Drouilly, in Proceedings of the 14th Symposium on High Current Electronics, edited by B. Kovalchuk and G. Remnev (Institute of High Current Electronics SD RAS, Tomsk, Russia, 2006), p. 297. [19] K. Hahn, J. R. Woodworth, W. T. Clark, J. R. Blickem, R. Starbird, M. J. Hardin, and Y. Maron, in Proceedings of the 16th IEEE International Pulsed Power Conference, edited by E. Schamiloglu and F. Peterkin (IEEE, Piscataway, NJ, 2007), p. 125. [20] V. A. Sinebryukhov, A. A. Kim, B. M. Kovalchuk, S. V. Frolov, V. M. Alexeenko, and S. N. Volkov, in Proceedings of the 12th International Conference on Megagauss Magnetic Field and Related Topics, Novosibirsk, 2008 (to be published). [21] MicroSim Schematics, Version 6.1b—November 1994. MicroSim Corporation, 20 Fairbanks, Irvine, California 92718, USA. [22] V. A. Vizir, A. D. Maksimenko, V. I. Manylov, and G. V. Smorudov, in Proceedings of the 13th Symposium on High Current Electronics, edited by B. Kovalchuk and G. Remnev (Institute of High Current Electronics SD RAS, Tomsk, Russia, 2004), p. 198. [23] S. S. Vdovin, Design of the Pulsed Transformers (Energia Publishing House, Leningrad, 1971), p. 66 (in Russian). [24] F. Bayol (private communication). [25] A. Kim, V. Sinebryukhov, B. Kovalchuk, A. Bastrikov, V. Durakov, S. Volkov, S. Frolov, V. Alexeenko, M. Mazarakis, D. McDaniel, C. Olson, K. Struve, and R. Gilgenbach, in Proceedings of the 16th IEEE International Pulsed Power Conference, edited by E. Schamiloglu and F. Peterkin (IEEE, Piscataway, NJ, 2007), p. 144. [26] W. A. Stygar, W. E. Fowler, K. R. LeChien, F. W. Long, M. G. Mazarakis, G. R. McKee, J. L. McKenney, J. L. Porter, M. E. Savage, B. S. Stoltzfus, D. M. Van De Valde, and J. R. Woodworth, Phys. Rev. ST Accel. Beams 12, 030402 (2009).
050402-10