Jan 9, 2009 - amount of data is sent back to a server at Stanford via FTP at specified ..... Perth Observatory for hosting the experiment at Perth, and. M. Karjala ...
IEEE TRANSACTIONS ON GEOSCIENCE AND REMOTE SENSING, VOL. 46, NO. 11, NOVEMBER 2008
3885
Fast Photometric Imaging Using Orthogonal Linear Arrays Robert Marshall, Student Member, IEEE, Robert Newsome, Student Member, IEEE, and Umran Inan, Fellow, IEEE
Abstract—A new optical instrument has been developed that captures 2-D images at high speed and high sensitivity using 1-D photomultiplier tube arrays. The arrays are orthogonally aligned, and using a coaligned video-speed imager, fast images can be reconstructed using matrix inversion techniques. The instrument can be used to make measurements of optical signatures of energetic electron precipitation induced by discrete waves (e.g., lightning discharges and very-low-frequency transmitter pulses), as well as measurements of high-speed high-altitude glow discharges in the upper atmosphere known as sprites, halos, and elves. In this paper, we introduce the instrument and present some first results of sprites and elves, and we discuss how the instrument can improve upon current observations in other experiments. Index Terms—Ionosphere, photomultipliers.
lightning,
photodetectors,
I. I NTRODUCTION
H
IGH-SPEED imaging at low light levels has advanced with great leaps in the past few years, with cameras capable of recording below the naked-eye threshold at frame rates of up to 10 000 frames per second (fps) and at megapixel resolution [1]. However, these systems still cannot image at very low light levels at high frame rates, and their use for continuous imaging is limited by the short buffers (often less than 1 s) due to the high data volume and finite readout time. A number of scientific applications require low-light-level imaging with a higher frame rate than what charge-coupled device (CCD) cameras can currently provide. The particular topics of interest to us here are imaging of optical signatures of precipitation of electron radiation in the ionosphere [2], imaging of high-frequency (HF) heater-induced F-region airglow [3], and imaging of transient luminous events such as sprites, jets, and elves [4]–[6]. The former requires very-lowlight imaging, as the expected emissions are on the order of 108 photons/cm2 /str/s (100 R) or lower, but does not require great resolution as the emissions are expected to have little structure over kilometer scales, nor does it require time resolution better than a few samples per second. However, crude determination (on ∼10-km scales) of lateral and altitude exManuscript received February 6, 2008; revised April 25, 2008. Current version published October 30, 2008. This work was supported by the Office of Naval Research under Grant N00014-03-1-0333, Grant N00014-05-1-0854, and Grant N00014-06-1-1036. The work of R. Marshall was supported by a Stanford University Gerald R. Lieberman Fellowship. The work of R. Newsome was supported by a Texas Instruments Stanford Graduate Fellowship. The authors are with the Space, Telecommunications and Radioscience Laboratory, Stanford University, Stanford, CA 94305 USA (e-mail: ram80@ stanford.edu). Color versions of one or more of the figures in this paper are available online at http://ieeexplore.ieee.org. Digital Object Identifier 10.1109/TGRS.2008.2000824
tensions and the variation therein is important from the point of view of understanding the physics of wave–particle interactions that lead to such precipitation events. The imaging of heater-induced airglow in the F-region ionosphere requires high sensitivity, as the emissions can be as low as a few rayleighs (106 photons/cm2 /str/s) but are typically from tens to hundreds of rayleighs [3]. Due to these low light levels, camera images require long integrations, typically ∼30 s, although recent developments in CCD imaging have lowered the integration time to a few seconds. However, the temporal development of emission regions in the ionosphere likely develop faster than this, and imaging (albeit with crude spatial resolution) at photomultiplier tube (PMT) sensitivities would allow the observation of such dynamics. Conversely, the imaging of sprites requires high time resolution (∼10 000 fps) and spatial resolution but at reasonable light levels, perhaps as high as 1015 photons/cm2 /str/s (1 GR) or even higher [7]. However, even light levels of 1 GR sometimes require intensification at 10 000 fps, introducing phosphor persistence effects, wavelength limitations, and further instrument complications. Most importantly, extremely limited buffer lengths prohibit continuous observations, allowing only triggerbased measurements. With these restrictions in mind, we introduce a new instrument designed to take measurements of all three of the above phenomena. This instrument, known as Photometric Imaging of Precipitation of Electron Radiation (PIPER), combines high sensitivity (noise level of ∼1 R at 100 fps), high time resolution (up to 25 000 fps), and continuous recording (no buffering) with relatively limited spatial resolution (16 × 16 pixels). Furthermore, the instrument can simultaneously image at multiple wavelengths or bands, using either narrow-band optical interference filters or broadband filters. II. PIPER I NSTRUMENT The PIPER instrument aims to combine high speed, high sensitivity, and continuous recording with some spatial resolution in a single imaging instrument. The heart of the instrument consists of two or more Hamamatsu R5900U-L16-20 PMT arrays, combined in pairs. Using pairs of rotated multianode PMTs, their 1-D spatial resolutions can be combined and reconstructed into 2-D images; the reconstruction procedure is described in detail in [8]. The software that controls the instrument runs entirely in Windows and is easily remotely operated through an Internet port. We use Windows Remote Desktop through a virtual private network for security. Controllable features include
0196-2892/$25.00 © 2008 IEEE
Authorized licensed use limited to: IEEE Xplore. Downloaded on January 9, 2009 at 16:40 from IEEE Xplore. Restrictions apply.
3886
IEEE TRANSACTIONS ON GEOSCIENCE AND REMOTE SENSING, VOL. 46, NO. 11, NOVEMBER 2008
Fig. 1. PIPER and its main components. (a) Complete instrument as viewed from the front. (b) One of the four electronic filter cards that reside inside the box. (c) Power supply card. (d) View inside front, showing shutters and lenses. (e) View inside back, showing wiring and power supply card. Filter cards are stacked under the power supply card.
pointing, power, and all recording parameters, including the schedule, the sampling frequency, and so forth. Fig. 1 shows the instrument and some of its constituent parts. The various features of the PIPER instrument are discussed in the sections below and its functional block diagram is shown in Fig. 2. A. Optics and Photometers The instrument primarily consists of four 16-channel multianode PMT arrays, Hamamatsu part number R5900U-L1620. These are the same PMTs used in [9] for sprite and elve observations. These PMTs have a response from 185 to 900 nm, covering the extended red emissions in the N2 first-positive (1P) band system of molecular nitrogen. The arrays are used in pairs; each pair is filtered at a different wavelength. For sprite imaging, one pair is filtered using a 650-nm longpass optical filter, covering the N2 1P emission band system, and the other pair is filtered from ∼300 to 450 nm, covering the N+ 2 first-negative (1N) emission band system. For airglow and precipitation studies, the filters used are 10-nm bandwidth filters centered at 630.0- (atomic oxygen), 557.7- (atomic oxygen), or 427.8-nm (N+ 2 1N) primary low-energy emissions in the upper atmosphere. Each PMT element has an active area of 0.8 mm × 16 mm, with 0.2 mm between each element, yielding a square 16 mm × 16 mm array. Within each pair of PMTs, the arrays are rotated 90◦ with respect to each other so that one array measures vertical stratification, while the other measures horizontal stratification. The combination of the two will be discussed later. These PMTs were chosen: 1) because of the square active area and 2) because no multianode PMTs are currently available in a square 2-D array with better than 4 × 4 pixel resolution and a response above 650 nm. This extended red response is necessary for sprite imaging, as sprites primarily emit in the N2 1P band system, which extends from 650 nm up to near 1 μm.
Fig. 2. PIPER functional block diagram. (Red arrows) Signal data path. (Green arrows) Power. (Blue arrows) Control signal paths.
Fig. 3.
PIPER optical components.
Outside the filters, the PMTs are outfitted with Uniblitz CS45 electronic shutters for light protection during daytime and periods of bright light. The shutters are controlled through a power switch for day/night operation and through a photodiode switching circuit, which responds to intense light. The photodiode switch uses a simple comparator, with hysteresis, to determine if the ambient light level is above the acceptable calibrated threshold. Upon detection of bright light, a 5-V logic pulse is sent to the shutter controller, which then closes the shutters. The configuration is shown in Fig. 3.
Authorized licensed use limited to: IEEE Xplore. Downloaded on January 9, 2009 at 16:40 from IEEE Xplore. Restrictions apply.
MARSHALL et al.: FAST PHOTOMETRIC IMAGING USING ORTHOGONAL LINEAR ARRAYS
3887
Between the optical filter and the active area of each PMT is a standard 50-mm F/1.4 Canon camera lens. Given the 16-mm active area and the 50-mm focal length of the lens, this yields a ∼18◦ square field of view of each array. This was designed to measure 0–100-km altitudes at a range of ∼500 km, for measuring sprites and gigantic jets [5]. The optical filters are interference filters, meaning that their transmitted wavelength is a function of the incident angle, with the center wavelength changing according to �1/2 � � n �2 e 2 sin (θ) λθ = λ0 1 − n∗
(1)
where ne is the index of refraction of the external medium (air), n∗ is the index of refraction of the filter glass (typically n∗ = 2.05 for narrow-band filters), and θ is the angle of incidence of a given ray. Thus, we determine that with an ∼18◦ field of view, the maximum angle of incidence is θ = 9◦ , and a 10-nm bandwidth filter is the narrowest bandwidth allowable for this lens arrangement. Alternatively, for a wider field of view, telecentric optics could be used to collimate the incoming rays before filtering. The optics are fitted together with custom aluminum tubes, precisely machined at Stanford. The lens attaches to a tube of precise length, which leaves the lens at the effective focal length distance to the PMT to a tolerance of ±0.5 mm. There is a space between the anodes of the PMT of 0.2 mm, so the error in the focal length has no effect on the focus. A second custom aluminum piece threads to the front of the lens and holds the optical filter and shutter. Both pieces are black-anodized to minimize reflections. B. Electronics The PMTs are powered by a Hamamatsu C4900 power supply, which takes a 15-V input and outputs from −100 to −1200 V at currents of ∼ 1 μA. The specific high voltage sets the “gain” of the PMT and can be controlled with either a potentiometer or a 0–5-V input. In its present configuration, the PIPER system uses potentiometers for each power supply, but future upgrades will include a software-controlled microcontroller with dc power output to control the gain voltage. The PMT elements convert photons to current, and these currents are output on 16 coaxial lines and are immediately input into transimpedance amplifiers with 1-MΩ impedance. The outputs of these amplifiers are fed to an eight-pole Chebyshev antialias filter with a low-pass cutoff at 1200 Hz or 12 kHz, depending on the application [the data acquisition (DAQ) software can record at 2500 samples per second per channel (S/s/ch) or 25 kS/s/ch—see Section III]. All of this filtering takes place within the PIPER instrument, immediately adjacent to the PMTs. The output of these antialias filters is then fed along shielded cables to the DAQ system. C. Housing and Peripherals The primary concern with the housing of the PIPER system is waterproofing—the system is deployed outside and is subject
Fig. 4. PIPER deployed in the Pyrenees mountains in France in July 2007.
to weather variations. In some locations, snow, ice, and/or hail may also be a concern. Fig. 4 shows an example of effective waterproofing of PIPER in the Pyrenees mountains in France during July 2007. No commercially available weatherproof housings exist that will fit four Canon 50-mm lenses, and so a custom housing was built at Stanford. The housing is constructed from 3/8-in ABS plastic, and the front window is 3/16-in P99 acrylic, which has 92% transmission at optical wavelengths. The four walls of the housing container are sealed with latex sealant; the top and the front window are sealed using foam weatherstrip. All connectors are Amphenol weatherproof industrial connectors. 1) CCD Camera: The PIPER image reconstruction algorithm requires a low-speed high-resolution image to operate with any accuracy. As such, PIPER is deployed with a CCD camera coaligned (see Fig. 4—the CCD camera is housed in the smaller box that is partially visible). We use a Watec 902H3 CCD camera, which has a minimum illumination of 0.0002 lx (equivalent to a moonless overcast night sky), and a Pentax f/1.2 6-mm lens. This camera has a 1/3-in diagonal CCD chip with 768 × 494 pixels and a pixel size of 6.35 μm × 7.40 μm. The camera is contained in its own waterproof housing. The camera video signal is input to the same computer via a universalserial-bus capture device, and recordings are made using the “UFOCapture” software. This software allows the user to trigger video recordings from user-specified intensity changes over a user-specified partial area of the field of view and/or to record at specified intervals (i.e., 1-s video every 15 min). 2) Pan/Tilt Control: Remote pointing of the instrument is achieved with a Quickset QPT90-IC pan/tilt unit. This is a fully waterproof motorized pan/tilt with RS-232 control and positional repeatability to an accuracy of 0.25◦ . This unit is supplied with Windows control software, which is easily remotely operated. The software additionally allows us to program preset positions and easily moves to those positions; this has proven useful, for instance, in cases when we know where to expect electron precipitation under particular geomagnetic conditions.
Authorized licensed use limited to: IEEE Xplore. Downloaded on January 9, 2009 at 16:40 from IEEE Xplore. Restrictions apply.
3888
IEEE TRANSACTIONS ON GEOSCIENCE AND REMOTE SENSING, VOL. 46, NO. 11, NOVEMBER 2008
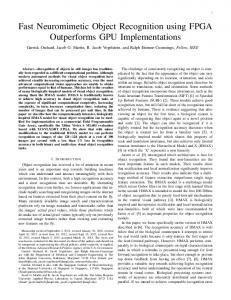
Fig. 5. Perth experiment in April 2006. (Left) Model predictions of optical emissions (557.7-nm oxygen line) due to electron precipitation. The camera view from Perth shows the integrated emissions through a 3-D emitting region; the top view shows what a satellite would see. (Right) Data from the experiment, from both cameras, and from PIPER. PIPER data are an average over the 16 channels to compare similar fields of view with the camera. The 570.0-nm measurement is made as a background reference. Variations in the 560.0-nm intensity that do not appear at 570.0 nm show natural emissions from atomic oxygen. Bottom panels show a zoomed-in view of the data, demonstrating the time resolution of PIPER compared to these sensitive cameras. The red dashed lines show a time period when the NWC transmitter turned off briefly for maintenance; during this time, we expect a reduction in emissions due to the “turning off” of precipitation, but no such signature is seen.
D. RPS A remote power switch (RPS) is used to turn the system on and off at desired times, without the necessity of an operator. The hardware is a Western Telematic, Inc., RPS-10, capable of switching up to 15 A at 120 VAC through simple American Standard Code for Information Interchange commands. The power switch is used to control power to the PMT arrays and electronic filters and to the Uniblitz shutters, which means that the shutters are forced closed when the power is switched off. III. S OFTWARE DAQ and storage is achieved using C++ software developed at Stanford. The software has many application-specific features, including support for remote operation, in that the software must continue to operate unmanned for months. It can operate without user oversight for long periods of time, automatically recovering in the event of operating-system-induced reboots or power outages. To readily access data, a specified amount of data is sent back to a server at Stanford via FTP at specified times of the day, usually when the system is not recording (daytime). To reduce traffic, the full 25-kS/s/ch data are filtered and resampled to a lower rate (50 S/s/ch) in real time, and only these lower resolution data are sent back. The FTP transfer also allows a method of verifying, from Stanford, that the system is normally operating. As mentioned earlier, the software can record at 2500 S/s/ch or 25 kS/s/ch, and switching between the two modes can be remotely done in a few seconds. When recording is made at
2500 S/s/ch (for airglow or precipitation studies), samples are actually taken at the full resolution of 25 kS/s/ch, then digitally filtered, and downsampled in real time. This process prevents aliasing and improves the SNR over the full-resolution data. Additionally, in both modes, data are low-pass filtered for antialiasing and resampled to 50 S/s/ch. These low-resolution data can be sent to Stanford via FTP as mentioned earlier, allows for easy viewing of data from an entire day (at 2500 S/s/ch over 64 channels, 8 h of data still accumulates 4.6 GB of data), and is often sufficient for scientific purposes (for instance, in precipitation studies, where 2–5-s periodic variations in intensity are of interest). A. Other Software The RPS unit is controlled by another C++ software program developed at Stanford. This software enables simple on/off capability through buttons, as well as scheduling on/off events at specified times. A text file is provided with on/off times each day for a year; the software reads the file and locates the next event based on the computer clock (synchronized to an Internet time service in GMT). The software also automatically starts upon reboot so that the system is not accidentally left on in the case of a computer restart. IV. PIPER D EPLOYMENTS Versions of the PIPER instrument have been deployed several times during the past two years. The first full experiment
Authorized licensed use limited to: IEEE Xplore. Downloaded on January 9, 2009 at 16:40 from IEEE Xplore. Restrictions apply.
MARSHALL et al.: FAST PHOTOMETRIC IMAGING USING ORTHOGONAL LINEAR ARRAYS
using the instrument in its completed state occurred at the Perth Observatory near Perth, Australia. Perth is ∼1200 km south of the North West Cape (NWC) very-low-frequency (VLF) transmitter, operated by the U.S. Navy. This transmitter radiates 1 MW at 19.8 kHz. The transmitter is known to produce precipitation due to the small amount of wave energy that leaks into the Earth’s magnetosphere, causing pitch-angle scattering of radiation belt electrons [10]. As they impinge on the increasingly thicker upper atmosphere, these precipitating electrons are expected to produce a few hundred rayleighs of optical emissions, depending on geomagnetic conditions, as shown in Fig. 5. The predicted precipitating fluxes in Fig. 5 are calculated using the ray-tracing methodology described in [11], adapted for ground-based transmitters in [12]; the secondary ionization and the optical emissions shown are calculated via the Monte Carlo methods described in [13]. For our experiment, PIPER was taken to Perth along with two high-sensitivity Roper Scientific cameras. These cameras record 30-s integrated images at very low light levels, thanks to CCD cooling down to −40 ◦ C. Fig. 5 shows camera traces next to PIPER photometric traces averaged down to 1 Hz, for one of a handful of times during the two-week-long 2006 experiment that the NWC transmitter briefly turned off. The PIPER PMTs were filtered at 560.0 and 570.0 nm, with 10-nm bandwidths, to catch the 557.7-nm atomic oxygen emission line and a “background” measurement near in wavelength. During this experiment, no verifiable signatures of precipitation were observed, since the transmitter was continuously operating most of the time. Nevertheless, the comparison quantifies the sensitivity of the PIPER instrument compared to these low-light cameras. Note that the transmitter-OFF period shown is less than the camera integration time of 30 s, so it is unlikely that the camera would be able to see the result. In future experiments, it is desirable that the transmitter be turned on and off with a prescribed pattern (e.g., 5-s ON and 5-s OFF) so that evidence for such periodicity can be extracted in postprocessing using superposed epoch and/or long-time integrated spectral analysis methods, which have been used for subionospheric VLF sensing of such periodic precipitation [14], [15]. When precipitation signatures are detectable, PIPER can provide a 2-D structure for each of the wavelength bands observed, and these variations can be compared with the predictions shown at the top left of Fig. 5. The PIPER instrument has also been deployed at the HighFrequency Active Auroral Research Program (HAARP) facility in Gakona, AK, numerous times for both airglow and precipitation measurements. In the latter case, precipitation is expected to be caused by extremely low frequency (ELF)/VLF signals injected into the magnetosphere by the HAARP heater or by natural ELF/VLF chorus emissions [16]. For airglow experiments, the heater directly heats the F-region ionosphere, resulting in optical emissions. The heater operates at HF radio frequencies (2.7–10 MHz) and radiates a vertical beam. This HF radiation is either directly turned on and off (for airglow experiments) or modulated at ELF frequencies of a few kilohertz and turned on and off (for precipitation studies). Four experimental campaigns have been run using the PIPER instrument since January 2006. Fig. 6 shows example data from
3889
Fig. 6. Example data from the HAARP facility in Gakona, AK. (Top panel) Green-filtered (557.7-nm) emissions, averaged over 16 channels in one PMT. (Lower panel) 16 channels averaged from a blue-filtered (427.8-nm) PMT. The top two panels are 60 min of data, and the lower two panels are a 10-min zoom. Notice the rapid ∼30-s variations in the green-line natural aurora, which would not be observed by a 30-s integrating camera.
a recent campaign in January 2008. The example shows data from the 16 channels of one PMT of each emission line (427.8 and 557.7 nm, which are shown in blue and green, respectively), averaged into one time series. In the lower two plots, the data are zoomed in to a half-hour period, wherein rapid (∼30-s period) oscillations of the green line signal are seen; these would not be observed by typical cameras used for airglow with 30-s integrations. Although evidence of precipitation produced by HAARP-generated ELF/VLF signals has not yet been seen from these experiments, this example shows weak natural auroral emissions in the green line, far below intensities visible with the naked eye, with a time resolution that cannot be observed by CCD cameras. For artificial airglow experiments at HAARP, PIPER has the capability to answer questions about the spatial–temporal development of optical emissions. In [17], the authors noticed an interesting 2-D structure to the green-line (557.7-nm) emissions (see [17, Fig. 2]) and attributed it to “trapping of the HF wave by large-scale (∼15 km) F region irregularities.” However, the images taken had a 30-s integration; when one considers the ∼0.7-s lifetime [3] of these emissions, the evolution of this structure over the duration of the HAARP pulse should prove to be very dynamic. The PIPER photometer array is ideally suited to image such structures with better than 1-s resolution. Recent and future experiments have been designed to investigate the time evolution of optical emissions.
Authorized licensed use limited to: IEEE Xplore. Downloaded on January 9, 2009 at 16:40 from IEEE Xplore. Restrictions apply.
3890
IEEE TRANSACTIONS ON GEOSCIENCE AND REMOTE SENSING, VOL. 46, NO. 11, NOVEMBER 2008
Fig. 7. Example sprite and elve from July 10, 2007. (Top panels) Sprite in one camera field (16.7-ms integration) with PIPER fields of view overlaid. (Bottom panels) Vertical and horizontal PIPER photometer arrays. See the text for a detailed description of features.
In the summer of 2007, two PIPER instruments were deployed for sprite studies—one at Pic du Midi in the French Pyrenees (Fig. 4) and the other at the Yucca Ridge Field Station (YRFS) near Fort Collins, CO. The instrument in France was deployed in support of the EuroSprite 2007 campaign, one of a recurring set of campaigns in Europe (see, e.g., [18]). The PIPER installation was located at 2877-m altitude and far from city lights, making it an ideal location for sprite imaging. Sprites and elves were recorded by PIPER during this experiment but are not shown here for brevity. YRFS has been a focal point of sprite research for many years. Our deployment at YRFS was in conjunction with an experiment aimed at measuring features of sprites in a telescopic field of view using a high-speed intensified camera (see, e.g., [4]). In addition, two wide-field-of-view video-rate cameras were deployed, and a VLF receiver was used to measure the signatures of sprite-inducing lightning strokes. Some examples of PIPER data from this experiment are shown in Section V.
A photometric imaging system such as PIPER is particularly well suited for the observation of a rapidly varying optical scene such as that which occurs for sprites and elves. These luminous high-altitude phenomena occur in association with intense lightning discharges and are produced by quasi-static and electromagnetic fields imposed at high altitudes by the removal of charge in lightning [19], [20]. The emissions are generally subvisual, particularly for elves, and only last for ∼1–100 ms [4], [7], [21]. V. E XAMPLE D ATA F ROM THE 2007 S PRITE C AMPAIGN Figs. 7 and 8 show example data from the PIPER instrument deployed in 2007 at YRFS. Fig. 7 shows a bright sprite viewed by an intensified CCD camera and by PIPER on July 10, 2007. The relative fields of view of the PIPER channels are shown on the camera image (note that both images are the same, reproduced to show both horizontal and vertical fields of view). This bright sprite is seen to saturate the horizontal
Authorized licensed use limited to: IEEE Xplore. Downloaded on January 9, 2009 at 16:40 from IEEE Xplore. Restrictions apply.
MARSHALL et al.: FAST PHOTOMETRIC IMAGING USING ORTHOGONAL LINEAR ARRAYS
3891
Fig. 8. Example sprite, halo, and elve from July 10, 2007. (Top panels) Two consecutive camera frames (30-ms integrations). (Middle panels) 2-ms period of PIPER data for both arrays. (Bottom panels) Zoomed-out (50-ms) period of data. See the text for a detailed description of the features.
Authorized licensed use limited to: IEEE Xplore. Downloaded on January 9, 2009 at 16:40 from IEEE Xplore. Restrictions apply.
3892
IEEE TRANSACTIONS ON GEOSCIENCE AND REMOTE SENSING, VOL. 46, NO. 11, NOVEMBER 2008
PMT channels of PIPER. Of particular interest in this example are a number of features. 1) Sprite timing: Note that PIPER can accurately determine the initiation time of the sprite, in this case at 06:33:56.7125 (±0.1 ms) UT. We also note that the sprite initiates at nearly the same time (once again, ±0.1 ms) in five PMT channels. 2) Elve: In this example, an elve can be observed very faintly in all channels in the horizontal slice and in the highest altitude channels of the lowest slice. A further discussion on elves is given with the next example. In Fig. 8, a second sprite example is shown, observed on the same day, July 10, 2007. The camera images (consecutive frames) are shown at the top, the middle panels are PIPER data zoomed in time to a 2-ms sequence, and the bottom panels show the full 50-ms sequence of the sprite. This example shows a cluster of carrot sprites, preceded by a bright halo (halos are not always visible in the camera images). Note that once again, the elve is not visible in the camera image but is very obvious in the PIPER data. Once again, a number of interesting features are evident. 1) Sprite: This sprite appears in two parts, i.e., the longduration persistent emissions seen in the camera and seen to persist in PIPER for ∼30 ms and some shortduration low-altitude features, visible in the lower vertical channels (2–8) at about 5 ms on the x-axis of the lower right panel. These are likely to be fast sprite tendrils, as in the previous example, which persist for a fraction of a millisecond, as described in [22], but faint and fast enough that they do not appear in the camera frame. 2) Halo: A very bright halo is visible in both the camera and PIPER data, which is easily distinguished from the elve, described next. At its brightest, this halo covers channels 6–15 in the horizontal array, which equates to ∼90 km in width; however, the halo can be seen to faintly reach across all channels, potentially doubling that width. We should note, however, that this width may be exaggerated by scattering from the PIPER housing window. The timing of the halo is seen with great accuracy, demonstrating a lifetime of ∼1.2 ms, as well as its altitude range and coverage. Note also that the rounded shape in the zoomed horizontal array demonstrates that the halo radially expands with time. 3) Elve: Although the elve faintly appears in the 50-ms lower panels, it is prominent in the zoomed 2-ms panels. In the vertical array, the curve of the elve signature is evidence of its descending altitude with time, as predicted in [23]. In the horizontal channels, a similar curvature demonstrates its expansion radially with time, as well as the fact that it is centered over the halo. A slightly weaker center of the elve (in channel 10) is evidence for the “hole” that has been predicted [20] based on a lightning electromagnetic pulse produced by a vertical return stroke, with a null in the vertical direction. The null is not perfect because near-field effects come into play at this altitude (∼90 km). The elve can also be measured in time, and we note a typical duration of ∼0.15 ms, consistent over the entire width of the elve.
4) Horizon lights: Although not of scientific interest, we note that a bright light on the horizon, not visible in the camera frames, appears at the intersection of horizontal PMT channel 4 and vertical PMT channel 0. The PMT channels easily pick up this light and, furthermore, demonstrate the 120-Hz output of the light that appears steady to the eye and to the CCD camera. Similar horizon lights are seen in the example in Fig. 7, in horizontal channel 3 and vertical channel 1. VI. I MAGE R ECONSTRUCTION A custom image reconstruction algorithm that has been developed for use with PIPER data, which takes the two 1-D slices of photometer data along with slower 2-D camera images and reproduces 16 × 16 pixel images, was presented and described in detail in [8]. However, a short description of the limitations of the algorithm as it applies to our specific experiments is warranted. Reference [8] covered in detail the types of image scenarios that are reconstructed best using the algorithm described therein. The algorithm produced the worst errors when discrete radiating features appear on the same column or row in the 2-D grid; i.e., features appear vertically or horizontally aligned. In such scenarios, the reconstruction algorithm tends to cast “shadows” along the row or column in question. For sprites, such a scenario would only be relevant in the case of telescopic imaging, as beads and similar features would not be resolved in a 16 × 16 array. For electron precipitation and airglow studies, discrete features do not arise; the precipitation signature is expected to be slowly varying over the field of view (see Fig. 5), and for airglow, the patterns observed so far in slow 2-D images are continuous (as in [17] and the annular structures observed in [24]). As such, we do not expect to encounter significant errors in the reconstruction of such scenarios. VII. S UMMARY The PIPER instrument records optical emissions at high sensitivity with high time resolution and some spatial resolution. This combination of capabilities provides a means of creating high-speed image data at very low light levels. Although we have not shown image reconstruction in this paper, a custom algorithm for doing so has been developed in [8]. This new instrument can thus be used to measure the time and space evolution of a fast complex scene such as the highaltitude emissions above large lightning strokes (sprites, halos, and elves) as in this paper or to measure low-light emissions with spatial resolution, as in electron precipitation and airglow studies. ACKNOWLEDGMENT The authors would like to thank W. Lyons for hosting the experiment at Yucca Ridge, Dr. J. Biggs and the staff of the Perth Observatory for hosting the experiment at Perth, and M. Karjala and the staff at HAARP for their assistance in the experiments there.
Authorized licensed use limited to: IEEE Xplore. Downloaded on January 9, 2009 at 16:40 from IEEE Xplore. Restrictions apply.
MARSHALL et al.: FAST PHOTOMETRIC IMAGING USING ORTHOGONAL LINEAR ARRAYS
R EFERENCES [1] M. G. McHarg, H. C. Stenbaek-Nielsen, and T. Kammae, “Observations of streamer formation in sprites,” Geophys. Res. Lett., vol. 34, no. 6, p. L06 804, 2007. [2] U. S. Inan, S. C. Reising, G. J. Fishman, and J. M. Horack, “On the association of terrestrial gamma-ray bursts with lightning and implications for sprites,” Geophys. Res. Lett., vol. 23, no. 9, pp. 1017–1020, 1996. [3] T. R. Pedersen, M. McCarrick, E. Gerken, C. Selcher, D. Sentman, H. C. Carlson, and A. Gurevich, “Magnetic zenith enhancement of HF radio-induced airglow production at HAARP,” Geophys. Res. Lett., vol. 30, no. 4, p. 1169, 2003. [4] R. A. Marshall and U. S. Inan, “High-speed telescopic imaging of sprites,” Geophys. Res. Lett., vol. 32, no. 5, p. L05 804, 2005. [5] V. P. Pasko and H. C. Stenbaek-Nielsen, “Diffuse and streamer regions of sprites,” Geophys. Res. Lett., vol. 29, no. 10, p. 1440, 2002. [6] C. P. Barrington-Leigh, “Fast photometric imaging of high altitude optical flashes above thunderstorms,” Ph.D. dissertation, Stanford Univ., Stanford, CA, 2000. [7] H. C. Stenbaek-Nielsen, M. G. McHarg, T. Kanmae, and D. D. Sentman, “Observed emission rates in sprite streamer heads,” Geophys. Res. Lett., vol. 34, no. 11, p. L11 105, 2007. [8] R. T. Newsome and U. S. Inan, “High-frame-rate reconstruction of a dynamic 2-d scene from continuous orthogonal projections and low-rate video,” IEEE Trans. Geosci. Remote Sens., 2008. in press. [9] H. Fukunishi, Y. Takahashi, M. Kubota, K. Sakanoi, U. S. Inan, and W. A. Lyons, “Elves: Lightning-induced transient luminous events in the lower ionosphere,” Geophys. Res. Lett., vol. 23, no. 16, pp. 2157–2160, 1996. [10] M. Parrot, J. A. Sauvaud, J. J. Berthelier, and J. P. Lebreton, “First in-situ observations of strong ionospheric perturbations generated by a powerful VLF ground-based transmitter,” Geophys. Res. Lett., vol. 34, no. 11, p. L11 111, 2007. [11] J. Bortnik, U. S. Inan, and T. F. Bell, “Temporal signatures of radiation belt electron precipitation induced by lightning generated MR whistler waves. Part I: Methodology,” J. Geophys. Res., vol. 111, no. A2, p. A02 204, 2006. [12] P. Kulkarni, U. S. Inan, T. F. Bell, and J. Bortnik, “Precipitation signatures of ground-based VLF transmitters,” J. Geophys. Res., vol. 113, p. A07 214, 2008. DOI:10.1029/2007JA012569. [13] N. G. Lehtinen, U. S. Inan, and T. F. Bell, “Effects of thunderstorm-driven runaway electrons in the conjugate hemisphere: Purple sprites, ionization enhancements, and gamma rays,” J. Geophys. Res., vol. 106, no. A12, pp. 28 841–28 856, 2001. [14] U. S. Inan, “VLF heating of the lower ionosphere,” Geophys. Res. Lett., vol. 17, no. 6, pp. 729–732, 1990. [15] U. S. Inan, M. Golkowski, M. K. Casey, R. C. Moore, W. Peter, P. Kulkarni, P. Kossey, and E. Kennedy, “Subionospheric VLF observations of transmitter-induced precipitation of inner radiation belt electrons,” Geophys. Res. Lett., vol. 34, no. 2, p. L02 106, 2007. [16] U. S. Inan, M. Golkowski, D. L. Carpenter, N. Reddell, R. C. Moore, T. F. Bell, E. Paschal, P. Kossey, E. Kennedy, and S. Z. Meth, “Multihop whistler-mode ELF/VLF signals and triggered emissions excited by the HAARP HF heater,” Geophys. Res. Lett., vol. 31, no. 24, p. L24 805, 2004. [17] F. Djuth, T. R. Pedersen, E. A. Gerken, P. A. Bernhardt, C. A. Selcher, W. A. Bristow, and M. J. Kosch, “Ionospheric modification at twice the electron cyclotron frequency,” Phys. Rev. Lett., vol. 94, no. 12, p. 125 001, 2005. [18] T. Neubert, T. H. Allin, E. Blanc, T. Farges, C. Haldoupis, A. Mika, S. Soula, L. Knutsson, O. van der Velde, R. A. Marshall, U. Inan, G. Satori, J. Bor, A. Hughes, A. Collier, S. Laursen, and I. L. Rasmussen, “Co-ordinated observations of transient luminous events during the EuroSprite2003 campaign,” J. Atmos. Sol.-Terr. Phys., vol. 67, no. 8/9, pp. 807–820, 2005. [19] V. P. Pasko, “Dynamic coupling of quasi-electrostatic thundercloud fields to the mesosphere and lower ionosphere: Sprites and jets,” Ph.D. dissertation, Stanford Univ., Stanford, CA, 1996. [20] U. S. Inan, C. P. Barrington-Leigh, S. Hansen, V. S. Glukhov, T. F. Bell, and R. Rairden, “Rapid lateral expansion of optical luminosity in lightning-induced ionospheric flashes referred to as ‘elves’,” Geophys. Res. Lett., vol. 24, no. 5, pp. 583–586, 1997. [21] M. Stanley, P. Krehbiel, M. Brook, C. Moore, W. Rison, and B. Abrahams, “High speed video of initial sprite development,” Geophys. Res. Lett., vol. 26, no. 20, pp. 3201–3204, 1999. [22] R. A. Marshall, U. S. Inan, and W. A. Lyons, “On the association of early/fast very low frequency perturbations with sprites and rare examples
3893
of VLF backscatter,” J. Geophys. Res., vol. 111, no. D19, p. D19 108, 2006. [23] C. P. Barrington-Leigh, U. S. Inan, and M. Stanley, “Identification of sprite and elves with intensified video and broadband array photometry,” J. Geophys. Res., vol. 106, no. A2, pp. 1741–1750, 2001. [24] M. J. Kosch, M. T. Rietveld, A. Senior, I. W. McCrea, A. J. Kavanagh, B. Isham, and F. Honary, “Novel artificial optical annular structures in the high latitude ionosphere over EISCAT,” Geophys. Res. Lett., vol. 31, no. 12, p. L12 805, 2004.
Robert Marshall (S’07) received the B.S. degree in electrical engineering from the University of Southern California, Los Angeles, in 2002, and the M.S. degree in electrical engineering from Stanford University, Stanford, CA, in 2004. He is currently working toward the Ph.D. degree in electrical engineering in the Space, Telecommunications and Radioscience Laboratory, Stanford University. His current research activities include high-speed telescopic imaging of transient luminous events, modeling and data analysis of ionospheric perturbations of subionospheric very-low-frequency transmitter signals, and measurements of optical signatures of electron precipitation in the ionosphere. Dr. Marshall is the recipient of an Outstanding Student Paper Award at the 2004 American Geophysical Union Fall Meeting and the First Place award in the 2007 International Radio Science Union Student Paper Competition.
Robert Newsome (S’03) was born in Knoxville, TN, on June 28, 1982. He received the B.S.E.E. degree from the University of Texas, Austin, in 2005 and the M.S.E.E. degree from Stanford University, Stanford, CA, in 2007. He is currently working toward the Ph.D. degree in electrical engineering in the Space, Telecommunications and Radioscience Laboratory, Stanford University, under Prof. U. Inan. His research interests include the measurement and characterization of optical signatures of ionospheric processes and their application toward ionospheric process modeling. Such ionospheric processes include transient luminous events, e.g., sprites, and charged-particle precipitation. Dr. Newsome is a member of Tau Beta Pi and Eta Kappa Nu.
Umran Inan (S’76–M’77–SM’99–F’06) was born in Turkey on December 28, 1950. He received the B.S. and M.S. degrees in electrical engineering from the Middle East Technical University, Ankara, Turkey, in 1972 and 1973, respectively, and the Ph.D. degree in electrical engineering from Stanford University, Stanford, CA, in 1977. He is currently a Professor of electrical engineering with Stanford University, where he serves as the Director of the Space, Telecommunications, and Radioscience Laboratory, Stanford. He actively conducts research in electromagnetic waves in plasmas, lightning discharges, ionospheric physics, and very-low-frequency remote sensing. He has served as the Principal Ph.D. Dissertation Advisor for 28 students. Dr. Inan is a member of Tau Beta Pi, Sigma Xi, and the Electromagnetics Academy. He is a Fellow of the American Geophysical Union. He is the recipient of the 2007 Stanford University Allan V. Cox Medal for Faculty Excellence in Fostering Undergraduate Research and the 1998 the Stanford University Tau Beta Pi Award for Excellence in Undergraduate Teaching. He has served as the Chair of the United States National Committee of the International Union of Radio Science (URSI) and the International Chair of Commission H (Waves in Plasmas) of URSI.
Authorized licensed use limited to: IEEE Xplore. Downloaded on January 9, 2009 at 16:40 from IEEE Xplore. Restrictions apply.